


Abstract
18F-FDG PET is well established in the field of oncology for diagnosis and staging purposes and is increasingly being used to assess therapeutic response and prognosis. Many quantitative indices can be used to characterize tumors on 18F-FDG PET images, such as SUVmax, metabolically active tumor volume (MATV), total lesion glycolysis, and, more recently, the proposed intratumor uptake heterogeneity features. Although most PET data considered within this context concern the analysis of activity distribution using images obtained from a single static acquisition, parametric images generated from dynamic acquisitions and reflecting radiotracer kinetics may provide additional information. The purpose of this study was to quantify differences between volumetry, uptake, and heterogeneity features extracted from static and parametric PET images of non–small cell lung carcinoma (NSCLC) in order to provide insight on the potential added value of parametric images. Methods: Dynamic 18F-FDG PET/CT was performed on 20 therapy-naive NSCLC patients for whom primary surgical resection was planned. Both static and parametric PET images were analyzed, with quantitative parameters (MATV, SUVmax, SUVmean, heterogeneity) being extracted from the segmented tumors. Differences were investigated using Spearman rank correlation and Bland–Altman analysis. Results: MATV was slightly smaller on static images (−2% ± 7%), but the difference was not significant (P = 0.14). All derived parameters, including those characterizing tumor functional heterogeneity, correlated strongly between static and parametric images (r = 0.70–0.98, P ≤ 0.0006), exhibiting differences of less than ±25%. Conclusion: In NSCLC primary tumors, parametric and static baseline 18F-FDG PET images provided strongly correlated quantitative features for both standard (MATV, SUVmax, SUVmean) and heterogeneity quantification. Consequently, heterogeneity quantification on parametric images does not seem to provide significant complementary information compared with static SUV images.
PET performed using 18F-FDG is increasingly being applied to detect tumors, perform initial staging, monitor and plan treatment, evaluate therapeutic response, and determine prognosis (1–4). Within this context, quantitative features can be used either from baseline PET images or from a comparison between pretreatment scans and during-treatment or posttreatment scans. The SUVmax from static images (55–65 min after injection) is the most commonly used, although it does not provide a comprehensive tumor characterization and may therefore be limited for some clinical applications (5,6). Additional standard features include SUVmean, metabolically active tumor volume (MATV), and total lesion glycolysis (TLG, defined as MATV × SUVmean) (7). Most 18F-FDG PET–derived features are sensitive to physiologic parameters such as body composition and blood glucose concentration that may add confounding factors to inter- or intrapatient comparisons (8). Recently, PET intratumor heterogeneity characterization has been shown to have a potential added predictive and prognostic value over simple SUV measurements (9,10). However, such studies have to date been based exclusively on static PET acquisitions, which are those most commonly used in clinical practice. An alternative consists in analyzing radiotracer kinetics to provide fully quantitative information (10), such as the metabolic rate of glucose (MRGlu). Among kinetic models, Patlak analysis is considered the gold standard for modeling tissue time–activity concentration curves derived from dynamic 18F-FDG PET images (11,12).
The fully quantitative parameters derived using such approaches have previously been shown to be useful in patient management (13), with differences being observed between static SUV images and parametric MRGlu images (14,15). First, SUV images reflect only the total activity, without any distinction between metabolized and unmetabolized 18F-FDG uptake. In Patlak analysis, the time integral of the input time–activity curve divided by plasma concentration is plotted on the horizontal axis versus activity on the vertical axis, whereas SUV approximates this integral by normalizing static activity concentrations using patient weight and injected dose.
Cheebsumon et al. observed different MATVs when delineated using static versus dynamic 18F-FDG images (16), whereas Visser et al. observed that MRGlu maps led to significantly smaller MATVs than SUV-based images (17). The magnitude of these differences can be explained by the delineation methodology used. Threshold-based methods have been shown to lack robustness relative to varying image properties (noise, contrast) (18), as is the case for static PET images versus parametric PET images (17).
The potential interest in applying dynamic imaging to characterize intratumor heterogeneity based on texture analysis has not, to our knowledge, been evaluated. A recent review referred to the potential of features derived from parametric maps calculated using kinetic analysis in conjunction with the temporal evolution of intratumor tracer uptake distribution (19), without an explicit evaluation in a given patient cohort. The present study aimed to assess the potential complementary value of dynamic acquisitions and to derive quantitative parametric images for characterizing intratumor heterogeneity using 18F-FDG PET. Our main objective was to quantify the potential differences between newly proposed intratumor heterogeneity characterization features from static SUV and parametric MRGlu 18F-FDG PET images derived using the Patlak linearization approach (11). For comparison purposes, the analysis was extended to other standard PET image–derived indices such as SUVmax, SUVmean, TLG, and MATV.
MATERIALS AND METHODS
Patients
We prospectively recruited 20 therapy-naive patients for whom primary surgical resection was planned for limited-stage non–small cell lung carcinoma (NSCLC). Tumors were required to be at least 3 cm in diameter in order to reduce the potential impact of partial-volume effects (PVE) and respiratory motion on the quantitative measurements (20). The study was approved by the Medical Ethics Review Committee of the Radboud University Nijmegen Medical Centre, and all patients gave written informed consent. The patient characteristics are summarized in Table 1.
Characteristics of the 20 Patients
18F-FDG PET Acquisition and Image Reconstruction
All 20 patients underwent a dynamic PET acquisition in list mode for 60 min using a Biograph Duo scanner (Siemens Healthcare) at a single bed position (159-mm axial length) after intravenous injection of a 3.3 MBq/kg average dose using an infusion pump (an 8-mL infusion of 18F-FDG at a rate of 0.2 mL/s followed by a 40-mL saline flush at a rate of 8.0 mL/s). A low-dose CT acquisition (40 mA and 130 kV) of the same area as that covered by the PET scan was used for PET attenuation correction and as an anatomic reference. The size of the CT transaxial matrix was 512 × 512 (0.98 × 0.98 mm), and the CT slice width was 3 mm.
PET data were reconstructed using a 45-frame protocol (a 10-s delay after 18F-FDG injection, 16 × 5 s, 4 × 10 s, 4 × 20 s, 4 × 30 s, 4 × 60 s, 4 × 120 s, 1 × 150 s, and 8 × 300 s). Each of the 45 frames was reconstructed using 2-dimensional ordered-subsets expectation maximization in 2 dimensions with 4 iterations and 16 subsets in a 256 × 256 × 53 image matrix (voxel size, 2.65 × 2.65 × 3.00 mm) followed by application of an isotropic gaussian filter of 5 mm in full width at half maximum. We applied CT-based attenuation correction using a bilinear transformation of Hounsfield units to the PET energy attenuation values, a delayed-window–based randoms correction, single-scatter-simulation–based scatter correction, and decay correction. No partial volume or respiratory motion corrections were considered.
The last time frame of the dynamic series (55–60 min after injection) was used to generate the SUV images. All voxel values (Bq/mL) were normalized to the administered activity per body weight. Residual activity in the infusion system was accounted for (i.e., SUV [g/mL]).
To derive MRGlu parametric maps, MRGlu values were calculated on a voxel-by-voxel basis based on the standard 2-compartment 18F-FDG model with trapping in the linear approximation (Patlak analysis) (12): where K1, k2, and k3 are the 3 rate constants of the 2-compartment model, Ki (mL/g/min) is the 18F-FDG influx constant, Cp,glu is the plasma glucose concentration, and LCFDG is the lumped constant (which is equal to 1). For the tissue time–activity curves, the images from frames 38–45 (i.e., 20–60 min after injection) were used, since for all tumors investigated the Patlak curves approached a straight line at 15–20 min after injection. An image-derived input function (plasma time–activity curve) was determined by considering the mean activity concentration in a manually drawn 3-dimensional volume of interest in the thoracic ascending aorta (whole blood). No plasma–to–whole-blood ratio or PVE corrections were applied. Voxelwise Ki values were subsequently determined by linear regression analysis on the Inveon Research Workplace (version 3; Siemens Healthcare) using the tissue time–activity curve and the image-derived whole-blood time–activity curve. Using the derived parametric images, we also derived for each tumor volume the metabolic rate volume (MRV = MRGlumean × volume), which was used to denote the parametric equivalent of TLG in SUV images.
Image Analysis
For all patients, the primary tumor MATV was delineated on the static SUV and parametric PET images. The automatic fuzzy locally adaptive Bayesian algorithm previously validated for accuracy, robustness, and reproducibility in PET (21,22) was used to minimize the impact of the delineation approach on the extracted features. From these delineated volumes, the following features were extracted from both static and parametric images: MATV, maximum value (SUVmax and Ki), metabolic volume products (TLG and MRV), and heterogeneity parameters, including the area under the curve of the cumulative intensity histogram (23) and textural features at both local and regional scales using previously optimized parameters (quantization into 64 levels of gray) (24). The area under the curve of the cumulative intensity histogram was calculated by considering all tumor voxels, consequently providing a global quantification of tumor heterogeneity. Local heterogeneity features were computed using a single cooccurrence matrix over all 13 spatial directions in 3 dimensions (20). These features highlight variations in intensity between contiguous voxels on the local scale and include homogeneity, entropy, and dissimilarity. Regional heterogeneity measurements were computed using matrices that link groups of intratumor voxels of similar intensity. These measurements include high-intensity emphasis and zone percentage (24). Most heterogeneity textural features used in this study were chosen according to previously published results regarding their reproducibility (25) and robustness both to functional tumor volume delineation approaches and to PVE (18,26).
Statistical Analysis
Statistical analysis was performed using MedCalc software. The statistics of each parameter’s distribution in both images were reported using the first and third quartiles, as well as the median. The Kolmogorov–Smirnov test was used to assess the normality of distributions. Agreement between parameters from static and parametric images was assessed using the Spearman rank coefficient, and differences were quantified using Bland–Altman analysis, reporting the mean ± SD and 95% confidence intervals of the differences and the upper and lower limits (UL and LL, respectively), defined as 1.96 × SD, after application of a log transformation to parameters with a nonnormal distribution. For SUVmax (or maximum Ki) and TLG (or MRV), only correlation coefficients are reported because the measures are not directly comparable between the two image types given the differences in units. P values of less than 0.05 were considered significant throughout the analyses.
RESULTS
Figure 1 shows examples of tumors on parametric Ki and SUV images and differences in the corresponding image indices. All features were normally distributed with the exception of MATV and TLG/MRV (Table 2). MATVs measured on static and parametric images were strongly correlated (r = 0.96; P < 0.0001; 95% confidence interval, 0.90–0.99) (Table 3). Slightly smaller MATVs were obtained on static images than on the corresponding parametric images, with nonstatistically significant differences (−2% ± 7%; P = 0.14; UL/LL, +11%/−15%) (Table 3; Fig. 2A). The smallest and largest absolute volume differences were 0 and 26.5 cm3, respectively, which were obtained for a very large tumor (>145 vs. 115 cm3 in the parametric vs. static images).
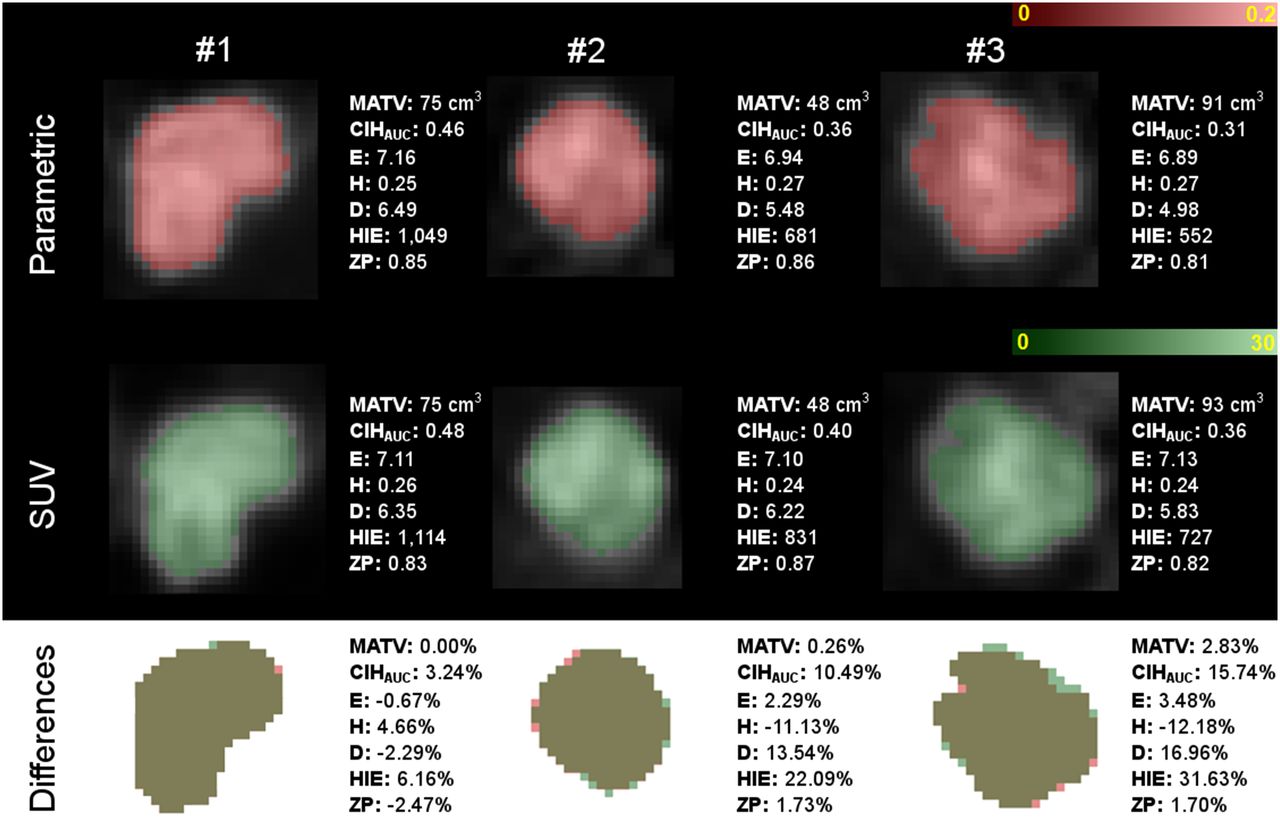
Three tumor examples, with parametric Ki and SUV images in top and middle rows, respectively, and differences between the two in bottom row. Examples 1, 2, and 3 correspond to cases with small, medium, and large differences, respectively, between parametric Ki and static SUV images. CIHAUC = area under curve of cumulative intensity histogram; D = dissimilarity; E = entropy; H = homogeneity; HIE = high-intensity emphasis; ZP = zone percentage.
Statistics and Normality (Kolmogorov–Smirnov Test) for Features Derived from Static and Parametric 18F-FDG PET Images
Bland–Altman and Spearman Rank Correlation Results for Comparison of Static and Parametric 18F-FDG PET Images

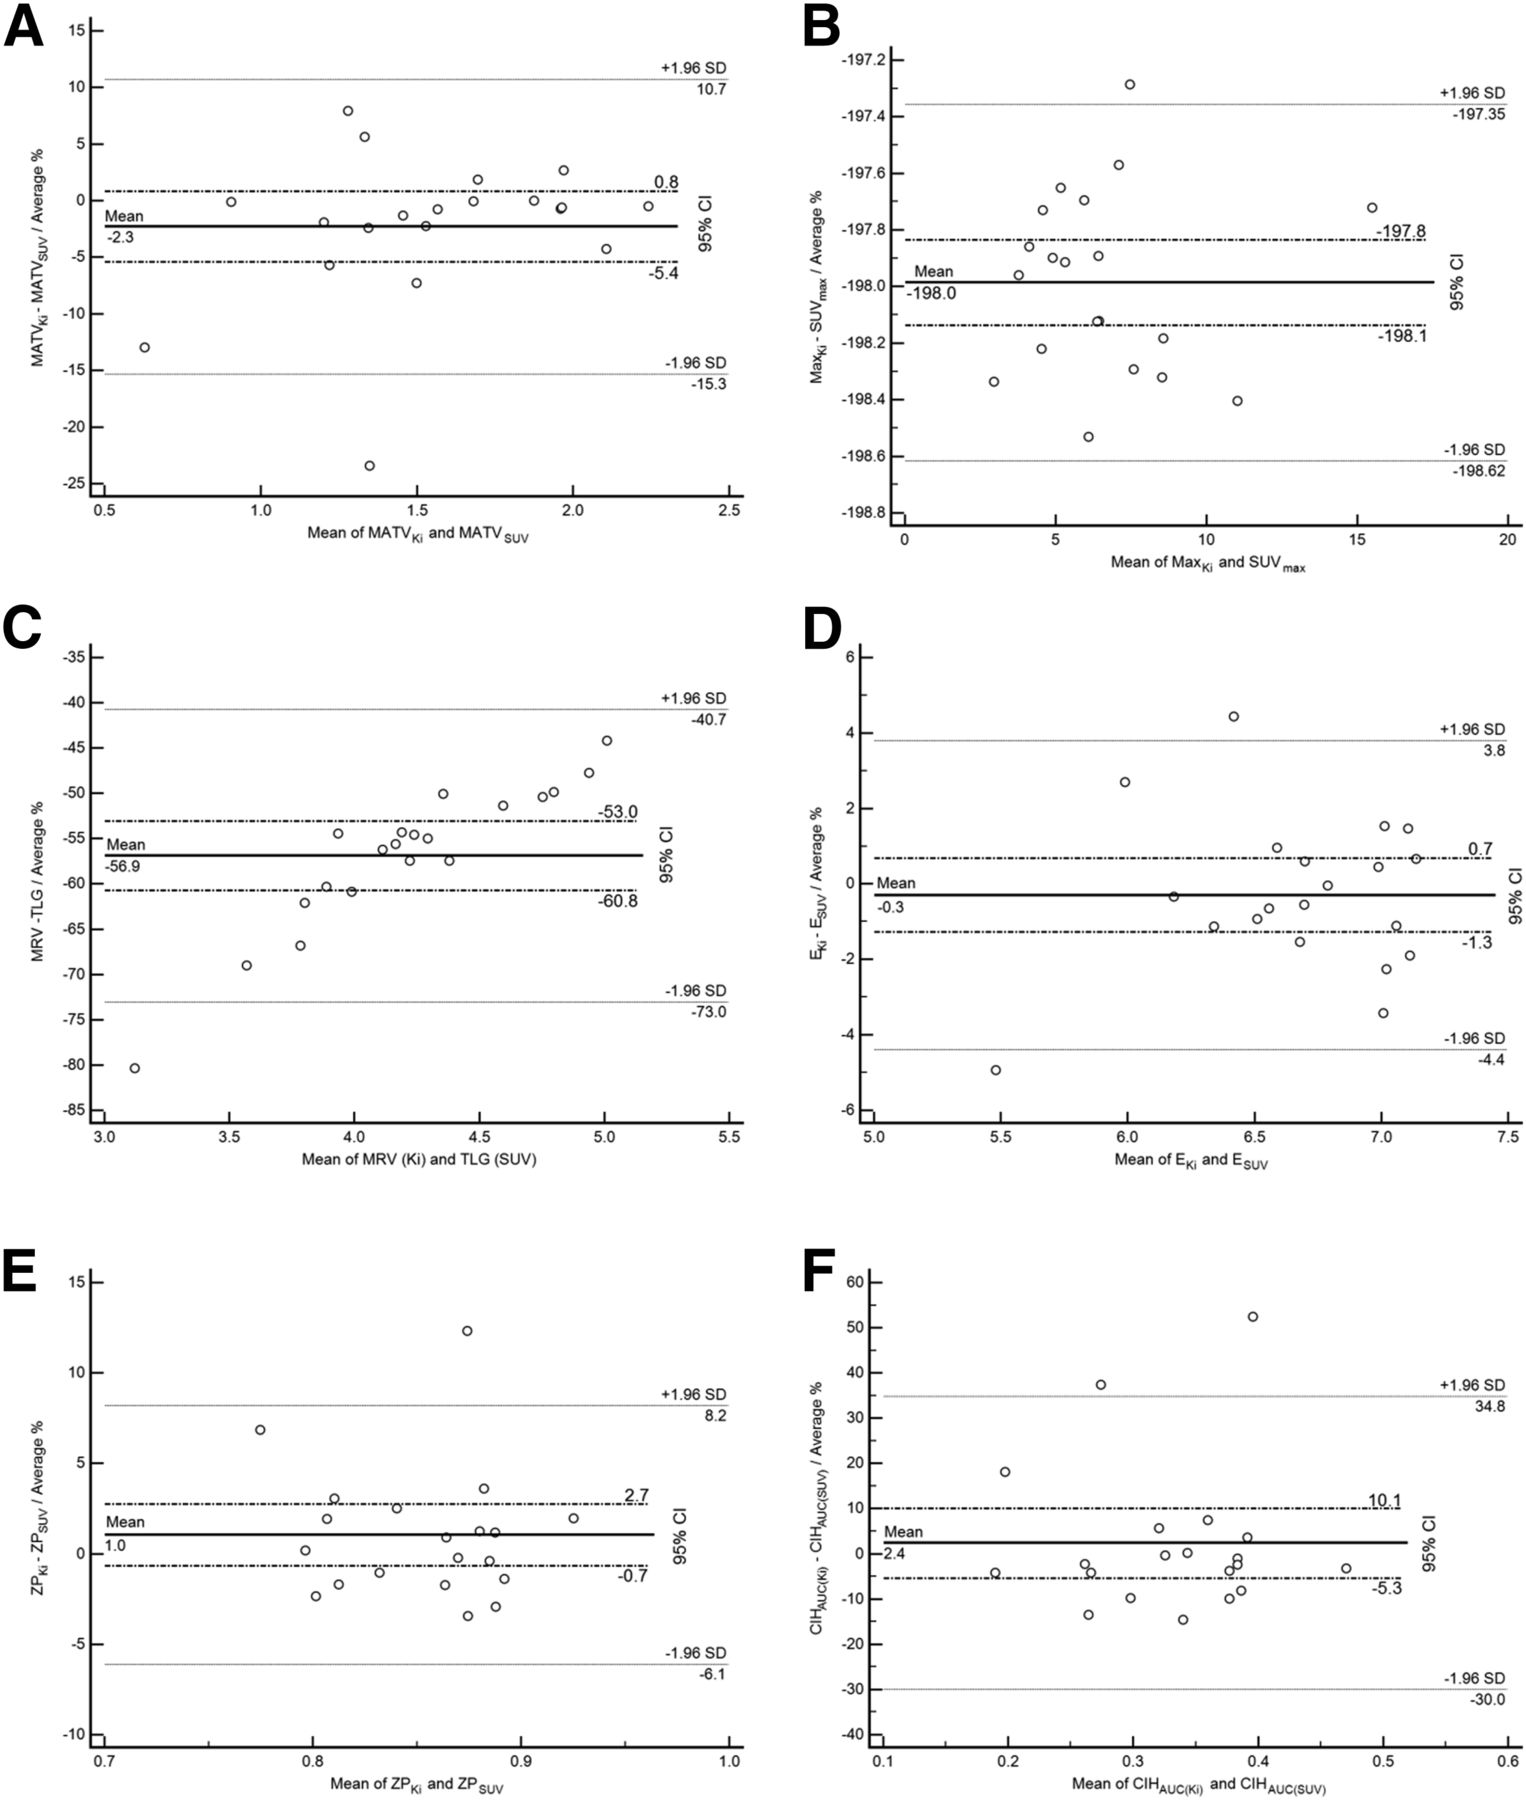
Bland–Altman plot of MATV (logarithmic transformation) (A), area under curve of cumulative intensity histogram (B), SUVmax/maximum Ki (C), TLG/MRV (logarithmic transformation) (D), entropy (E), and zone percentage (F). Each graph reports mean ± 1.96 SD and 95% confidence interval for mean of differences. AUC = area under curve; CIH = cumulative intensity histogram; E = entropy; ZP = zone percentage.
As shown in Figure 2B, SUVmax and maximum Ki correlated strongly (r = 0.9; P < 0.0001; 95% confidence interval, 0.76–0.99). Similarly, TLG and MRV correlated strongly, with a Spearman rank correlation coefficient of 0.98 (95% confidence interval, 0.94–0.99; P < 0.0001; Fig. 2C). Intratumor heterogeneity parameters for the static and parametric images also correlated (r = 0.7–0.91, P ≤ 0.0006), with less than a 21% SD and UL/LL within the ±40% range, similar to the physiologic reproducibility limits previously measured on test–retest baseline PET images for such parameters (22,25). The heterogeneity parameters showing the lowest variability with respect to static versus parametric PET images were entropy (0.3% ± 2.1%; UL/LL, +3.8/−4.4%; Fig. 2D) and zone percentage (+1.0% ± 3.7%; UL/LL, +8.2%/−6.1%; Fig. 2E). Homogeneity led to slightly larger differences (+0.6% ± 11.9%; UL/LL, +24.0%/−22.7%), whereas dissimilarity behaved similarly to area under the curve of the cumulative intensity histogram, with SD being 16%–17% and UL/LL being about ±30%–35% (Fig. 2F). Finally, the parameter that exhibited the largest difference was high-intensity emphasis, with an SD of +0.3% ± 20.9% (UL/LL, +41.3%/−40.6%; Table 3).
DISCUSSION
There is currently increasing interest in intratumor heterogeneity characterization by PET and its potential added value for diagnosis, evaluation of therapy response, and survival analysis. It has already been shown that, for NSCLC, the use of whole-body static 18F-FDG PET to characterize intratumor heterogeneity has not only a complementary prognostic value relative to metabolic functional volume (20,27) but also a predictive value in the case of exclusive chemotherapy (28). On the other hand, there are several unanswered questions about the robustness of these heterogeneity parameters and their underlying biologic significance. Some of these parameters, including those used in this study, have been shown to be robust to physiologic reproducibility (25,29). In terms of their biologic significance, we have previously shown that tumor blood flow correlates strongly with various tumor heterogeneity scales extracted from 18F-FDG PET images in colorectal cancer (30). To further evaluate the robustness of intratumor heterogeneity characterization in 18F-FDG PET for NSCLC, the goal of this study was to compare, for the first time to our knowledge, intratumor heterogeneity parameters between standard static acquisitions and quantitative parametric 18F-FDG PET images. The underlying goal of this comparison was to provide some insight into the potential information that parametric images may add to that obtained from standard clinical PET acquisitions.
First, the use of a robust delineation approach allowed us to overcome the potential robustness issues previously observed (21) in the determination of MATVs measured from static versus parametric PET images (−2% ± 7% and limits of 11%–15%). The observed variations, at ±30%, were well within the upper and lower physiologic reproducibility limits previously determined for the fuzzy locally adaptive Bayesian approach (22) and substantially lower than those previously reported using less robust delineation methods based on fixed thresholding (17). Fixed thresholding has been shown to lack robustness and to be sensitive to tumor contrast (31). The higher contrast in parametric images (32) may explain MATV differences that were not observed in the present study using a more robust delineation algorithm.
We also found that measurement of maximum intensity (SUVmax and maximum Ki) and total activity (TLG and MRV) correlated strongly between static and parametric images (r ≥ 0.9). This observation is in line with results previously reported for renal cell carcinoma metastases by Freedman et al. (14) and for breast cancer by Doot et al. (33). Both found a strong correlation (r > 0.95) between SUVmax and maximum Ki on baseline 18F-FDG PET scans.
Most of the uptake heterogeneity features considered in the present study correlated strongly (r ≥ 0.7, P ≤ 0.0006) when obtained using static or parametric PET images, with differences of less than ±25%, except for high-intensity emphasis (±40%) and dissimilarity (±30%). In particular, entropy and zone percentage values were quite similar (<±5% and <±9%, respectively), providing further evidence of the robustness of these parameters in characterizing intratumor heterogeneity (18,26). The strongest differences associated with high-intensity emphasis may be explained by its previously demonstrated lower robustness to PVE (mean difference of −20.6 ± 18.8 between PVE-corrected and non–PVE-corrected images) (18).
In comparisons of quantitative measurements of intratumor heterogeneity between static and parametric 18F-FDG images, our results suggest that the observed differences, rather than representing the actual spatial distribution of uptake, can be attributed mostly to variability in image characteristics and noise (Fig. 1). This possibility, in turn, supports the hypothesis that with respect to intratumor heterogeneity characterization the parametric images provide information similar to that of static SUV images on a 18F-FDG PET baseline scan.
On the basis of the Patlak analysis assumptions and use of the baseline scan only, the hypotheses of this work were that the unmetabolized component of 18F-FDG is negligible at later times and that the ratio of injected dose to patient weight is proportional to the area under the curve of the arterial input function. If one considers a comparison of a baseline scan and an early or late scan, such as in early–late therapy response monitoring, the conclusions may be different. Although such an analysis was beyond the objectives of this work, in such a comparative framework parametric images may eventually provide useful additional information. For example, it has previously been demonstrated—within the context of early prediction of the response of locally advanced breast cancer to therapy—that dynamic PET scans provide clinical added value to static SUV measurements, leading to significantly higher predictive accuracy (34). That study, however, was based on comparison of SUV measurements only and did not include more advanced tumor characterization metrics (volume, heterogeneity).
Our study was limited by the small number of patients and the exclusion of NSCLC patients with large lesions (>3 cm). Despite the few patients, the small mean differences in parameters suggest that similar information on tumor heterogeneity can be derived from the static and parametric baseline 18F-FDG PET images. Given these small differences, a more substantial patient cohort is needed to confirm the statistical significance of these results. We chose to limit lesion size in order to reduce the influence of both respiratory motion and PVE. Although previous studies have shown variability in heterogeneity features as a result of respiratory gating (35,36), other studies have shown no statistically significant differences in the PET heterogeneity parameters considered in the present study (37). In addition, most of the lesions in our study (85%) were in the upper lung lobes, which are less influenced by respiratory motion.
The choice of NSCLC as the cancer type in our study can also be a limitation because lung tissue is mostly metabolically nonactive and thus the background is low and the fraction of unmetabolized 18F-FDG is also low. Our present conclusions for NSCLC therefore cannot be extended to tumors in tissues with higher background levels (e.g., liver metastases) or near reservoirs of metabolically inactive 18F-FDG, such as in urine or even blood (especially in end-stage renal failure).
Although the strong correlation between features extracted from static and parametric PET images suggests that there is no significant complementary information to be derived from parametric 18F-FDG PET images, further validation studies are required to compare the actual predictive and prognostic value of static versus parametric images for patient response and overall survival in NSCLC.
CONCLUSION
In NSCLC, parametric and static SUV 18F-FDG PET images provided similar and strongly correlated findings for tumor-derived characterization parameters. More specifically, similar correlations and small differences were found for such metrics as entropy and zone percentage, which quantify heterogeneity in the spatial distribution of intratumor uptake. Despite the limited number of patients and the lack of correction for respiratory motion, our findings suggest that within the context of NSCLC patient management, dynamic 18F-FDG PET has no added value over a single baseline 18F-FDG PET image in the analysis of intratumor heterogeneity.
DISCLOSURE
The costs of publication of this article were defrayed in part by the payment of page charges. Therefore, and solely to indicate this fact, this article is hereby marked “advertisement” in accordance with 18 USC section 1734. This study was supported by a grant from the Ligue Contre le Cancer (Finistere and Côtes d’Armor Committees). No other potential conflict of interest relevant to this article was reported.
Footnotes
Published online Mar. 10, 2016.
- © 2016 by the Society of Nuclear Medicine and Molecular Imaging, Inc.
REFERENCES
- Received for publication September 21, 2015.
- Accepted for publication January 27, 2016.


Jump to section
Related Articles
Cited By...
- Variability and Repeatability of Quantitative Uptake Metrics in 18F-FDG PET/CT of Non-Small Cell Lung Cancer: Impact of Segmentation Method, Uptake Interval, and Reconstruction Protocol
- Metabolic heterogeneity on baseline 18FDG-PET/CT scan is a predictor of outcome in primary mediastinal B-cell lymphoma