


Abstract
There is increased interest in various new quantitative uptake metrics beyond SUV in oncologic PET/CT studies. The purpose of this study was to investigate the variability and test–retest ratio (TRT) of metabolically active tumor volume (MATV) measurements and several other new quantitative metrics in non–small cell lung cancer using 18F-FDG PET/CT with different segmentation methods, user interactions, uptake intervals, and reconstruction protocols. Methods: Ten patients with advanced non–small cell lung cancer received 2 series of 2 whole-body 18F-FDG PET/CT scans at 60 min after injection and at 90 min after injection. PET data were reconstructed with 4 different protocols. Eight segmentation methods were applied to delineate lesions with and without a tumor mask. MATV, SUVmax, SUVmean, total lesion glycolysis, and intralesional heterogeneity features were derived. Variability and repeatability were evaluated using a generalized-estimating-equation statistical model with Bonferroni adjustment for multiple comparisons. The statistical model, including interaction between uptake interval and reconstruction protocol, was applied individually to the data obtained from each segmentation method. Results: Without masking, none of the segmentation methods could delineate all lesions correctly. MATV was affected by both uptake interval and reconstruction settings for most segmentation methods. Similar observations were obtained for the uptake metrics SUVmax, SUVmean, total lesion glycolysis, homogeneity, entropy, and zone percentage. No effect of uptake interval was observed on TRT metrics, whereas the reconstruction protocol affected the TRT of SUVmax. Overall, segmentation methods showing poor quantitative performance in one condition showed better performance in other (combined) conditions. For some metrics, a clear statistical interaction was found between the segmentation method and both uptake interval and reconstruction protocol. Conclusion: All segmentation results need to be reviewed critically. MATV and other quantitative uptake metrics, as well as their TRT, depend on segmentation method, uptake interval, and reconstruction protocol. To obtain quantitative reliable metrics, with good TRT performance, the optimal segmentation method depends on local imaging procedure, the PET/CT system, or reconstruction protocol. Rigid harmonization of imaging procedure and PET/CT performance will be helpful in mitigating this variability.
- variability
- repeatability
- segmentation method
- non-small cell lung cancer
- positron emission tomography imaging
PET imaging with 18F-FDG is extensively used in oncology for diagnosis, staging, prognosis and response monitoring. Various quantitative metrics in PET imaging, such as metabolically active tumor volume (MATV), SUV, and intralesional uptake heterogeneity, have been developed as indicators to quantify glucose metabolism in malignant tumors (1,2). However, the variability in segmentation techniques, user interaction during the segmentation, and imaging acquisition protocols presents particular challenges for consistently and accurately obtaining quantitative metrics.
Over the last 20 years, several segmentation methods have been developed and investigated in different tumor types, presenting large variability in terms of delineation accuracy and user interaction (3,4). As reported by the American Association of Physicists in Medicine (AAPM), validation for most published segmentation methods is either insufficient or inconsistent (5). Besides, although repeatability of quantitative metrics in PET imaging has been extensively explored (6,7), several recent studies have presented conflicting results. Tixier et al. (8) reported poor repeatability of various textural features in esophageal cancer, with only a few features being sufficiently reliable. However, van Velden et al. (9) found that most metrics had similar or better repeatability than SUV in non–small cell lung cancer (NSCLC). It is unclear whether these apparently conflicting results are caused by differences in tumor types, segmentation methodologies, applied imaging protocols, or a combination of these factors. The systematic comparison of the performances of a range of oncologic image–derived PET metrics obtained using different segmentation methods and imaging protocols is highly desirable.
Therefore, to understand the potential interactions among these aspects, we studied the variability of a representative set of frequently used quantitative metrics for NSCLC PET imaging as a function of segmentation method, user interaction, uptake interval, and reconstruction protocol, along with the repeatability of these metrics.
MATERIALS AND METHODS
Patients
We reanalyzed PET/CT scans from a prospective single-center study on 10 patients with advanced NSCLC who underwent double 18F-FDG PET/CT scans at VU University Medical Center. Patient characteristics are listed in Table 1 and were previously described (9). All patients gave written informed consent before enrollment. This study was approved by the Medical Ethics Review Committee of the VU University Medical Center and was registered in the Dutch trial register (www.trialregister.nl, NTR3508).
Patient Characteristics
Data Acquisition and Reconstruction
Patients fasted for at least 6 h before administration of 18F-FDG. All scans were performed using an Ingenuity TF PET/CT scanner (Philips Healthcare). Two whole-body (i.e., skull vertex to mid-thigh) PET/CT scans were performed, one at 60 min after injection and another at 90 min. For each PET scan, a low-dose CT scan (120 kVp, 50 mAs) was also obtained. The same procedure was repeated within 3 d after the first examinations. For 2 patients, the 90-min PET scans were not collected because the patients could not comply with the long duration of the scan.
All PET images were reconstructed using 4 different protocols with necessary corrections (e.g., attenuation, scatter, random, and normalization), which included a vendor-provided body reconstruction protocol (ING), an EANM Research Ltd (EARL)–compliant reconstruction (10), a postreconstruction resolution model with 1 iteration (PSF1), and the same protocol with 2 iterations (PSF2). The matrix size of all reconstructed images was 144 × 144 with an isotropic voxel size of 4 mm (supplemental data, available at http://jnm.snmjournals.org).
Delineation Methods
Lesions were identified by a nuclear physician. For each lesion, 8 automated segmentation methods were applied (Supplemental Table 1): a method for automated segmentation using an active contour model (MASAC) (11), an affinity propagation algorithm (AP) (12), a contourlet-based active contour algorithm (CAC) (13), the contrast-oriented thresholding method (ST) of Schaefer et al. (14), segmentation using 41% of the maximum tumor value as a threshold (41MAX) (15), segmentation using 50% of the peak tumor value as a threshold, adapted for local background (A50P) (15), segmentation using an SUV of 2.5 as a threshold (SUV25), and segmentation using an SUV of 4.0 as a threshold (SUV40).
Each segmentation method was applied with and without a manually defined tumor mask, restricting the region growing to remain within the mask.
Performance Evaluations
The index “out-of-mask” (OM) was included as a metric of segmentation failure: Eq. 1where Noutside is the number of cases for which the segmentation method without a mask generated a segmentation expanding beyond the predefined tumor mask, and Ntotal is the total number of PET tumor segmentations. Thus, the out-of-mask index reflects the ability of a segmentation method to automatically segment the tumor without spatial constraints (i.e., without a mask). The lower the number, the more successful the method was to generate a tumor segmentation without the inclusion of nonlesioned 18F-FDG–avid areas, or without mislocalization of the segmentation (e.g., jumping to a wrong location, such as a different tumor, kidney, bladder, myocardium, or liver).
Quantitative Uptake Metrics
The quantitative metrics evaluated in this study were MATV, SUVmax, SUVmean, total lesion glycolysis (TLG), and several textural intratumor heterogeneity features. These features included a global heterogeneity indicator (i.e., area under the curve of the cumulative intensity histogram, CIHAUC) (16), and some local heterogeneity features, such as homogeneity, entropy, dissimilarity, high-intensity emphasis (HIE), and zone percentage (ZP). These features were selected because of their reproducibility and robustness (8,16,17). MATV, SUVmax, SUVmean, TLG, and CIHAUC were calculated with in-house software, whereas local heterogeneity features were obtained with the Pyradiomics package (18). All features were extracted from the original images, without the application of any postprocessing (e.g., rebinning or filtering). Detailed information about the implementation of these metrics are presented as Supplemental Equations 1–5.
Repeatability Evaluations
Repeatability of the metrics between the 2 scans was calculated as the test–retest ratio (TRTmetric): Eq. 2where Metricscan1 and Metricscan2 are the metric values obtained from the first and second scans, respectively.
Statistical Analysis
Statistical analysis was performed using SPSS Statistics 24.0 software (IBM). The generalized-estimating-equation model was used to account for repeated measurements and missing data. The independent working correlation matrix was selected for analysis, with an identity link function. The natural log transformation was applied to MATV, SUVmax, SUVmean, TLG, and HIE to obtain normally distributed data.
To assess the influence of uptake interval and reconstruction protocol, the specific metric was selected as the dependent outcome in the generalized-estimating-equation model; the patient, scan, uptake interval, and reconstruction protocol were included as independent variables, along with the interaction effect between uptake interval and reconstruction. Similar settings were also used for the TRTmetric, excluding the “scan” variable. A post hoc pairwise comparison was performed when the test of model effect was shown to be significant, applying Bonferroni adjustment for multiple comparisons present in the test. P values of less than 0.05 were considered to be significant.
To explore the relationship between MATV and the other metrics, MATV was set as the dependent outcome, with each other metric included independently as the main effect in the generalized-estimating-equation model, and corrected for other factors such as patient, scan, uptake interval, reconstruction protocol, interaction of the uptake interval with the metric, interaction of the reconstruction protocol and the metric, and interaction of uptake interval, reconstruction protocol, and the metric. Similarly, the correlation between the TRTMATV and TRT of the other metrics was also investigated. Moreover, scatterplots were also used to explore the relationships of TRTMATV with MATV and SUVmax.
RESULTS
Tumor Mask
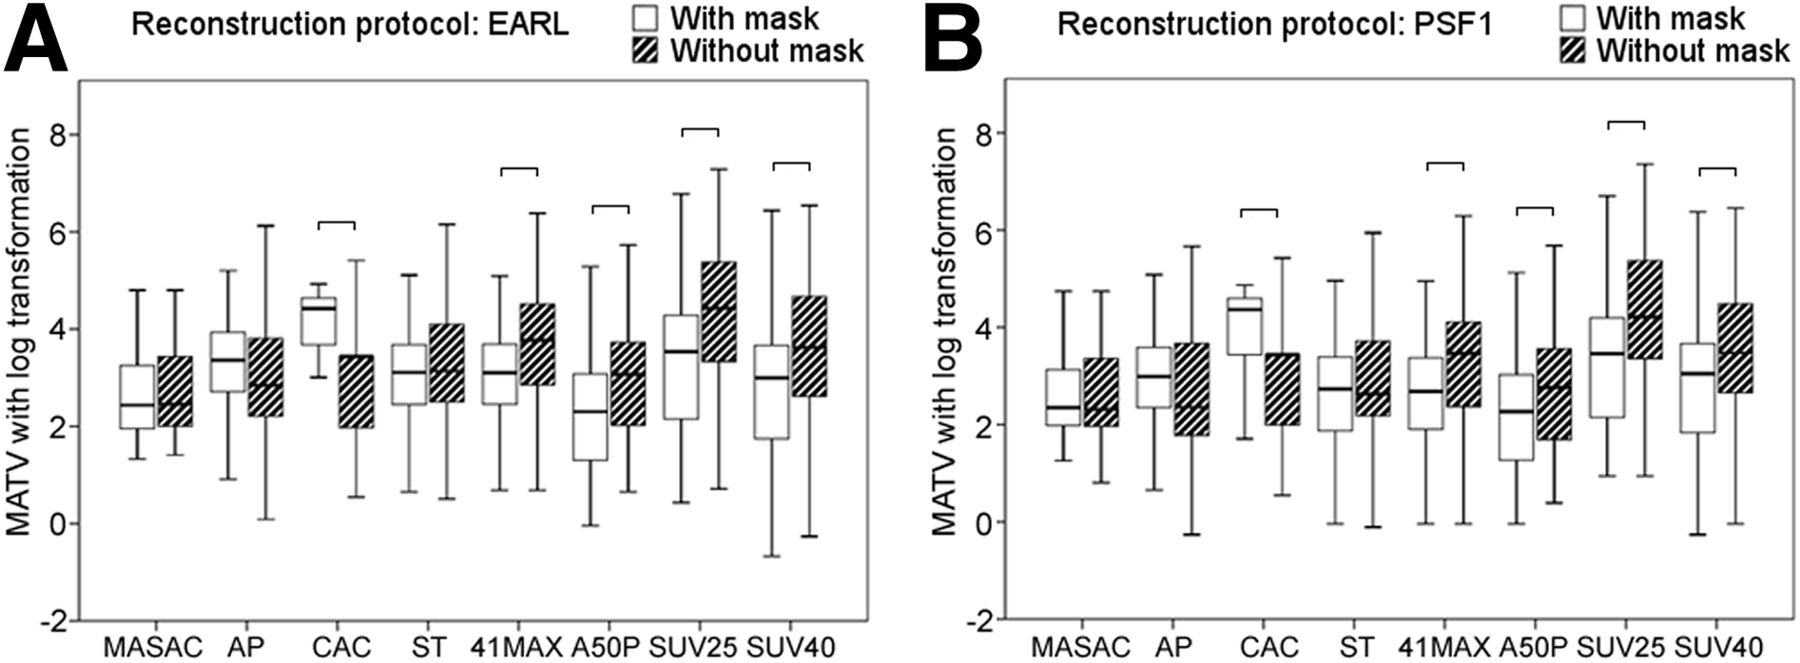
For 41MAX, A50P, SUV25, and SUV40, the use of a mask resulted in a significantly smaller (12%–22%) MATV, whereas CAC showed a significantly larger (35%) MATV with masking (Fig. 1). However, applying a tumor mask did not improve the MATV’s repeatability in most segmentation results (Fig. 2). Similar results were also found with the other reconstruction protocols.

Box-and-whisker plots of MATV at 60 min for each segmentation method. For display purposes, outliers identified as 1.5 × interquartile range were removed from plot (whiskers). Statistically significant differences are marked with horizontal line.

Box-and-whisker plots of TRTMATV at 60 min for each segmentation method. For display purposes, outliers identified as 1.5 × interquartile range were removed from plot (whiskers). No statistically significant differences were found.
As shown in Table 2, A50P displayed fewer incorrect segmentation results (30%) than the other segmentation methods. In general, CAC and SUV25 showed the worst out-of-mask index results (CAC, 77% at 60 min; SUV25, 86% at 90 min). Because no segmentation method correctly delineated all lesions without a mask, we used the results derived from the segmentation with a tumor mask for further analysis.
Comparison of Out-of-Mask Index for Each Segmentation Method with Different Uptake Intervals and Reconstruction Protocols
Uptake Interval and Reconstruction Protocol
Overall, MATV at a 90-min uptake interval was larger than at 60 min for CAC, A50P, SUV25, and SUV40 but smaller for MASAC, AP, ST, and 41MAX (Fig. 3), specially affecting those protocols with lower spatial resolution (EARL and ING). These observed differences were statistically significant for all methods, with the exception of MASAC, CAC, and A50P (Table 3; Supplemental Table 2). For example, direct comparison (i.e., without log transformation) of MATV in EARL reconstructed data showed a median increase of 7% (interquartile range, 1%–13%) for A50P, SUV25, and SUV40 delineations versus a median decrease of −4% (interquartile range, −8% to 2%) for MASAC, AP, CAC, ST, and 41MAX. In addition, except for SUV40, most segmentation methods showed a slightly smaller MATV with reconstruction protocols that provided higher spatial resolutions (in ascending order: EARL, ING, PSF1, and PSF2) at both uptake intervals.

Box-and-whisker plots for various metrics as function of uptake interval (A) and reconstruction protocol (B). For display purposes, outliers identified as 1.5 × interquartile range were removed from plot (whiskers). Comparisons without statistically significant differences are marked with horizontal line.
Generalized-Estimating-Equation Model: Significance Results (P Values) for All Metrics Tested
With each segmentation method, SUVmax, SUVmean, TLG, entropy, and ZP increased significantly (P < 0.001) from 1% to 6% at the 90-min uptake interval as compared with the 60-min interval. In CAC, homogeneity was independent of uptake interval, whereas all other segmentation methods showed significantly lower homogeneity (2%, P < 0.001) at 90 min than at 60 min (Table 3; Supplemental Table 2).
SUVmax, SUVmean, TLG, homogeneity, entropy, and ZP were significantly affected by the reconstruction protocol regardless of the segmentation method. For most segmentation methods, SUVmax, SUVmean, entropy, and ZP increased from 1% to 6% at reconstruction protocols with higher spatial resolution, whereas CIHAUC and homogeneity decreased slightly (1%) in these cases (Supplemental Table 3). Compared with other metrics, dissimilarity and HIE were hardly affected by either uptake interval or reconstruction protocol.
There were significant interaction effects for homogeneity; that is, it correlated not only with uptake interval and reconstruction protocol but also with their combinations. For most segmentation methods, the PSF2 reconstruction protocol at 90 min of uptake showed the lowest homogeneity, whereas the EARL protocol showed the highest homogeneity at 60 min, except for ST and 41MAX.
Repeatability: Effect of Uptake Interval and Reconstruction Protocol
Uptake interval had no effect on TRT for any metric or segmentation method, whereas the used reconstruction protocol affected TRT in SUVmax for each segmentation method (Fig. 4; Table 4). In general, the TRT in SUVmax was worse with higher-spatial-resolution reconstruction protocols. There were no evident interactions between uptake interval and reconstruction protocol for any of the metrics or segmentation methods.

Box-and-whisker plots for TRT of various metrics as function of uptake interval (A) and reconstruction protocol (B). For display purposes, outliers identified as 1.5 × interquartile range were removed from plot (whiskers). Statistically significant differences are marked with horizontal line.
Generalized-Estimating-Equation Model: Significance Results (P Values) for All TRT Metrics Tested
Relationship Between MATV and Other Metrics as Well as Their Repeatability
There was a significant relationship between MATV and other metrics (Supplemental Table 7). Similarly, TRTMATV strongly correlated with TRT for SUVmean, TLG, CIHAUC, and ZP (Supplemental Table 8). These relationships were also affected by the different uptake intervals and the reconstruction protocols.
Relationship Between TRTMATV and MATV or SUVmax
For most segmentation methods, the repeatability of MATV was better at larger MATVs and higher SUVs (Figs. 5 and 6, respectively). A similar trend for the relationship between TRTMATV and MATV or SUVmax was also observed at other uptake intervals and for other reconstructions.

TRTMATV as function of MATV with EARL reconstruction protocol at 60 min for each segmentation method.
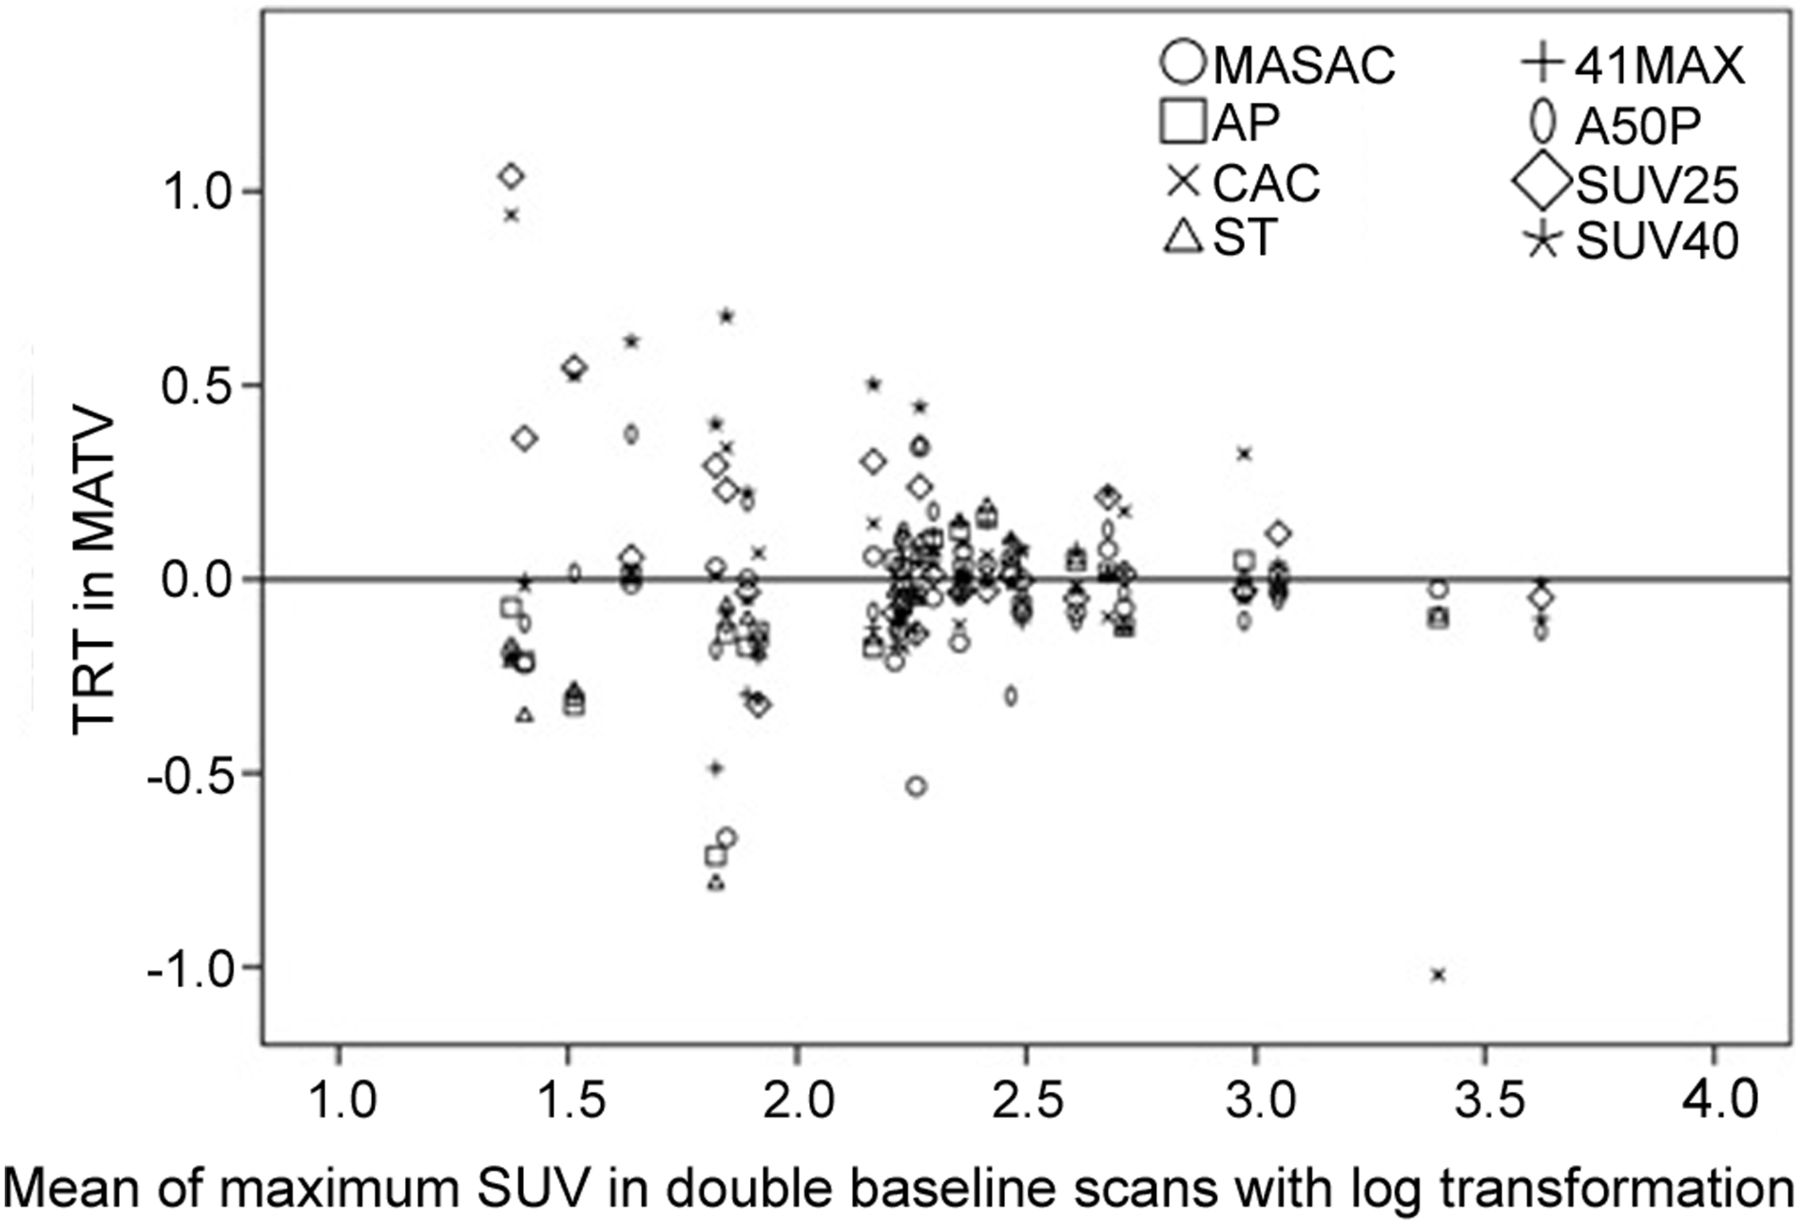
TRTMATV as function of SUVmax with EARL reconstruction protocol at 60 min for each segmentation method.
DISCUSSION
Our study showed that segmentation methods are influenced by different user interactions, uptake intervals, and reconstruction protocols, suggesting that all segmentation results need to be reviewed critically. User interaction during the segmentation process is often required in medical imaging (19,20). In our study, no segmentation method could delineate all lesions correctly without a tumor mask, indicating the necessity of manually defining a tumor mask, especially for tumors adjacent to high-activity areas.
In our study, MASAC, CAC, and A50P were statistically independent of the uptake interval (i.e., 60 vs. 90 min) in MATV, whereas SUV25 and SUV40 showed larger MATVs at 90 min than at 60 min after 18F-FDG administration (6% and 10%, respectively). Because lesional uptake was higher at 90 than 60 min, these 2 segmentation methods, taking the absolute SUVs as threshold values, tended to generate larger MATVs at 90 min, as occurred in our experiments. However, 41MAX, using relative thresholds, show a slight decrease in MATV at an increased uptake interval. Moreover, MATV obtained with most segmentation methods depends on the reconstruction protocol, and thus, these methods require careful consideration when used in different clinical scenarios.
It has been reported that intralesional heterogeneity correlates with treatment outcome (21). However, regardless of the uncertainties in segmentation methods, differences in acquisition protocols also result in changes in image quality, thus influencing the results for these extracted features (22,23). We found that intralesional heterogeneity increases with uptake interval or spatial image resolution (in ascending order: EARL, ING, PSF1, and PSF2), presented as the decrease in CIHAUC and homogeneity and the increase in entropy and ZP, although dissimilarity and HIE showed less association with uptake interval or reconstruction. The lower the CIHAUC or homogeneity, the higher the heterogeneity of the image, whereas the higher the entropy or ZP, the more details an image carries and the more heterogeneous are the tumor features in the image. Similar results were also found by Lasnon et al. (1), who showed that PSF images resulted in higher heterogeneity than EARL-compliant images.
We found that the repeatability of most metrics was independent of the tracer uptake interval and reconstruction protocol, for each segmentation method evaluated. Moreover, MATV and other metrics were highly correlated, as well as their TRTs. This finding may seem to be inconsistent with the results of Hatt et al. (24), but we believe it can be explained by the use of different segmentation procedures and acquisition protocols. Moreover, to identify predictors of repeatability in MATV, the correlations of TRTMATV with MATV and SUVmax were also investigated. We found that, in general, the repeatability of MATV was better with high values of MATV or SUVmax, suggesting that small lesions are more likely to be affected by variation in imaging procedures, consistent with our previous study (25).
As proposed by AAPM report 211, accuracy evaluation of segmentation methods is required for each PET scanning condition (5). Our study confirms and further supports this recommendation. We observed that MATV, as well as most of the other metrics, depends not only on the segmentation method but more specifically on its specific combination with uptake interval and reconstruction protocol. In other words, methods and procedures that may work well under one condition may be outperformed by other methods under different conditions. Therefore, it seems that the selection of the best segmentation method is highly dependent on the imaging procedures and conditions at hand, confirming the AAPM recommendation to evaluate performance for each scanning condition. Despite the publication of strict imaging guidelines (10,26), there remains considerable variability in imaging procedures. To some extent, these are mitigated by scanner accreditation programs (27), but residual variability will likely remain and require implementation of the AAPM report 211 recommendations.
The absence of ground truth in our study does not allow the accuracy of measured values to be assessed. In addition, although numerous data were included in our study to explore their interactions, these data were derived from 18F-FDG PET images from only 10 NSCLC patients, which may not be sufficient to fully demonstrate their relationships in other clinical scenarios. Therefore, further studies are needed to establish a benchmark to evaluate their accuracy under different conditions.
CONCLUSION
Quantitative results derived from 18F-FDG PET/CT studies on NSCLC patients show that all segmentation results need to be critically reviewed and that MATV, and other quantitative metrics, depend on segmentation method, uptake interval, and reconstruction protocol. Methods that perform well under one condition may not be suitable under different circumstances or studies. These interactions also suggest that to obtain reliable quantitative metrics with a good TRT performance, the optimal segmentation method depends on the local imaging procedures, PET/CT systems, or reconstruction protocols used. Rigid harmonization of imaging procedures and PET/CT performance will be helpful in mitigating this variability (28–30).
DISCLOSURE
This work was supported by an Open Grant (2014GDDSIPL-06) from the Key Laboratory of Digital Signal and Image Processing of Guangdong Province, Shantou University. No other potential conflict of interest relevant to this article was reported.
Acknowledgments
We thank Prof. Habib Zaidi, Prof. Qingchun Qiu, and Zemian Chen for their assistance during the research.
Footnotes
Published online Nov. 2, 2018.
- © 2019 by the Society of Nuclear Medicine and Molecular Imaging.
REFERENCES
- Received for publication June 11, 2018.
- Accepted for publication September 24, 2018.


