


Abstract
The aim of this prospective study was to evaluate the value of 18F-FDG PET for the assessment of chemotherapy response in patients with non–small cell lung cancer. Furthermore, part of the objective of this study was to compare 2 methods to quantify changes in glucose metabolism. Methods: In 51 patients, dynamic 18F-FDG PET was performed before and at 5–8 wk into treatment. Simplified methods to measure glucose metabolism (standardized uptake value [SUV]) and quantitative measures (metabolic rate of glucose [MRGlu]), derived from Patlak analysis, were evaluated. The overall survival and progression-free survival with respect to MRGlu and SUV were calculated using Kaplan–Meier estimates. Fractional changes in tumor glucose use were stratified by the median value and also the predefined EORTC (European Organization for Research and Treatment of Cancer) metabolic response criteria, and criteria applying cutoff levels similar to those of RECIST (Response Evaluation Criteria in Solid Tumors) were evaluated. Results: When stratifying at the median value of ΔMRGlu and ΔSUV, the difference in overall survival (P = 0.017 for ΔMRGlu, P = 0.018 for ΔSUV) and progression-free survival (P = 0.002 for ΔMRGlu, P = 0.0009 for ΔSUV) was highly significant. When applying the predefined criteria for metabolic response, the cutoff levels as also used for size measurement (RECIST) showed significant differences for ΔSUV between response categories in progression-free survival (P = 0.0003) as well as overall survival (P = 0.027). Conclusion: The degree of chemotherapy-induced changes in tumor glucose metabolism as determined by 18F-FDG PET is highly predictive for patient outcome, stratifying patients into groups with widely differing overall survival and progression-free survival probabilities. The use of 18F-FDG PET for therapy monitoring seems clinically feasible, because simplified methods to measure tumor glucose use (SUV) are sufficiently reliable and can replace more complex, quantitative measures (MRGlu) in this patient population.
- chemotherapy response monitoring
- 18F-FDG PET
- non–small cell lung cancer
- standardized uptake value
- Patlak analysis
Molecular imaging with 18F-FDG PET has an established role in the standard of care in presurgical staging of patients with non–small cell lung cancer (NSCLC). The addition of 18F-FDG PET to the diagnostic work-up has been shown to significantly reduce the number of futile mediastinoscopies and thoracotomies (1–3). 18F-FDG PET has also demonstrated its potential in radiation treatment planning and detection of recurrent disease (4–7).
Nowadays, there is an increasing interest in the role of 18F-FDG PET beyond staging, such as the prediction of tumor response to therapy. Response assessment with morphologic imaging techniques has limitations in reliably distinguishing necrotic tumor or fibrotic scar from residual tumor tissue (8). Indeed, final treatment outcome will be determined more by the biologic aggressiveness of residual tumor than by its volume (9). Furthermore, some new therapies may be cytostatic instead of cytoreductive, in which case successful treatment may not lead to a decrease in tumor size and thus poses new demands on imaging modalities.
18F-FDG PET is ideally suited to overcome these kinds of problems. One of the advantages of 18F-FDG PET is that it not only can visualize but also can quantify 18F-FDG uptake to distinguish metabolically highly active from less-active tumor tissues. Furthermore, metabolic alterations of tumor cells, indicative of tumor response to therapy, may occur before alterations in tumor size. Early prediction of tumor response is of particular interest in patients with advanced stages of NSCLC. Tumor progression during first-line chemotherapy occurs in approximately 30% of patients (10). Because of relatively slow tumor shrinkage, as measured on morphologic imaging modalities, a significant percentage of patients will continue to undergo toxic therapy for weeks without benefit.
In the present prospective study, a design was used that allowed for comparative analysis of different quantitative PET methods to measure tumor glucose use at various levels of complexity. Furthermore, prospective as well as post hoc definitions for metabolic response were assessed to evaluate the value of 18F-FDG PET in therapy response monitoring of NSCLC.
MATERIALS AND METHODS
Patient Eligibility Criteria
Between March 2002 and December 2005, all patients in the Radboud University Nijmegen Medical Centre with any stage of NSCLC and measurable tumor lesions according to the Response Evaluation Criteria in Solid Tumors (RECIST)—who were scheduled to undergo induction chemotherapy or chemotherapy in a palliative setting—were offered the opportunity to participate in the study. Initial staging was performed according to the guidelines of the American Society of Clinical Oncology (11). Exclusion criteria were diabetes mellitus and pregnancy. In all patients, treatment decision making was done by a multidisciplinary team, including cardiothoracic surgeons, pulmonologists, medical oncologists, radiation oncologists, pathologists, radiologists, and nuclear medicine physicians. Clinicians had access to the pretreatment staging static whole-body PET scan but were unaware of the results of the dynamic 18F-FDG PET scans. The study was approved by the Institutional Review Board of the Radboud University Nijmegen Medical Centre, and written informed consent was obtained from each patient.
Quantitative Dynamic 18F-FDG PET Data Acquisition and Reconstruction
Dynamic 18F-FDG PET was performed at baseline and after the second or third cycle of chemotherapy, depending on the chemotherapy regimen. The median interval between the clinical-staging 18F-FDG PET and the baseline dynamic 18F-FDG PET was 3 d. Patients fasted for at least 6 h before imaging. Intake of noncaloric beverages was permitted. All scans were acquired on an ECAT-EXACT47 PET scanner (Siemens Medical Solutions). The field of view for dynamic acquisition was based on whole-body 18F-FDG PET and CT scans performed for initial staging, including as many measurable tumor lesions as possible. A 20-min transmission scan was made, using the internal 68Ge/68Ga sources, to correct for photon attenuation. Approximately 200 MBq 18F-FDG were injected intravenously over a 1-min period, using a constant-infusion remote-controlled pump (Medrad). The dynamic data acquisition, performed in septa-extended (2-dimensional) mode, was started simultaneously with the injection of 18F-FDG and consisted of 16 time frames with variable frame length (10 × 30 s, 3 × 300 s, 3 × 600 s) for a total time of 50 min. A more detailed description of the data acquisition, reconstruction, and analysis methods was published previously (12).
Plasma Time–Activity Curves
To measure the blood clearance of 18F-FDG, plasma time–activity curves were derived from arterial blood sampling when feasible. Arterial blood samples were taken manually at set times to provide an arterial plasma input function as described previously (12). When arterial cannulation was contraindicated or not feasible, an image-based input function was determined by measuring 18F-FDG counts in a volume of interest (VOI) over the ascending aorta, which accurately determines 18F-FDG blood levels (12).
Tumor Time–Activity Curves
Tumor time–activity curves were obtained by placing VOIs semiautomatically over the tumor and metastases using a threshold of 50% of the maximum pixel value within the lesion. Necrotic areas were excluded from the VOIs. A volume-weighted mean value of tumor glucose use (metabolic rate of glucose [MRglu]) of all lesions in each PET scan was derived to provide one value for each study. VOIs drawn on the first 18F-FDG PET (before initiation of chemotherapy) were copied to the second 18F-FDG PET (after 2 or 3 cycles of chemotherapy).
Patlak Graphical Analyses
For quantitative measurement of glucose metabolism, Patlak graphical analysis was used to calculate the MRGlu (expressed in μmol.mL−1. min−1) in tumor tissue (13,14). A detailed description of the Patlak graphical analyses and its assumptions have been published elsewhere (12,13). In brief, the Patlak approach takes into account differences in the whole-body distribution of 18F-FDG at the time of scanning, which may affect the accumulation of 18F-FDG in the tumor tissue. Furthermore, the MRGlu in tumor was calculated by multiplication of the slope of the Patlak plot and the basic blood glucose level (expressed in μmol.mL−1). Blood glucose level was measured (hexokinase method, Aeroset; Abbott Diagnostics) before 18F-FDG injection. The fractional change in MRGlu between 18F-FDG PET at baseline and after 2 or 3 cycles of chemotherapy was calculated.
Standardized Uptake Value (SUV)
18F-FDG PET scans were also evaluated semiquantitatively by SUV analysis. SUVs normalized to injected activity and patients' body weight were calculated from the mean activity concentration in the tumor VOIs between 40 and 50 min after injection, which is the last time frame of the dynamic scan. A volume-weighted mean value of each PET scan was derived from all lesions to give one average SUV (SUVavg; hereafter referred to as SUV) for each PET scan. The percentage change in SUV between the 18F-FDG PET at baseline and after 2 or 3 cycles of chemotherapy was calculated.
Clinical Follow-up
During and after treatment, patients were monitored with clinical examination at regular intervals, chest CT, radiography, and other imaging studies as clinically indicated. Tumor response was evaluated according to RECIST criteria without knowledge of the results of the PET studies. When recurrence was suspected or proven, patients were always restaged. The progression/relapse pattern and cause of death were determined in all cases. The date of local or distant progression was defined as the earliest date at which disease progression was confirmed, either clinically or by imaging or biopsy. Patients who were progression free at the closeout date (November 1, 2006) or who had died from any cause had their time to progression censored at that date. Survival was measured from the date of the baseline PET scan to the date of death. Patients who were still alive at the closeout date had their survival censored to that date.
Statistical Analysis
Survival and progression-free survival served as the standard of reference. Cox proportional hazards regression analysis was used to assess the predictive value of response evaluation with 18F-FDG PET, as expressed in the percentage change in MRGlu and SUV between the 18F-FDG PET at baseline and after 2 or 3 cycles of chemotherapy. The data have been adjusted for tumor stage at the time of the baseline PET scan. Statistical significance was assessed using the Wald χ2 test. The overall survival and progression-free survival with respect to MRGlu and SUV were calculated using Kaplan–Meier estimates. The percentage change in measurements between the first and second scan were stratified by the median value to avoid data-driven significance for the cutoff level. However, stratification at the median value is still a post hoc definition for metabolic response. To avoid this bias, also some predefined, prospective definitions of metabolic response were used. For that purpose the population was categorized according to the definitions for metabolic response of The European Organization for Research and Treatment of Cancer (EORTC), into a group with complete response (CR) or partial response (PR) (Δ < −25%), a group with stable disease (SD) (Δ −25% to +25%), and a group with progressive disease (PD) (Δ > +25%) (15). Furthermore, the population was categorized according to the cutoff values also used for size measurement (RECIST), for which Δ < −30% is CR or PR, Δ −30% to +20% is SD, and Δ > +20% is PD (16). Groups were compared using the Breslow test, which counts losses that occur early in the survival distribution more heavily than losses that occur late, because sample sizes are larger in early months relative to late months. Spearman ρ-correlations were used to determine the comparability between the different methods to measure glucose metabolism. Statistical tests were based on a 2-sided significance level, and the level of significance was set at 0.05.
RESULTS
Patient Characteristics
Sixty consecutive eligible NSCLC patients were included in this prospective study. After the first 18F-FDG PET, 9 patients were excluded for several reasons: technical issues (n = 1), refusal to undergo a second 18F-FDG PET scan (n = 2), death before the second 18F-FDG PET (n = 1), and early discontinuation of chemotherapy due to a significant decline in performance status (n = 5). Therefore, complete 18F-FDG PET datasets (median interval between baseline and follow-up 18F-FDG PET, 49 ± 17 d) were available in 51 patients (37 males, 14 females; mean age, 59 y; range, 38–76 y) for analysis of the predictive value. Patient characteristics are summarized in Table 1.
Patient Characteristics
Treatment
Fifteen patients were treated with induction chemotherapy and 36 patients were treated in a palliative setting. Of the latter 36 patients, 32 received first-line chemotherapy and 4 received second-line chemotherapy. The chemotherapy regimens used were carboplatin/gemcitabine (n = 27), gemcitabine/cisplatinum (n = 9), carboplatin/etoposide (n = 9), cisplatinum/vinorelbine (n = 2), cisplatin/etoposide (n = 1), triapine/gemcitabine (n = 1), carboplatin/docetaxel (n = 1), and docetaxel (n = 1). After induction chemotherapy (n = 15), 2 patients underwent surgery, 10 patients were treated with radical radiotherapy, and 3 patients were treated with radiotherapy with palliative intent because of progression during induction chemotherapy based on CT criteria.
Patient Follow-up
No patients were lost to follow-up. Median follow-up time was overall 13 mo (range, 2–48 mo), for surviving patients 20 mo (range, 9–45 mo), and for deceased patients 9 mo (2–48 mo). During this time period, 38 patients had died and tumor progression was diagnosed in 45 of the 51 patients. Median time to progression was 7 mo (range, 0–39 mo). Overall survival after baseline 18F-FDG PET at 1 y was 57%, at 2 y 36%, and at 3 y 22%. Progression-free survival after baseline 18F-FDG PET at 1 y was 26%, at 2 y 17%, and at 3 y 8%.
Quantitative Changes in 18F-FDG Uptake
Mean MRglu at baseline was 0.146 ± 0.079 μmol.mL−1.min−1 (range, 0.028–0.356) and during evaluation was 0.084 ± 0.072 μmol.mL−1.min−1 (range, 0.009–0.355). The median fractional change of MRglu as compared with baseline was −47% ± 55% (range, −93% to +226%). Mean SUV at baseline was 5.27 ± 2.51 (range, 1.37–16.66) and during evaluation was 3.72 ± 2.75 (range, 0.71–16.64). The median fractional change of SUV as compared with baseline was −35% ± 42% (range, −73% to +125%).
Figure 1 shows a typical example of a patient with stage IV NSCLC and tumor lesions who responded to chemotherapy. There is an 82% decrease in MRglu and a 65% decrease in SUV relative to baseline.
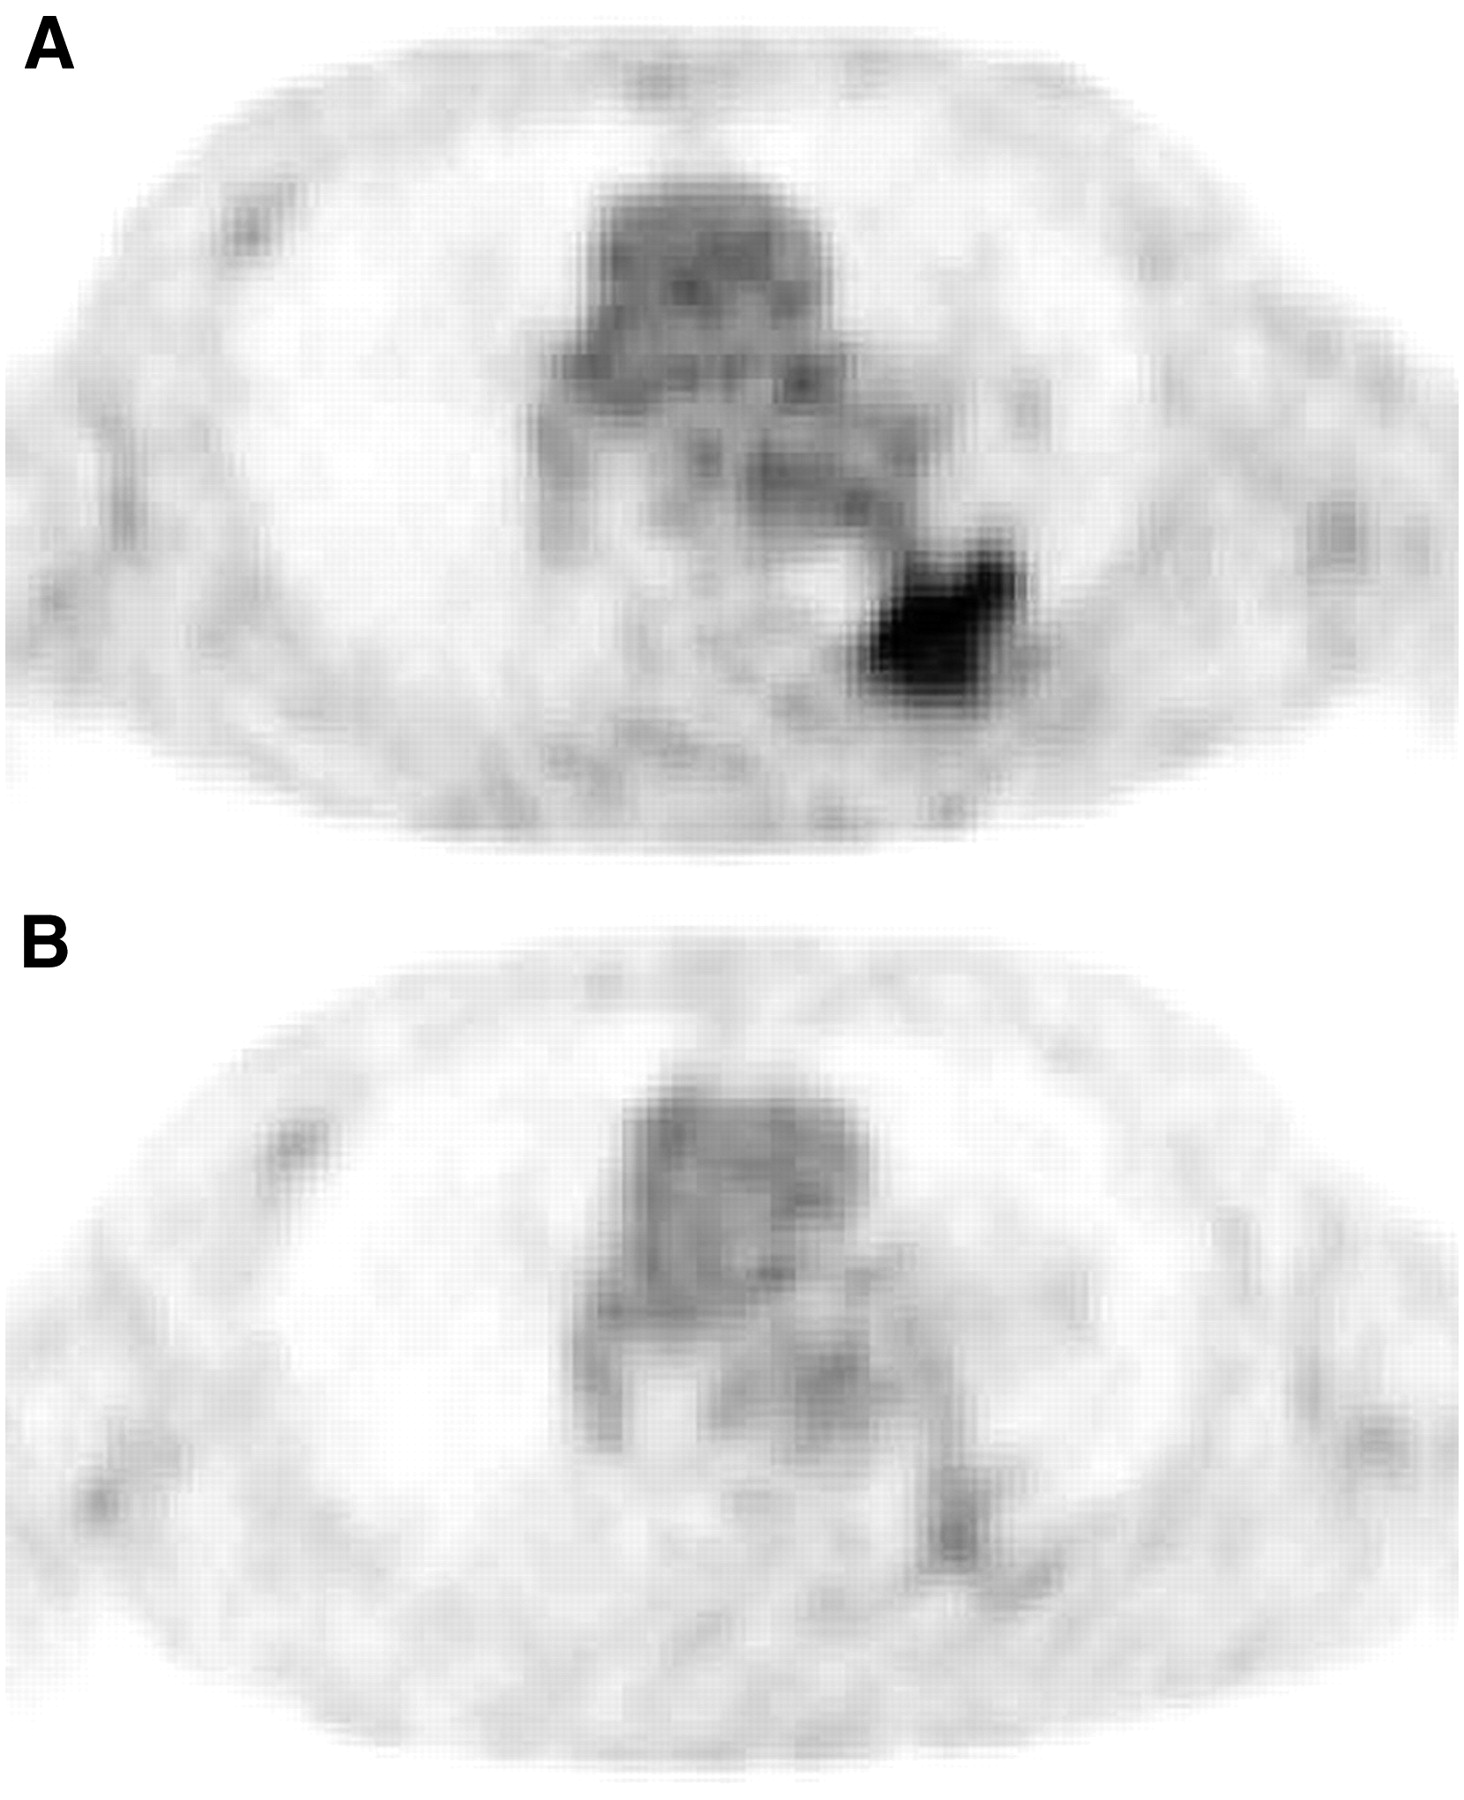
Typical example of patient with stage IV NSCLC and tumor lesions who responded to chemotherapy. Relative to baseline (A), there is an 82% decrease in MRglu and a 65% decrease in SUV on 18F-FDG PET after 2 cycles of carboplatin/gemcitabine (B).
18F-FDG uptake measured with simplified methods (SUV) showed a significant correlation with MRglu as measured with the Patlak analysis (r = 0.84, P < 0.0001) at baseline, after 2 or 3 cycles of chemotherapy (r = 0.93, P < 0.0001), as well as in terms of fractional changes after 2 or 3 cycles of chemotherapy (r = 0.94, P < 0.0001).
Prediction of Survival by 18F-FDG PET
To generate Kaplan–Meier survival curves, the decrease in tumor glucose metabolism was dichotomized at the median value, which was −47% and −35% for ΔMRGlu and ΔSUV, respectively. The Kaplan–Meier survival curves for overall survival are shown in Figure 2A (ΔMRGlu) and Figure 2B (ΔSUV). The difference in survival between both strata was highly significant for both ΔMRGlu and ΔSUV (P = 0.017 for ΔMRGlu and P = 0.018 for ΔSUV; Table 2 and Figs. 2A and 2B). For patients with a decrease in MRGlu lower than the median value, median overall survival was only 8 mo, whereas it was 17 mo for patients with a more pronounced decrease in MRGlu.
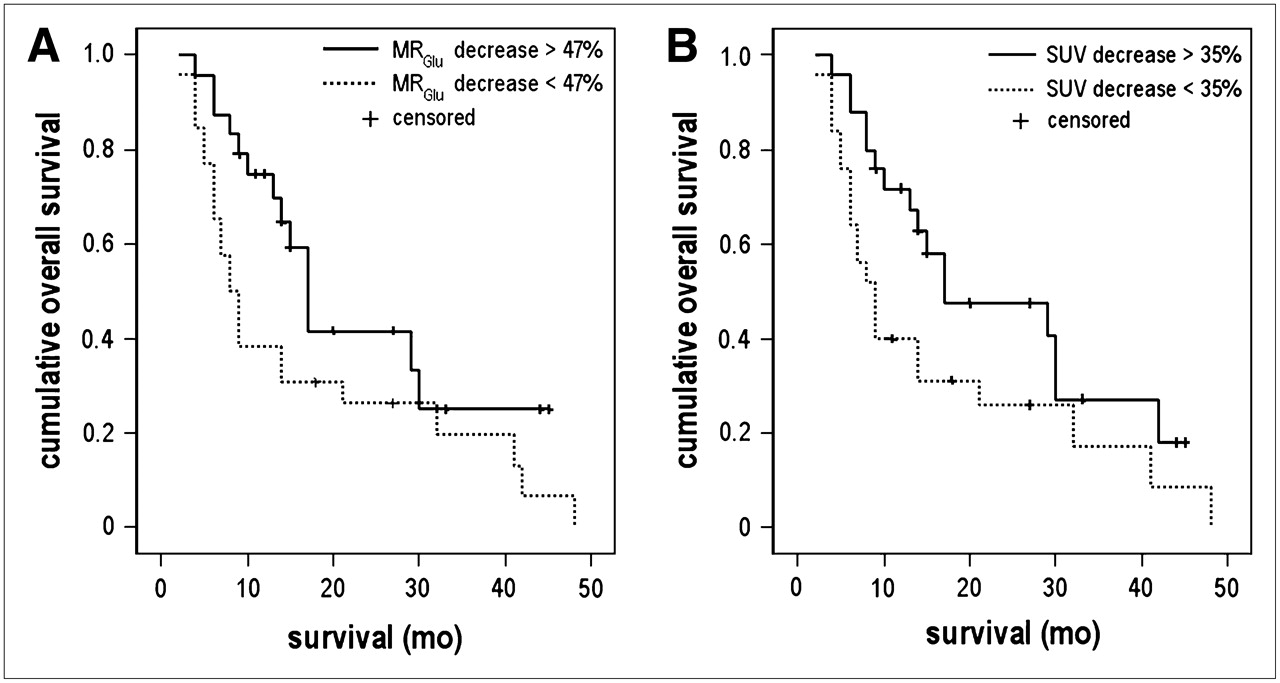
Kaplan–Meier estimates for overall survival: Kaplan–Meier analysis of relationship between overall survival and ΔMRGlu (dichotomized using median value of −47%) (A) and ΔSUV (dichotomized using median value of −35%) (B).
Survival Estimates
There was also a significant difference in progression-free survival between both groups when dichotomized at the median value of ΔMRGlu (P = 0.002) and of ΔSUV (P = 0.0009) (Table 2). Patients with a decrease of MRGlu by >47% were characterized by a significantly longer time to progression (median, 10 vs. 3 mo; P = 0.002). The results obtained for ΔSUV were also evident: median progression-free survival, 11 versus 3 mo. The corresponding Kaplan–Meier curves for progression-free survival are shown in Figure 3A (ΔMRGlu) and Figure 3B (ΔSUV). There was a highly significant increase in the rates of progression associated with worsening response as assessed by PET on Cox proportional regression analysis adjusting for disease stage at the time of commencement of treatment (P = 0.018 for ΔMRGlu and P = 0.028 for ΔSUV).
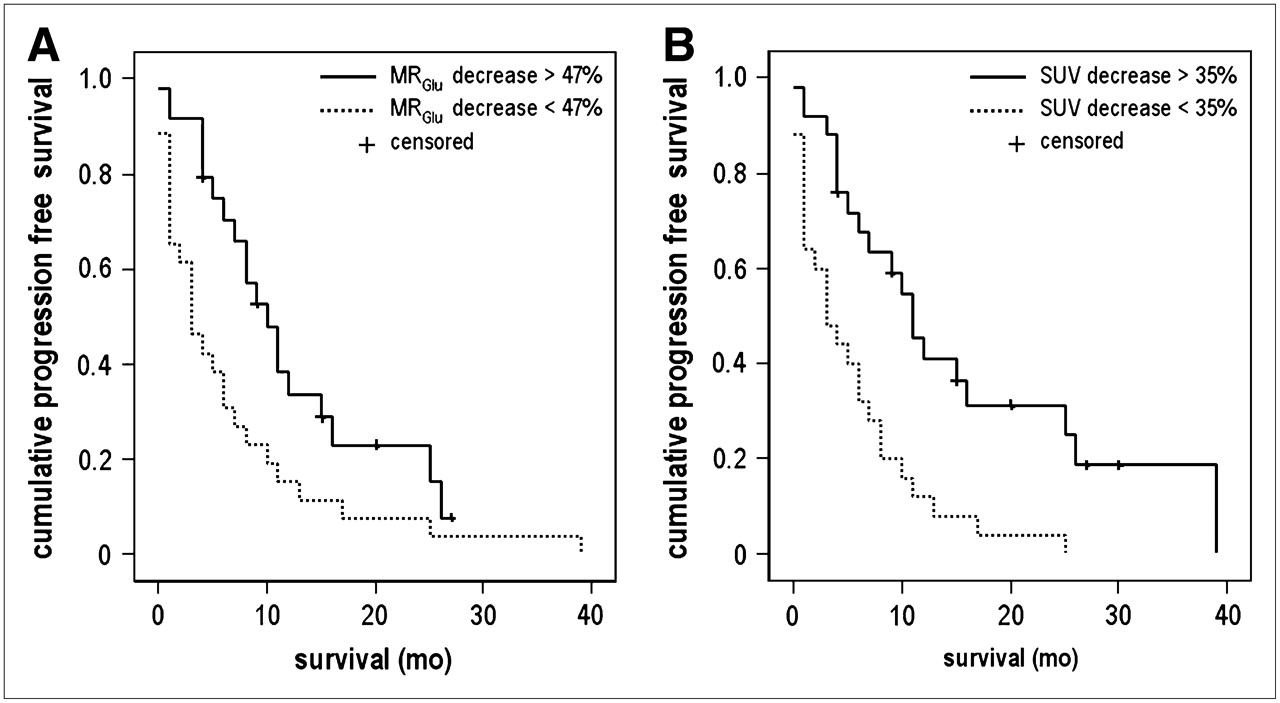
Kaplan–Meier estimates for progression-free survival: Kaplan–Meier analysis of relationship between progression-free survival and ΔMRGlu (dichotomized using median value of −47%) (A) and ΔSUV (dichotomized using median value of −35%) (B).
Applying predefined, prospective definitions of metabolic response with cutoff levels according to Young et al. (15) (EORTC) and according to the cutoff levels also used for size measurement (RECIST), the complete dataset showed similar highly significant differences in progression-free survival (Table 3). However, for prediction of overall survival, categorization according to these predefined cutoff levels showed only statistically significant differences for RECIST cutoff levels applied to ΔSUV (P = 0.027).
Progression-Free Survival Estimates for Predefined Metabolic Response Categories
DISCUSSION
The results of this prospective study show that fractional changes in tumor glucose metabolism from baseline 18F-FDG PET to 18F-FDG PET after 2 or 3 cycles of chemotherapy were highly predictive for outcome in patients with NSCLC. When applying the generally used post hoc definition for metabolic response, by stratifying at the median value of ΔMRGlu and ΔSUV, the difference in overall survival between both strata was highly significant (P = 0.017 for ΔMRGlu and P = 0.018 for ΔSUV). Also, a difference in progression-free survival was seen (P = 0.002 for ΔMRGlu and P = 0.0009 for ΔSUV).
The strength of the present study is that also some predefined, prospective definitions of metabolic response were evaluated, comparing 3 strata for assessment of metabolic changes by 18F-FDG PET. One of these prospective definitions was proposed by the EORTC (15) to provide a framework for comparison between studies and to facilitate assessment of the technique. A >25% decrease in glucose metabolism was estimated to be a sign of partial metabolic response after 2 or more cycles of chemotherapy. According to this EORTC definition, the present study demonstrated highly significant differences in progression-free survival between each stratum (P = 0.007 for ΔMRGlu and P = 0.0003 for ΔSUV). The same significant results were found when using the cutoff levels that are proposed for evaluation after 1 cycle of chemotherapy, for which a metabolic response is defined by a decrease in tumor glucose metabolism of >15%. However, for prediction of overall survival using these EORTC criteria, no statistical significance was reached; only a trend was found (P = 0.0504). This is probably due to the limited number of patients in each stratum: more censored patients for overall survival compared with progression-free survival in combination with smaller groups due to categorization into 3 groups (CR or PR, SD, and PD) instead of 2. The EORTC PET response criteria were developed by consensus between a range of PET experts and currently represent the most authoritative SUV-based recommendations. Also, when applying the same cutoff levels that are used for size measurement in standard clinical response assessment with conventional methods according to RECIST (16,17), significant differences between the strata were found in progression-free survival as well as overall survival with respect to ΔSUV.
These results imply that measurement of treatment-induced changes in tumor glucose metabolism with PET is quite robust. There is even more considerable evidence for this, as simplified 18F-FDG PET measures (SUV) and the more complex, quantitative measures, derived from Patlak graphical analysis (MRGlu), show comparable highly significant results indicative for treatment outcome. Given the high correlation between ΔSUV and ΔMRGlu (r = 0.94, P < 0.0001), there is no obvious need to apply the more complex dynamic imaging protocols (necessary for MRGlu calculation) for prediction of therapy response in monitoring chemotherapy of NSCLC. This indicates that 18F-FDG PET can be readily implemented as a routine clinical tool for response monitoring when some basic requirements of quality assurance are met (18). Multiple follow-up scans encourage a simplified approach to improve patient compliance, an important feature of successful clinical trials. Another advantage of the SUV is that it can be calculated from static whole-body 18F-FDG PET studies. In quantitative dynamic scans, only one axial field of view of typically 15–20 cm can be studied during the dynamic data acquisition. As metastatic lesions in different parts of the body may respond differently to chemotherapy, this represents a principal advantage of SUV.
The results of the present study are in line with other studies on the predictive value of 18F-FDG PET in locally advanced NSCLC. Several studies indicated a possible role for PET in assessment of response during or after radiotherapy (19), induction chemotherapy (20–22), or a combination thereof (8,23–27). The earliest study, performed in 1996 by Ichiya et al. (19), showed a more prominent decrease in 18F-FDG uptake in patients with a radiotherapy response on CT compared with those with no change in tumor size on CT. In the pilot study of Vansteenkiste et al. (20), a reduction in 18F-FDG uptake of >50% in the primary tumor or mediastinal clearance after induction chemotherapy proved to be a better predictor of long-term survival compared with the World Health Organization criteria (28,29) used as the standard for response assessment on CT. Another study that evaluated response monitoring of induction chemotherapy (21) showed that 18F-FDG PET identified prognostically different strata in patients considered responsive according to CT. In this prospective multicenter study, 18F-FDG PET was performed before and after 1 and 3 cycles of induction chemotherapy. The residual metabolic rate of glucose after 1 cycle selected patients with different outcomes. The residual metabolic rate of glucose after completion of induction chemotherapy proved to be the best prognostic factor. The other 6 studies (8,23–27) showed that 18F-FDG PET was also predictive with respect to therapy outcome of combined modality therapy. Metabolic response proved to be associated with pathologic response (23,24,26,27). A study performed by Mac Manus et al. (25) showed a significantly longer median survival for patients with complete metabolic response than for patients with incomplete metabolic response (31 vs. 11 mo).
The experience with 18F-FDG PET on therapy response monitoring in advanced stages of NSCLC is limited. So far, a single well-designed study on response assessment in advanced stages (stage IIIB or IV), using serial PET scans, was performed by Weber et al. (30). Fifty-seven patients scheduled to undergo platinum-based chemotherapy were studied before and after the first cycle of therapy. A decrease in SUV of 20% or more after 1 cycle of chemotherapy was associated with a longer time to progression (163 vs. 54 d) and longer median overall survival time (252 vs.151 d). The 1-y survival rate was also significantly higher in metabolic responders compared with nonresponders (44% vs. 10%). This study showed that a reduction of metabolic activity already after 1 cycle of chemotherapy is closely correlated with final outcome of therapy.
CONCLUSION
These findings in advanced stages of NSCLC in combination with the results of the studies in locally advanced NSCLC indicate that PET may be used to predict the clinical outcome of chemotherapy. The SUV proved to be a robust parameter to detect a metabolic response. As no sophisticated methods for data analysis are required, the use of 18F-FDG PET for therapy monitoring seems clinically feasible.
Footnotes
-
COPYRIGHT © 2007 by the Society of Nuclear Medicine, Inc.
References
- Received for publication May 7, 2007.
- Accepted for publication June 27, 2007.


Jump to section
Related Articles
Cited By...
- Total-Body Parametric Imaging Using Relative Patlak Plot
- Usefulness of 18F-{alpha}-Methyltyrosine PET for Therapeutic Monitoring of Patients with Advanced Lung Cancer
- 18F-FDG PET/CT of Non-Small Cell Lung Carcinoma Under Neoadjuvant Chemotherapy: Background-Based Adaptive-Volume Metrics Outperform TLG and MTV in Predicting Histopathologic Response
- Comparison of a Free-Breathing CT and an Expiratory Breath-Hold CT with Regard to Spatial Alignment of Amplitude-Based Respiratory-Gated PET and CT Images
- Outcome Analysis of 18F-Fluorodeoxyglucose Positron-Emission Tomography in Patients with Lung Cancer After Partial Volume Correction
- 18F-FDG PET Early Response Evaluation of Locally Advanced Non-Small Cell Lung Cancer Treated with Concomitant Chemoradiotherapy
- Imaging the inflammatory activity of sarcoidosis
- Are Pretreatment 18F-FDG PET Tumor Textural Features in Non-Small Cell Lung Cancer Associated with Response and Survival After Chemoradiotherapy?
- Response Assessment Using 18F-FDG PET Early in the Course of Radiotherapy Correlates with Survival in Advanced-Stage Non-Small Cell Lung Cancer
- Large Decreases in Standardized Uptake Values After Definitive Radiation Are Associated with Better Survival of Patients with Locally Advanced Non-Small Cell Lung Cancer
- Surrogate markers predicting overall survival for lung cancer: ELCWP recommendations
- FDG-PET as a Potential Tool for Selecting Patients with Advanced Non-Small Cell Lung Cancer Who May Be Spared Maintenance Therapy after First-Line Chemotherapy
- Volume-of-Interest Assessment of Oncologic Response Using 18F-FDG PET/CT: A Phantom Study
- 68Ga-DOTATATE PET/CT for the Early Prediction of Response to Somatostatin Receptor-Mediated Radionuclide Therapy in Patients with Well-Differentiated Neuroendocrine Tumors
- Chemotherapy Response Monitoring of Colorectal Liver Metastases by Dynamic Gd-DTPA-Enhanced MRI Perfusion Parameters and 18F-FDG PET Metabolic Rate
- Assessing Tumor Response to Therapy
- Role of 18F-FDG PET in Assessment of Response in Non-Small Cell Lung Cancer
- Imaging Surrogates of Tumor Response to Therapy: Anatomic and Functional Biomarkers
- Computed Tomography Response, But Not Positron Emission Tomography Scan Response, Predicts Survival After Neoadjuvant Chemotherapy for Resectable Non-Small-Cell Lung Cancer
- Tumor Cell Metabolism Imaging
- Comparison of Tumor Volumes Derived from Glucose Metabolic Rate Maps and SUV Maps in Dynamic 18F-FDG PET