


Abstract
This article addresses the current status of quantitative imaging as a surrogate biomarker for the assessment of tumor response to therapy with non–small cell lung cancer as an example. In addition, the article discusses the limitations of conventional response criteria in the new era of molecular-targeted agents for cancer treatment; the increasing need for more accurate and early response-assessment methods, particularly for volumetric CT; new tumor-specific radiotracers and molecular imaging technologies; and the future applications of molecular imaging with PET for studying various features of cancer metabolism, endocrine status, hypoxia, and oncofetal and differentiation antigens.
With the growing knowledge of the human genome and genetic alterations found in cancers, the search for new anticancer therapies has shifted away from traditional cytotoxic agents to mechanism-driven drugs. As a result, tumor response to therapy may not be observed at the same magnitude or speed on radiographic images (e.g., CT) as it used to be. Increasingly, conventional anatomy-based imaging methods for the evaluation of patient response to therapy have been found unsatisfactory (1–4). A clear need exists to develop and qualify more sensitive and specific quantitative imaging techniques as surrogate biomarkers for ever-growing numbers of clinical trials and routine clinical practice.
Understanding of drug mechanism, disease heterogeneity, tumor-specific tracers, and imaging techniques to visualize and quantify tumor changes at different levels (anatomic, metabolic, molecular, histologic, and other levels) is the key for the development of better quantitative imaging biomarkers for the assessment of therapy response. For more than a decade, noninvasive in vivo functional and molecular imaging methods have been intensively studied in both research laboratories and clinical settings throughout the world. Among the promising methods are PET with 18F-FDG and dynamic contrast-enhanced MRI (DCE-MRI)—the ability to characterize and measure cancer biologic or physiologic processes at the molecular level—which have shown great potential as early surrogate biomarkers that can be used to evaluate drug efficacy, stratify patients for specific therapies, and predict clinical outcomes (e.g., histopathologic response and survival) (5).
This review first addresses limitations of the conventional response-assessment methods in the new era of anticancer drug discovery. The article then discusses the urgent need for development and validation of promising, more accurate methods of assessing response early, including volumetric CT and functional imaging biomarkers, focusing mainly on recent advances in the 18F-FDG PET assessment of treatment response in non–small cell lung cancer (NSCLC). Future applications of molecular imaging with PET are also reviewed.
LIMITATION AND POTENTIAL IMPROVEMENT OF CONVENTIONAL RESPONSE-ASSESSMENT METHODS
For many years, the standard way to assess a patient's response to treatment has been to measure tumor size on longitudinal CT or MRI scans, using bidimensional (World Health Organization [WHO]) or unidimensional (response evaluation criteria for solid tumor [RECIST]) criteria (6–8). In the WHO criteria, the 2 greatest perpendicular diameters of each target lesion are measured on a transverse image plane, and the sum of the products of the 2 diameters of all target lesions is used to assess tumor regression or progression (6,7). The RECIST method, the criteria most recommended for today's practice, is revised from the WHO method and uses only the greatest diameter of each lesion (8). When the rules governing response assessment were established almost 30 y ago, imaging of tumor volume and precise volumetric measurement of tumors were not possible. The methods used in response assessment have changed little, despite the advances in imaging technologies, emergence of targeted therapies, and evidence of the inadequacy of conventional methods to capture the effects of novel therapies.
The current anatomy-based response-assessment techniques have the inherent limitations, because they use unidimensional or bidimensional measurements to quantify changes in tumor volume, use arbitrarily determined cutoff values to categorize tumor response and progression, do not provide information about changes in tumor density, and cannot distinguish viable tumor from dead tumor components.
Unidimensional and bidimensional tumor measurements are adequate surrogates for tumor volume only when tumors are spheric and change size with therapy in a spheric fashion. However, such assumptions are often not true, particularly for cancers that tend to have irregular shapes, such as lung cancer. Obviously, the current measurement techniques cannot capture tumor changes along the z-axis, as the measurements are performed on a transverse image plane according to the criteria.
The cutoff values used to categorize tumor response in WHO criteria were determined crudely in the late 1970s or early 1980s, in large part by using either physical examination or plain radiographic measurements of tumors (9,10). Despite the remarkable advances made in imaging techniques and measurement tools, the similar studies have never been repeated. The wide ranges spanned by the current cutoff values, for example, partial response as a decrease of at least 30% and disease progression as an increase of at least 20% in RECIST (8), may delay detection of disease progression and regression, particularly when testing newer anticancer drugs. On the other hand, the cutoff intervals could not be set too narrowly because of measurement errors or variations.
Because of the inefficacy of the conventional methods for the assessment of response to therapy, researchers have been intensively investigating more promising methods, including quantitative functional imaging approaches. Meanwhile, tumor-volume measurement, which estimates tumor (size) changes more accurately than does the uni- or bidimensional measurement, and tumor density measurement, which may provide another dimension to indicate tumor changes caused by therapy, have also attracted much attention. Such additional information can be readily and accurately obtained from state-of-the-art volumetric CT scans without extra imaging procedures. It is likely that CT will still remain the most common modality of choice for monitoring tumor response to therapy, at least for the foreseeable future. This is because CT is relatively inexpensive; is widely available, with standardized imaging techniques and acquisition protocols in global use (many trials are internationally); is able to be quantified; and provides accurate and reliable anatomic information about not only tumor shrinkage or growth but also progression of disease by the identification of either growth in existing lesions or the development of new lesions.
An early report from a pilot study conducted at Memorial Sloan-Kettering Cancer Center (MSKCC) revealed that a semiautomated segmentation of lung cancer at baseline and 3 wk after gefitinib treatment detected a greater number of patients having an absolute change of at least 20% and 30% in tumor volume (11/15 and 7/15) than did the unidimensional (1/15 and 0/15) and bidimensional (4/15 and 2/15) techniques (Fig. 1) (11). One of the objectives of this ongoing study was to investigate correlation of radiographic responses with particular gene mutations in the tyrosine kinase domain of the epidermal growth factor receptor (EGFR) in NSCLC patients. However, what cutoff values should be used for each of the measurements to indicate tumor biologically relevant changes? This study was not able to answer the question because a measured change always consists of the true tumor change and measurement variations or errors.

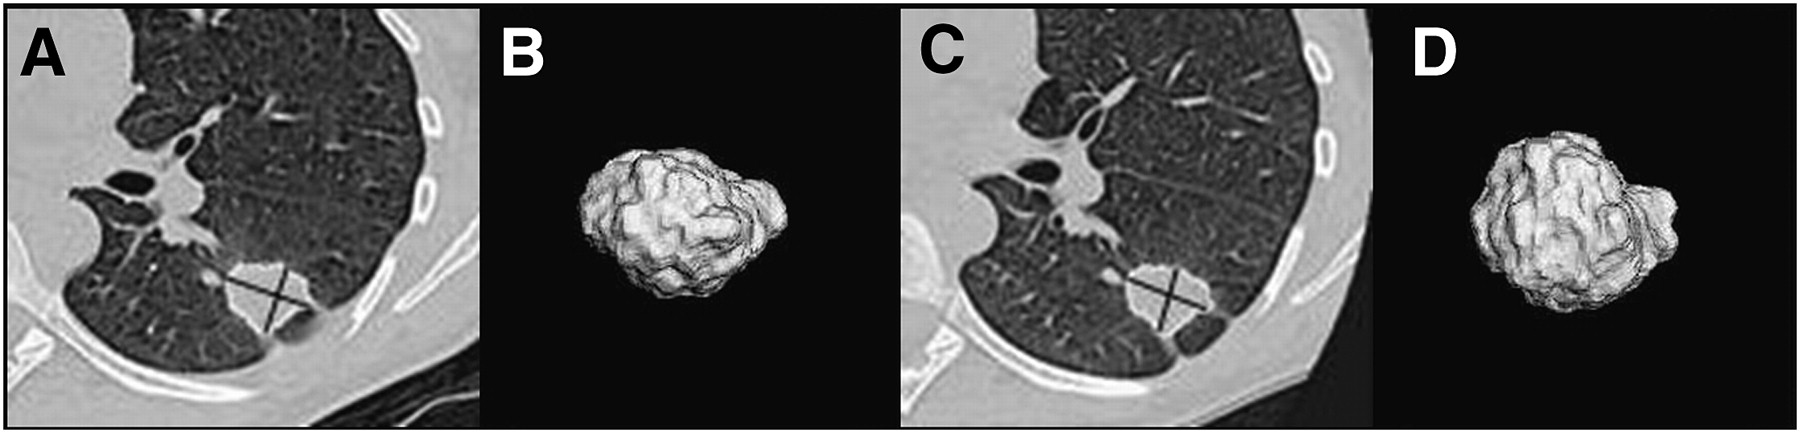
Images showing no changes in unidimensional or bidimensional measurements but enlargement of tumor along z-axis. (A) Baseline transverse CT image shows tumor contour (outlined in white), greatest diameter, and greatest perpendicular diameter (crossed lines in black) determined by semiautomated segmentation algorithm. (B) Three-dimensional view of segmented tumor on baseline. (C and D) On corresponding follow-up CT images obtained 24 d later, 3-dimensional tumor is seen from same angle along z-axis. Changes in unidimensional, bidimensional, and volumetric measurements are 0.4%, −4.4%, and 33.2%, respectively. (Reprinted with permission of (16).)
To address the issue of the measurement variability, a same-day repeated CT study in NSCLC patients was conducted by the same research group at MSKCC. Over a short time (within 15 min), no change in the tumor between scans was observed. Therefore, differences in size measured on the same tumor from the repeated CT scans should represent measurement error only. The group used thin-section CT images and found that the reproducibility of computer-assisted unidimensional, bidimensional, and volumetric measurements was high; 95% limits of agreements for the 3 measurements on 2 repeated scans were −7.3% and 6.2%, −17.6% and 19.8%, and −12.1% and 13.4%, respectively (12). These results could be essential to establishing the cutoff values for categorizing tumor response and progression, though the findings need to be well validated.
Although data are lacking to support the hypothesis that tumor density changes may precede size changes with therapy, ghosted and cystic changes have been observed clinically before the tumor shrinkage (Fig. 2). Furthermore, tumor response to newer cytostatic agents may result only in cystic, central necrosis, or density changes, rather than size change (2,3).
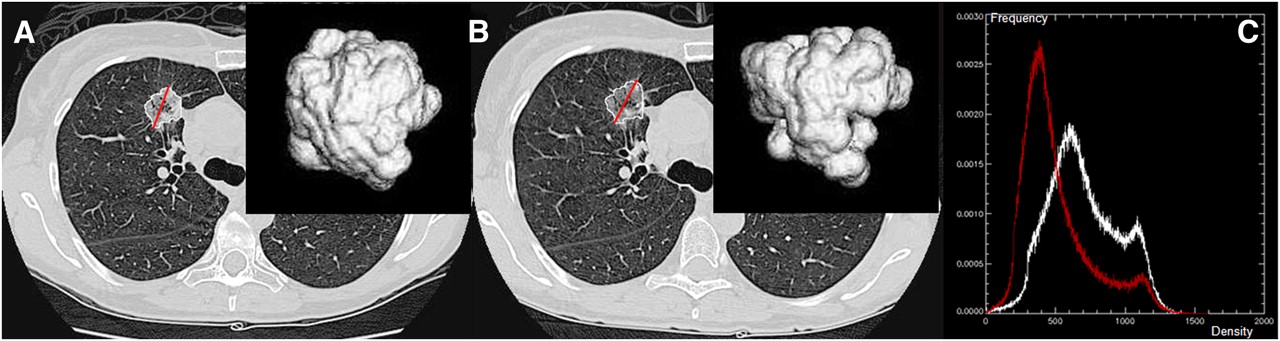
Images showing no change in tumor size but decrease in tumor density (ghost scenario). (A) Baseline transverse CT image with computer-generated tumor contour, greatest diameter, and 3-dimensional view. (B) On corresponding follow-up CT image obtained 21 d later, tumor is seen from same angle along z-axis. (C) Density histograms of tumor on baseline (white) and follow-up scans (red). Changes in unidimensional and volumetric measurements were 2.1% and −7.8%, respectively. Change in tumor average intensity was −189 Hounsfield unit.
In monitoring gastrointestinal stomal tumors treated with imatinib mesylate, significant underestimation of tumor response using the RECIST criteria was reported by several research groups. On the basis of typical patterns of change observed in the gastrointestinal stomal tumors on contrast-enhanced CT, that is, decrease in tumor size at a lower magnitude and increases in tumor homogeneity and hypoattenuation with the treatment, a group from M.D. Anderson Cancer Center suggested modifying the RECIST criteria by defining a 10% decrease in unidimensional measurement or 15% decrease in density (as measured by Hounsfield units) as a partial response (2,3). They reported that the modified criteria correlated with the 18F-FDG PET response in more than 90% of cases and were statistically superior to RECIST at predicting clinical outcome (survival) (3). However, this single-center finding has not yet been validated in a multicenter clinical trial, and the reproducibility of either the change in the cutoff value for the unidimensional measurement or the use of a decrease in Hounsfield unit was not tested.
NEED FOR BETTER RESPONSE ASSESSMENT FOR NSCLC
Lung cancer has become the most common cause of cancer-related deaths in the United States among both men and women, now accounting for 15% of new cancer cases and 29% of all cancer deaths (∼161,840 deaths are expected to occur in 2008) (13). The high mortality rate of patients with lung cancer is because most patients present with metastatic disease at diagnosis, for which there are life-prolonging but no curative therapies. Among the 80% of patients with lung cancer who have NSCLC, only about 20% have stage I or II tumors amenable to potentially curative surgical resection, whereas another 25% of patients have locally advanced disease that is treated with multimodality therapy with a small chance of long-term survival. During the past 3 decades, improvements in diagnosis, staging, surgery, radiotherapy, and chemotherapy have yielded small increases in survival for certain groups of patients, but the overall cure rate for lung cancer remains a dismal 14% (14).
For patients with NSCLC, the first-line chemotherapy treatment is often aggressive and toxic, as the NSCLC usually presents as advanced disease. Now that there are more treatment options available for patients with lung cancer, we need to be able to determine that a therapy is ineffective at the earliest possible time so that a second- or third-line treatment can be prescribed and the toxicity of ineffective therapies be minimized. When one is testing anticancer agents, particularly those with unique mechanisms of action, reliance on existing methods of tumor-response assessment measuring only 1 or even 2 diameters of the indicator lesions may slow or even prevent the development of effective drugs that do not cause tumor shrinkage as defined by the conventional criteria.
The recent discoveries that mutations in the tyrosine kinase domain of the EGFR gene predict for the sensitivity of responses in a subpopulation (i.e., adenocarcinoma histology, absence of smoking history, female sex, and East Asian ethnicity) of NSCLC patients to the EGFR kinase inhibitors gefitinib (Iressa; AstraZeneca) and erlotinib (Tarceva; Genentech) and that K-ras mutations are associated with resistance to these drugs are the first steps in a paradigm shift in the genotype-directed therapies for lung cancer (15). Analyses of retrospective clinical trials have shown controversial results in the predictive value of EGFR mutations in drug response and improved survival, and survival outcomes of prospective trials are not yet available. In the future, although surgery may remain the most effective treatment for patients with early-stage tumors, changing the overall outcome for lung cancer will require treatment options to be selected on the basis of the individual tumor biology, and novel therapies will be developed to target key molecular abnormalities.
Radiographic changes in tumors treated with targeted therapies do not necessarily occur at the same magnitude or speed as those observed in tumors treated with standard cytotoxic therapies. Furthermore, necrosis or fibrotic scars cannot be reliably distinguished from residual tumor tissue by anatomic CT. Previous studies found that responses assessed using anatomic criteria did not correlate well with those assessed pathologically at the cellular level or functionally based on tumor viability (16,17). Nevertheless, unidimensional and bidimensional measurements are still widely used as an object-response endpoint for the assessment of treatment response in both routine practice and clinical trials testing new anticancer drugs.
As more therapeutic agents and approaches become available, it will be increasingly important to reevaluate or modify existing anatomy-based response-assessment methodologies, verify the promising functional imaging methods in large prospective trials, and investigate new quantitative imaging technologies. Better response-assessment methods can help limit the amount of toxic drugs administered to a patient by demonstrating the patient's lack of response earlier and significantly affect the size, duration, cost, and success of cancer drug clinical trials, thus ultimately improving patient care.
FUNCTIONAL RESPONSE ASSESSMENT IN NSCLC
The hypothesis behind the early assessment of tumor response to therapy with functional imaging is that metabolic alterations precede morphologic changes. Uptake of 18F-FDG is associated with cell-proliferation activities (18,19). Accumulation of 18F-FDG occurs mainly in viable tumor cells rather than in fibrotic or necrotic tissues (20). Because glucose metabolism is higher in tumor cells than in healthy cells, 18F-FDG PET is used to visualize and measure metabolic activity in tumors. Since a decrease of 18F-FDG uptake indicates a decline in tumor activity or the death of viable tumor cells, 18F-FDG PET has the potential to be used as a sensitive imaging technique to predict tumor response to anticancer therapies.
Several methods have been developed to assess 18F-FDG uptake in tumors on PET, including visual interpretation, semiquantitative measurements (e.g., standardized uptake value [SUV]), and more advanced analytic kinetic techniques (e.g., rate of glucose metabolism) (21). Both qualitative and quantitative information derived from 18F-FDG PET can be useful in the assessment of therapy response (22). The SUV is defined as the attenuation-corrected 18F-FDG accumulation in a lesion normalized to the injected dose and the patient's body weight (body surface area or lean body mass). Although the SUV is a single snapshot of a dynamic process, it has been widely used in cancer diagnosis and, recently, in response assessment because of its simplicity and ability to indicate disease severity. One disadvantage of the SUV is its dependency on the imaging time. Studies reported a steady increase of SUV up to 90 min (23) and a 16% increase of SUV between 40 and 60 min after injection of 18F-FDG (24). In contrast to the SUV, the full kinetic quantitative analysis provides an absolute rate for 18F-FDG metabolism and is independent of imaging time. However, because it requires dynamic data acquisition and arterial blood sampling, full kinetic quantitative analysis is difficult to implement in clinical settings. Studies have found no evidence that more complex, quantitative dynamic imaging is superior to the semiquantitative SUV in NSCLC (25,26).
A widely accepted functional biomarker derived from the SUV is the maximal SUV (SUVmax) of a single tumor pixel. The use of an average SUV over a small area (3 × 3 pixels) or a small volume (3 × 3 × 3 voxels) around the SUVmax pixel has been proposed to reduce the effect of signal noise (27). Other parameters based on the SUV include the mean SUV for the tumor volume and the total lesion glycolysis, which is defined as the product of the mean SUV and the tumor volume (22). Accurate or consistent segmentation of the tumor volume on 18F-FDG PET, a prerequisite for the use of the latter 2 SUV-derived parameters, is hindered by the low spatial resolution of the PET images. A recent phantom study compared 3 published methods using different fixed thresholds and found that the segmented tumor volumes generated by the 3 methods differed from true values by more than a factor of 3 and differed from each other by up to 93% (28).
Functional imaging with 18F-FDG PET has been used primarily in the diagnosis, staging, and detection of tumor spread and recurrence, achieving high sensitivity and specificity for several cancer types. 18F-FDG PET has already become the standard of care in some aspects of cancer patient management, including presurgical staging in some kinds of cancers. Evolving oncologic studies have provided evidence in support of the use of 18F-FDG PET in treatment planning and therapy response assessment. For several tumor types, including NSCLC, preliminary studies demonstrated a positive role for the SUV (i.e., SUVmax) as an earlier and reliable in vivo biomarker to predict patient survival and to stratify patients who are the most likely to respond to a specific treatment (29).
After a thorough literature search, de Geus-Oei et al. reviewed 9 clinical studies published as of July 2006 that had shown positive results in the use of 18F-FDG PET to monitor response to chemotherapy (n = 2), radiotherapy (n = 1), or a combination of both (n = 6) in locally advanced NSCLC (29). These studies were designed and implemented differently in, for example, patient size, inclusion criteria, treatment regime, imaging procedure, and interpretation. The following was reported: A considerable reduction in SUV was associated with a pathologic response and proved to be a better predictor of long-term survival than anatomy-based criteria, a decrease in SUV of 20% or more after 1 cycle of chemotherapy was associated with a longer time to progression and a longer median overall survival time, a significantly longer median survival time was found in patients with complete metabolic response than in patients with incomplete metabolic response, and a larger decrease in SUV was observed in responding patients than in nonresponding patients classified by CT.
Three more recent publications on 18F-FDG PET response assessment in NSCLC studied the prognostic power of different SUVs (30), responses assessed by SUVmax and metabolic rate of glucose (MRGlu) (26), and earliest reliable time after chemotherapy to predict response (31).
The first study included 66 patients from 2 medical centers who had pathologic stage I–IIIA NSCLC. These patients underwent chemotherapy or radiotherapy (30). Three different SUVs on 18F-FDG PET were calculated for each primary tumor: SUVmax and SUV70% and SUV50% (defined as the mean SUV of all tumor pixels within the region of interest outlined by 70% and 50% isodensity, respectively). The hypothesis of the study was that, compared with the SUVmax, which is based on a single pixel value, the average SUV for tumor volume should better reflect the true metabolic nature of a tumor and thus should better predict the clinical outcome of a patient. However, the study found no significant difference in prognostic value among the 3 different SUVs.
In the second study, metabolic response was assessed using 2 different methods: the simple SUVmax and the more complex MRGlu (26). Fifty-one patients with any stage of NSCLC who were scheduled to undergo chemotherapy and had measurable tumors according to the RECIST criteria were included in the study. The percentage change in SUVmax and the fractional change in MRGlu between baseline and follow-up 18F-FDG PET scans after 2 or 3 cycles of chemotherapy were calculated. Study results showed that the degree of changes in tumor glucose metabolism determined by 18F-FDG PET was predictive of patient outcome. Furthermore, changes in SUVmax and MRGlu were highly correlated, indicating no need to use more complicated dynamic imaging techniques to assess chemotherapy response in NSCLC.
The third study was designed to determine the optimal timing of PET scans after initiation of chemotherapy to predict response (31). Metabolic changes of tumors in 15 NSCLC patients were followed weekly up to 7 wk after the initiation of chemotherapy. A metabolic response was found if the slope of the regression line (SUVmax vs. weeks) was negative and significantly different from zero. The study found that 18F-FDG PET performed 1 or 3 wk after the beginning of chemotherapy could predict the response to therapy.
The decrease of 18F-FDG uptake on PET is a complex biologic process, though it is linked to the decline of the number of viable tumor cells, reduction of the proliferative activity of tumors, and changes in glucose metabolic activity of viable tumor cells (18,20,32). Response assessment by 18F-FDG uptake can vary drastically because of a number of factors, some of which are unrelated to tumor changes. These factors include, but are not limited to, the chemosensitivity of the tumor to the drug, blood glucose level of the patient, change in body weight and tumor size during the therapy, fasting time before the scan, dose of 18F-FDG injected, time to the start of scanning after tracer injection, scanner, image reconstruction algorithm and data-analysis software, method used to measure 18F-FDG uptake, tumor region-of-interest selection on serial PET images, time interval between baseline and follow-up, and cutoff value to define response categories. How all these factors influence response assessment is not yet completely understood.
To facilitate the use of functional 18F-FDG PET for response assessment and allow comparison of the results of clinical trials, particularly those performed at multiple centers, uniform imaging techniques or protocols, a standard measurement method, and response-assessment criteria have been recommended (25,33). Such standardization is imperative, because many factors associated with this imaging technique can influence the 18F-FDG uptake measurements.
In 1999, after reviewing the current status of the technique, the European Organization for Research and Treatment of Cancer (EORTC) PET study group proposed the first recommendation for common measurement standards and criteria while reporting changes in 18F-FDG uptake to assess clinical and subclinical responses to anticancer treatments (25). On the basis of limited studies on 18F-FDG PET, the guidelines made recommendations on patient preparation, PET scan timing, attenuation correction, 18F-FDG dose, 18F-FDG uptake measurement methods, tumor sampling, measurement reproducibility, and metabolic response definition. In parallel to the anatomy-based criteria, the EORTC criteria also used 4 categories (i.e., progression of disease, stable disease, partial response, and complete response) to define the metabolic response and progression. The cutoff values of percentage change were determined on the basis of a measurement-reproducibility study on 18F-FDG PET (34) and some unpublished data (available within the EORTIC PET group).
With the increasing use of 18F-FDG PET in oncology practice over the past few years, more experience has been gained in this field. In 2005, the Cancer Imaging Program of the National Cancer Institute of the United States convened a workshop reviewing the latest progress in the use of 18F-FDG PET for both diagnosis and response assessment. Revised recommendations were published in 2006 as the outcome of the workshop (33). These guidelines are being or will be used to design and guide the ever-growing number of National Cancer Institute–sponsored clinical trials to qualify 18F-FDG PET as a biomarker or surrogate endpoint of clinical trials (35).
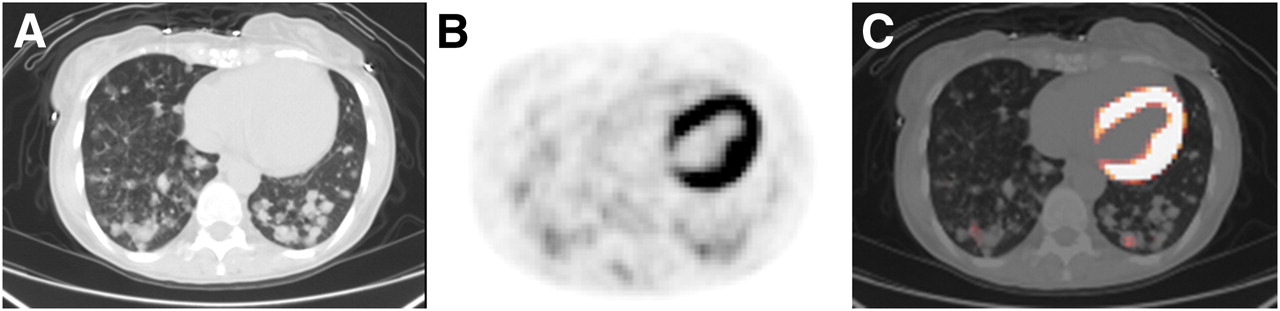
For some types of cancers, for example, bronchioalveolar lung carcinoma, neither CT nor 18F-FDG PET seems to be an appropriate imaging tool to assess therapy response using the current criteria. For bronchioalveolar lung carcinoma, target lesions are almost impossible to identify and follow up by CT (Fig. 3A), as the tumor masses spread through the entire lungs. Bronchioalveolar lung carcinomas have low 18F-FDG uptake values on PET and are often considered as negative (Figs. 3B and 3C) (36,37). New radiotracers, imaging techniques, and measurement parameters are under investigation. Because of its low spatial resolution, PET is incapable of depicting tumors about a centimeter or smaller in size. This inability to depict small tumors also limits the usefulness of PET in the detection of early diseases of small size and lymph node metastases at the stage when lymph nodes are not yet enlarged by tumor cells.

CT and 18F-FDG PET of bronchioalveolar cell carcinoma, with lesions on baseline CT (A), lesions on corresponding 18F-FDG PET (B), and CT fused with 18F-FDG PET (C). Only regions on PET containing pixels with SUVmax greater than or equal to 2 are visible on fused PET/CT image.
Studies aiming at the discovery of more effective radiotracers continue. The ultimate goals of these studies are to identify tumor-specific tracers to enhance the ability to differentiate tumor cells from healthy tissue and to better characterize changes in proliferative activities of viable tumor cells. Among the tracers being tested, the thymidine analog 3′-deoxy-3′-18fluorothymidine (18F-FLT) shows promising results (38–40) and is reported to better correlate with tumor cell proliferation than does 18F-FDG (37).
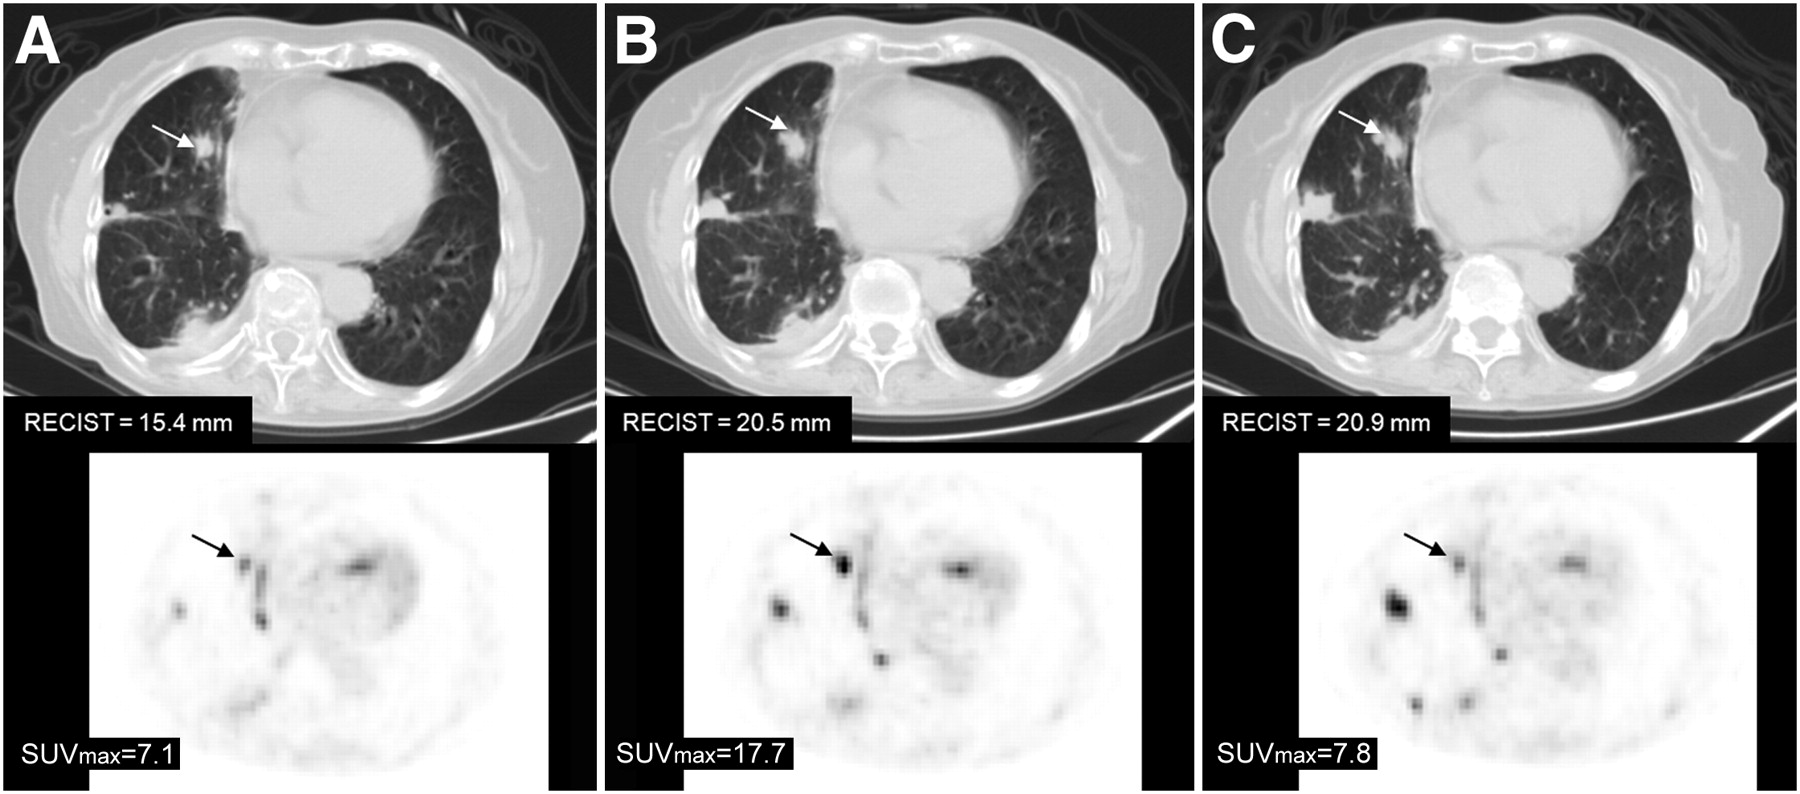
With the hybrid PET/CT scanners entering into clinical settings and clinical trials, fused or registered PET and CT images can provide morphologic and functional information simultaneously. The value of combining tumor changes in volume- and density-based features from CT images with those in metabolic volume- and activity-based features from PET images in the assessment of therapy response is of great investigative interest (41). Figure 4 shows an example from a study that examined the benefits of treatment with erlotinib or gefitinib monotherapy in metastatic NSCLC patients with previously documented responses to the treatment (42). In most patients, both CT and PET measurements demonstrated increases 3 wk after treatment had ceased and then decreased or stable disease after treatment had resumed.

18F-FDG PET/CT of NSCLC tumor. (A) Baseline hybrid PET/CT performed on patient who had discontinued treatment with gefitinib. One target lesion (arrow) in right lung is indicated on CT (upper row) and on corresponding PET (lower row). (B) PET/CT after 3 wk of no gefitinib treatment. Both size (i.e., maximal tumor diameter) measured on CT and SUVmax measured on 18F-FDG PET increased. Patient then resumed treatment with gefitinib at dose patient was receiving before study entry. (C) PET/CT 3 wk after resumption of treatment. Size did not change, but SUVmax dropped.
Another promising and actively studied functional imaging technique is DCE-MRI. Angiogenesis, the formation of new capillaries from existing blood vessels, is an important process that is necessary for the growth of malignant tumors and the development of metastasis. Angiogenesis can be inhibited by antiangiogenic agents, and existing blood vessels can be interrupted by vessel-disrupting compounds. By tracking the pass of an intravenous bolus injection of a low-molecular-weight paramagnetic contrast agent (e.g., gadolinium) through the tumor vasculature, an intensity change in the repeatedly acquired T1-weighted DCE MR image can be converted into contrast-agent concentration data on which kinetic modeling can be applied to produce modeled parameters that are sensitive to physiologic processes. These processes include tissue microvessel perfusion, permeability, and extracellular extravascular leakage space (43). Changes in the parameters can thus be used to evaluate antiangiogenic effects of cancer treatments. Because alterations in tumor vascularity occur earlier than do changes in tumor size during the treatments, DCE-MRI is being used increasingly as a surrogate biomarker in early clinical trials testing new antiangiogenics and vascular-disrupting compounds.
Because of the technical complexity, disease heterogeneity, and nonlinear relationships between the derived response parameters (e.g., Ktrans) and physiologic processes, DCE-MRI readouts can vary considerably among studies. Over the past several years, consensus recommendations for design and analysis of clinical trials that incorporate DCE-MRI investigations have been outlined and are being used for developing and validating DCE-MRI as a surrogate imaging biomarker in early clinical trials worldwide (44,45). These recommendations have addressed mainly the following issues: imaging protocol, type of measurement methods, primary and secondary endpoints, trial design, pharmacokinetic models, data analysis, measurement reproducibility, and future developments. DCE-MRI in response assessment is still in its infancy, and intensive investigations are under way.
FUTURE APPLICATIONS OF MOLECULAR IMAGING WITH PET
Metabolic imaging with PET is a potentially powerful tool for studying various features of cancer metabolism, endocrine status, hypoxia, oncofetal and differentiation antigens (46), and gene expression imaging (47) and pharmacology. Table 1 provides a list of metabolic probes that are commonly used at MSKCC. Several of these may be useful in the future as highly selective biomarkers. Because of the widespread availability and the favorable PET characteristics and half-life (110 min) of 18F, many of these tracers will initially be labeled with 18F. In the future, 124I (4-d half-life) and 64Cu (13-h half-life) may also be used. Furthermore, 68Ga (60-min half-life) can be conveniently produced from generators of 68Ge (270-d half-life).
Molecular Imaging Probes Used at MSKCC
Metabolic Biomarkers
Tumors have a different biochemistry than do the tissues from which they arise. The best-studied aspect of this biochemical phenotype is the Warburg effect, or increased aerobic glycolysis, a feature of many cancers (60). This property has been extensively exploited with the application of 18F-FDG in clinical oncology for initial detection and staging, detection of recurrence, treatment selection, and monitoring of treatment response.
Metabolically, cancer cells that use the Warburg effect pay a heavy penalty because, as an energy source, adenosine triphosphate is much less efficiently produced by glycolysis than by the Krebs cycle. Even so, evidence is emerging that the Warburg effect provides a competitive advantage for rapidly proliferating cells, by providing ready sources of carbon for nucleoside production and by helping to alleviate the oxidative stress that is a feature of cancer cell metabolism (61,62). In any event, the higher the 18F-FDG uptake in tumors, the greater the biologic aggressiveness of the tumor and the poorer the clinical outcomes. For this reason, as mentioned previously, 18F-FDG is a good starting point for exploring the potential of PET as a functional biomarker of tumor response. At present, 18F-FDG is the only clinically approved biomarker that is readily reimbursed.
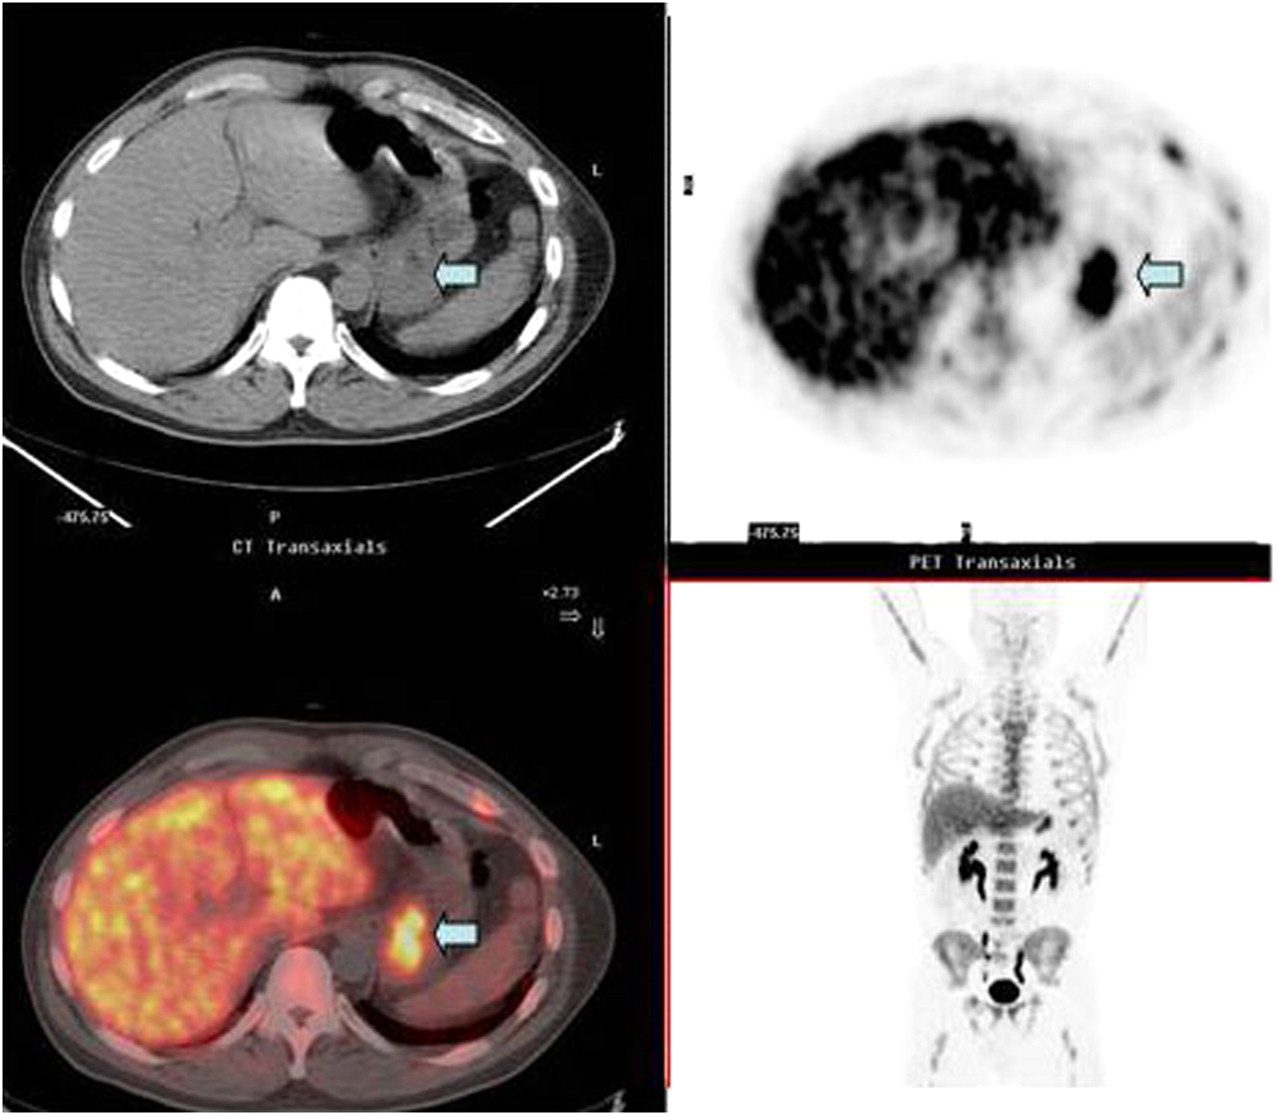
18F-FLT will likely be the next metabolic radiotracer that becomes widely available for clinical PET (63,64). 18F-FLT is an analog of thymidine and as such is a substrate for the enzyme thymidine kinase, which phosphorylates native thymidine. 18F-FLT has also been shown to be an excellent marker of proliferation, even though the phosphorylated form is not incorporated into DNA (38). In the laboratory, 18F-FLT is a better biomarker than 18F-FDG for some cancer treatment situations in which proliferation is stopped but the cancer cells remain viable (65). 18F-FLT may also show early response in clinical studies of lymphoma (66). Figure 5 shows uptake of 18F-FLT in a human gastric cancer.

18F-FLT uptake in gastric cancer (arrow) is indicator of rapid tumor cell proliferation: companion CT image through region of stomach mass (upper left), transaxial PET image showing 18F-FLT uptake in gastric mass (arrow; upper right), coronal PET image showing 18F-FLT uptake in gastric mass adjacent to left lobe of liver (bottom right), and fusion image of PET and CT showing 18F-FLT uptake in gastric mass (arrow; bottom left).
Endocrine Biomarkers
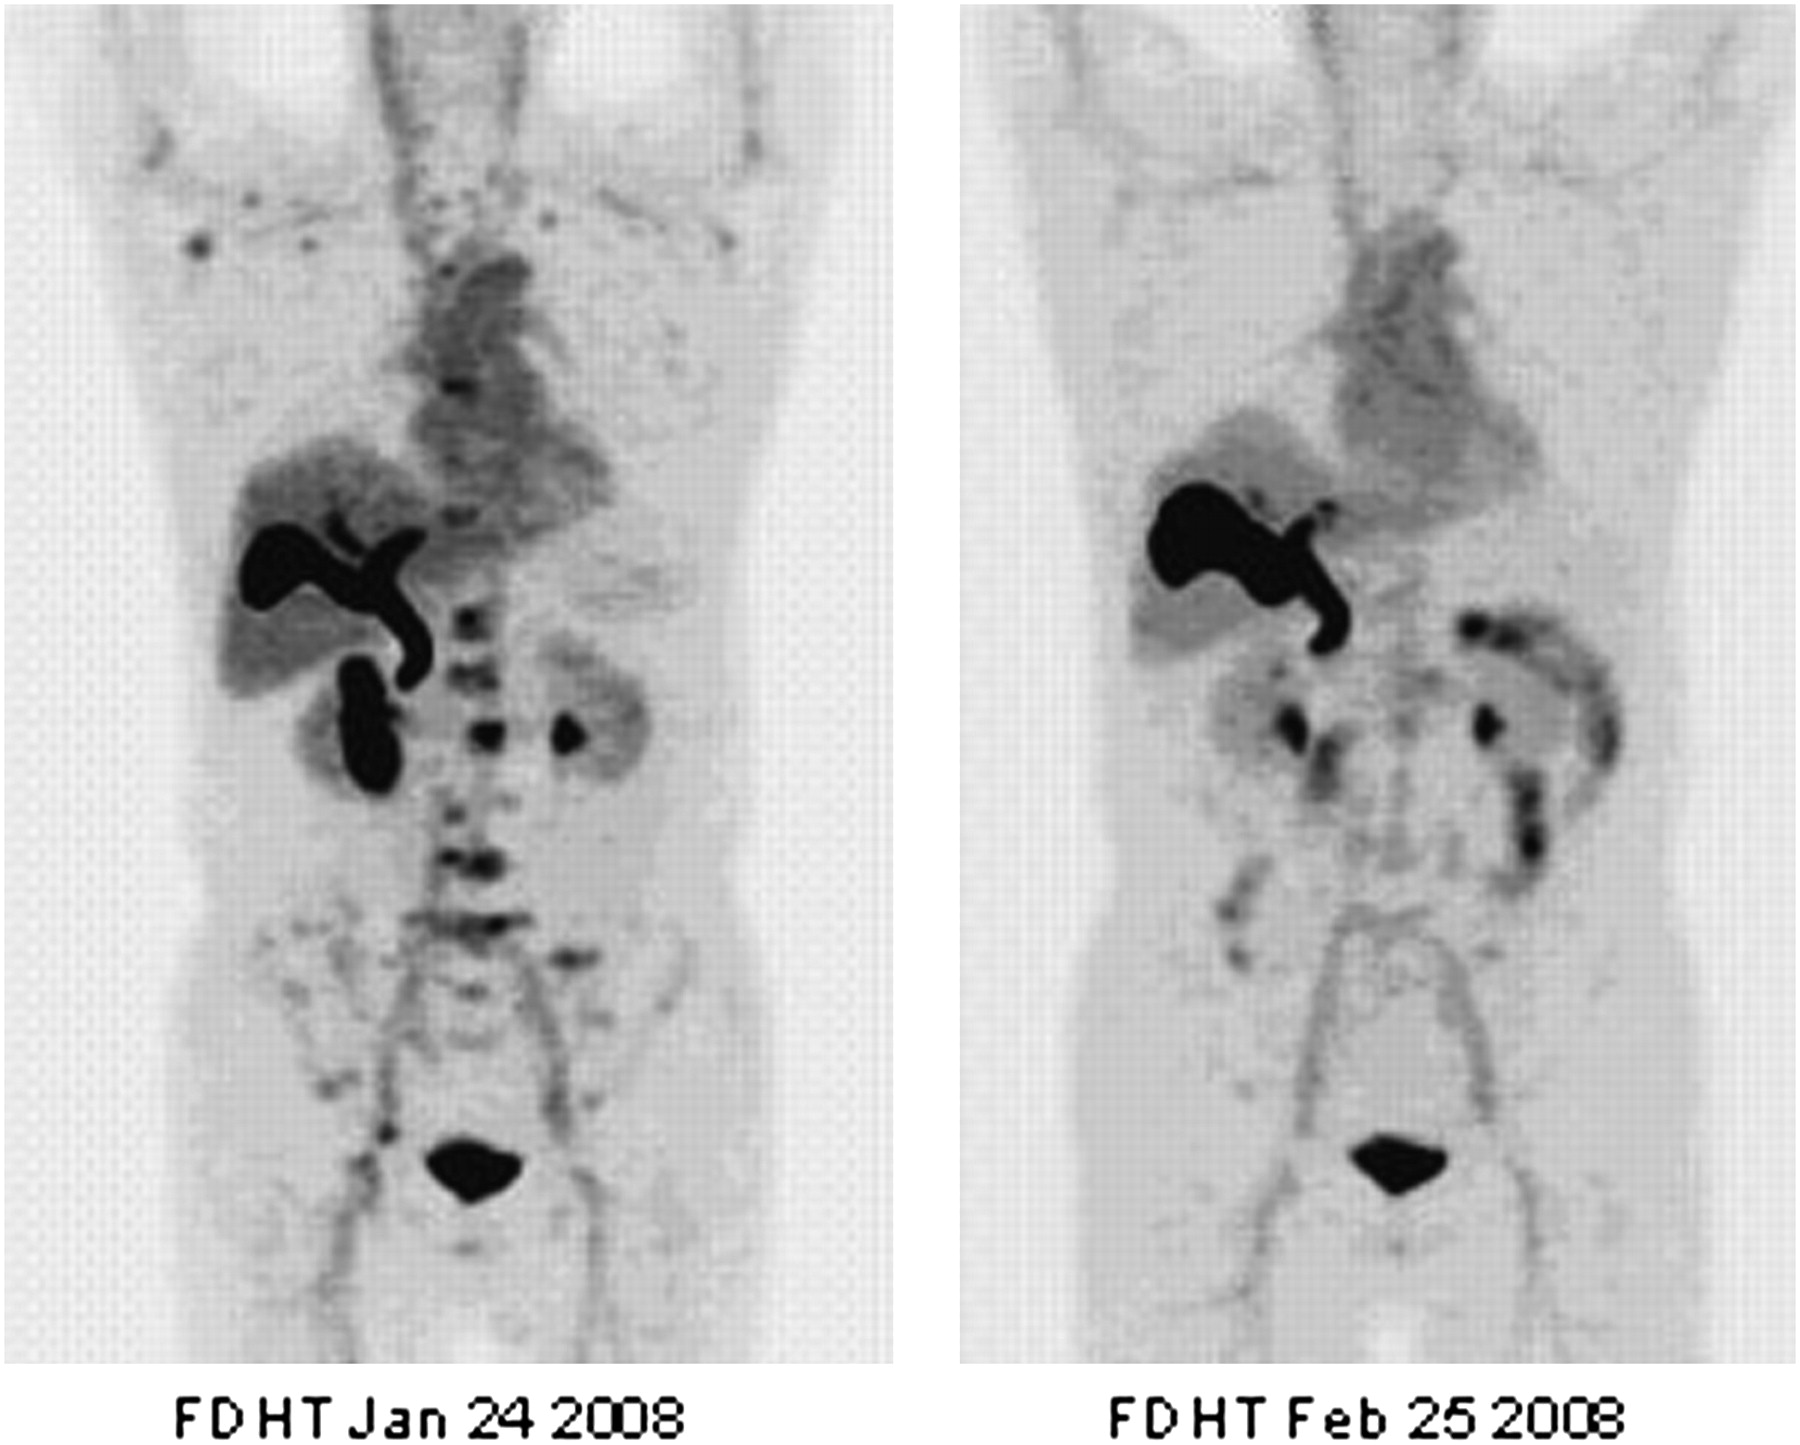
Tumor cells that arise from endocrine-responsive tissues such as prostate, breast, and thyroid have specialized biomolecules that can be imaged with PET. Figure 6 shows an example of the radiotracer 16β-18F-fluoro-5α-dihydrotestosterone (18F-FDHT) being used as a biomarker to demonstrate that antiandrogen therapy, an experimental, high-affinity androgen receptor–binding agent being studied under the name Medivation, has hit the biologic target, which in this case is the androgen receptor. In the example shown, the dose of the inhibitor drug for the androgen receptor completely blocks the uptake of the radiotracer 18F-FDHT, indicating that the dose is adequate to saturate the receptor in vivo (67). Other commonly used endocrine biomarkers include 16α-18F-fluoro-17β-estradiol (18F-FES) (68), an analog of estradiol, which binds with high affinity to the antigen receptor in breast and gynecologic tumors, and sodium 124I, a biomarker for the sodium iodide symporter (NIS) (69).

Actively metabolizing tumor with pre- and posttreatment uptake of 18F-FDHT, an androgen ligand radiotracer, in multiple lumbar vertebrae before (left) and after (right) treatment with Medivation, a high-affinity androgen receptor being studied under approved protocol at MSKCC.
Hypoxia Biomarkers
Tumor cell masses that are larger than 200 μm are unable to sustain themselves by diffusion of oxygen alone and, therefore, must recruit a blood supply to proliferate further (70). By its nature, this process involves hypoxia, because it is the hypoxic cells that produce factors such as vascular endothelial growth factor, which induces proliferation of the tumor vasculature. As the tumor mass gets larger, it continually grows its blood supply, creating a cycle in which more and more hypoxia is present and more and more vasculature is required to sustain the cellular mass. So the tumor becomes more resistant to therapy, particularly radiotherapy (71). For this reason, several types of hypoxia imaging probes have been developed; 18F-misonidazole (18F-FMISO) is one of the most widely used in clinical research (72,73). The mechanism of action is related to the chemical properties of 18F-FMISO; under hypoxic conditions the molecule becomes reactive with intracellular proteins and is fixed in the cell. 18F-FMISO has been mainly studied in head and neck tumors (72,73); the extent of uptake shows the extent of hypoxic regions within the tumors. 60Cu-diacetyl-bis(N4-methylthiosemicarbazone) has also shown promise in detecting hypoxic regions, particularly in gynecologic tumors (74).
TRANSLATION FROM LABORATORY APPLICATIONS TO CLINICAL RESEARCH
The development of 68Ga-labeled (Fab′2) trastuzumab (Herceptin; Genentech USA, Inc.) (75), a biomarker for the expression of HER 2 growth factor receptor, serves as an example of how a radioprobe is developed and how it progresses from the laboratory to the clinic (Fig. 7).

Progression of molecular imaging radioprobe from laboratory to clinic for MSKCC radiotracer that targets HER 2 receptor: 68Ga-Fab′2 trastuzumab (75). Animal studies with human breast tumor xenografts are imaged with small-animal PET (left), and initial study in human patient with metastatic breast cancer (right) causing lytic skull lesion (companion CT image, leftmost image of right panel), with positive uptake on fusion image (rightmost image of right panel).
HER 2 is a membrane tyrosine kinase–linked growth factor receptor and in some tumors and under some conditions can serve as an oncogenic protein. This means that unchecked hyperactivity of the receptor, usually accompanied by overexpression of HER 2 in the membrane, is an important driver of proliferation in certain tumors, particularly breast cancer. A subset of about 20% of breast cancers has high expression of HER 2, and patients with these cancers may respond to anti-HER 2 antibodies. In fact, the use of antibodies is now an established therapy in advanced breast cancer. In addition, HER 2 is a client protein for the commonly available chaperone protein, heat shock protein 90 (HSP 90), and the concentration of the protein on the membrane is rapidly downregulated by drugs that effectively block the action of HSP 90 in cancer cells.
We exploited the known biology of HER 2 in the development of a PET assay for HER 2 expression (Fig. 7). We obtained commercially available trastuzumab from the pharmacy and created Fab′2 fragments by papain digestion. 1,4,7,10-tetraazacyclodocecane-N,N′,N″,N′″-tetraacetic acid chelate was then attached to the molecule, and a radiolabel was created using 68Ga, which was obtained from a germanium generator system. Testing began in nude mice bearing an HER 2–positive breast cancer cell line, BT 747. Several groups of mice, which were treated with 17-AAG (a drug known to inhibit HSP 90) were directly compared. The quantitative imaging results obtained in the small-animal PET camera were directly compared with Western blots that were run on excised tumors. The comparison expressed was the percentage change in signal versus the percentage and intensity of the HER 2 on the Western blots.
After directly validating the concept that the change in radiotracer uptake was proportional to the change in HER 2 protein expression, we performed the studies in animals. The PET assay of HER 2 expression was used as a dynamic marker to evaluate the effect of the HSP 90 drug treatment. 18F-FDG PET as a biomarker for treatment response was also compared; the drop in HER 2 expression was an early signal of the drug effect, which took significantly longer to appear as a change on 18F-FDG PET (76).
Because of its potential importance for imaging HER 2 expression in vivo in patients, we obtained investigational new drug approval for the radiotracer, which we called Herscan. In developing this agent for human use, we followed guidelines for radiopharmaceutical development according to the U.S. Food and Drug Administration Web site (http://www.fda.gov/cder/regulatory/medImaging/default.htm). Toxicity testing was performed with doses of radioantibody that were more than 100 times the tracer dose that was to be used in patients. Organs were examined by a qualified veterinary pathologist; no ill effects were observed over a 2-wk period, and no toxicity was discovered on the necropsy specimens. Human studies are ongoing in patients being treated with HSP 90 inhibitor drugs and in patients being treated with trastuzumab. Three years passed between the first publication of the original animal article and the beginning of human trials. We anticipate that the use of this reagent will help us plan more effective drug regimens based on monitoring the HER 2 receptor as an important therapeutic target for antibodies and HSP 90 inhibitor drugs.
CONCLUSION
Molecular imaging probes for cancer metabolism, endocrine status, hypoxia, oncofetal and differentiation antigens, and gene expression imaging and pharmacology are being developed in the laboratory and are slowly finding their way into clinical research. By incorporating selective molecular imaging probes into clinical trials of anticancer agents, it will be possible to improve treatment selection and better monitor treatment response. We believe that the combination of volumetric CT methods with appropriate molecular probes imaged with PET offers a quantum leap in our ability to accurately characterize individual human tumor masses in clinical oncology.
Footnotes
-
↵* NOTE: FOR CE CREDIT, YOU CAN ACCESS THIS ACTIVITY THROUGH THE SNM WEB SITE (http://www.snm.org/ce_online) THROUGH FEBRUARY 2010.
-
Dr. Larson reports having a financial interest in Philips ADAC, Novartis Pharmaceutical Corp., Wilex AG, Bayer HealthCare, Cellector, GE Amersham, CTI Siemens, and Genentech. Dr. Schwartz reports having an affiliation with GE Medical Systems, Bio-Imaging, Novartis, Merck, and AstraZeneca. No other potential conflict of interest relevant to this article was reported.
-
COPYRIGHT © 2009 by the Society of Nuclear Medicine, Inc.
References
- 1.↵
- 2.↵
- 3.↵
- 4.↵
- 5.↵
- 6.↵
- 7.↵
- 8.↵
- 9.↵
- 10.↵
- 11.↵
- 12.↵
- 13.↵
- 14.↵
- 15.↵
- 16.↵
- 17.↵
- 18.↵
- 19.↵
- 20.↵
- 21.↵
- 22.↵
- 23.↵
- 24.↵
- 25.↵
- 26.↵
- 27.↵
- 28.↵
- 29.↵
- 30.↵
- 31.↵
- 32.↵
- 33.↵
- 34.↵
- 35.↵
- 36.↵
- 37.↵
- 38.↵
- 39.
- 40.↵
- 41.↵
- 42.↵
- 43.↵
- 44.↵
- 45.↵
- 46.↵
- 47.↵
- 48.↵
- 49.↵
- 50.
- 51.↵
- 52.↵
- 53.↵
- 54.↵
- 55.
- 56.↵
- 57.↵
- 58.↵
- 59.↵
- 60.↵
- 61.↵
- 62.↵
- 63.↵
- 64.↵
- 65.↵
- 66.↵
- 67.↵
- 68.↵
- 69.↵
- 70.↵
- 71.↵
- 72.↵
- 73.↵
- 74.↵
- 75.↵
- 76.↵
- Received for publication August 4, 2008.
- Accepted for publication December 2, 2008.


Jump to section
- Article
- Abstract
- LIMITATION AND POTENTIAL IMPROVEMENT OF CONVENTIONAL RESPONSE-ASSESSMENT METHODS
- NEED FOR BETTER RESPONSE ASSESSMENT FOR NSCLC
- FUNCTIONAL RESPONSE ASSESSMENT IN NSCLC
- FUTURE APPLICATIONS OF MOLECULAR IMAGING WITH PET
- TRANSLATION FROM LABORATORY APPLICATIONS TO CLINICAL RESEARCH
- CONCLUSION
- Footnotes
- References
- Figures & Data
- Info & Metrics
Related Articles
Cited By...
- Serial Diffusion MRI to Monitor and Model Treatment Response of the Targeted Nanotherapy CRLX101
- 17{beta}-Estradiol Augments 18F-FDG Uptake and Glycolysis of T47D Breast Cancer Cells via Membrane-Initiated Rapid PI3K-Akt Activation
- Preparation, Biological Evaluation, and Pharmacokinetics of the Human Anti-HER1 Monoclonal Antibody Panitumumab Labeled with 86Y for Quantitative PET of Carcinoma
- Efficacy of PHA-848125, a Cyclin-Dependent Kinase Inhibitor, on the K-RasG12DLA2 Lung Adenocarcinoma Transgenic Mouse Model: Evaluation by Multimodality Imaging