


Abstract
In this study, we examined the in vivo relationship between functional tumor vasculature, determined by dynamic contrast-enhanced (DCE-) MRI, and tumor metabolism, determined by dynamic 18F-FDG PET, during cytotoxic treatment of patients with colorectal liver metastases. Methods: Twenty-three patients underwent DCE-MRI (using gadolinium dimeglumine) and dynamic 18F-FDG PET at baseline and after 3 treatment cycles, unless treatment was terminated because of toxicity. Parameters for vasculature (rate constant between extravascular extracellular space and blood plasma [kep] and volume transfer constant [Ktrans]), extracellular space (ve), tumor size (the maximal axial diameter of each included lesion [MAD]), and metabolism (glucose metabolic rates [MRglc]) were derived, and changes during treatment were correlated. Overall survival (OS) and progression-free survival (PFS) served as outcome measures for the predictive abilities of pretreatment parameters and of treatment-related parameter changes. Results: Pretreatment MRglc and MAD were individually predictive for OS and PFS. During treatment, Ktrans increased significantly, but this increase could not be confirmed in a lesion-by-lesion analysis. MRglc decreased significantly (P < 0.001). No correlations were found for changes in DCE-MRI parameters and ΔMRglc. No relationship was found between changes in DCE-MRI parameters and OS or PFS. ΔMRglc was able to predict OS (P = 0.008) after correction for confounders. Conclusion: The efficacy of cytotoxic chemotherapy assessed by reduction in tumor metabolism does not depend on pretreatment properties of the tumor vasculature determined by DCE-MRI. Cytotoxic chemotherapy does not alter DCE-MRI–derived properties of tumor vasculature but decreases glucose consumption of tumor cells.
Chemotherapy is usually the treatment of choice in patients with advanced colorectal cancer (CRC). Advances in cytotoxic treatment have improved the median survival from 8 mo to more than 20 mo (1). Unfortunately, chemotherapy is only effective in a subset of patients. Early response prediction would enable individualized treatment and prevent side effects and costs due to futile treatment of nonresponders.
The efficacy of chemotherapy depends on the delivery of cytotoxic drugs by the tumor vasculature, uptake and retention of the drug in tumor cells, metabolic activation of prodrugs, intrinsic chemosensitivity of tumor cells, and catabolism and excretion of drugs. Capillary perfusion and permeability of the vessel wall can be measured in vivo by dynamic contrast-enhanced MRI (DCE-MRI) using gadolinium dimeglumine (Gd-DTPA) as the contrast agent (2). Glucose metabolic activity can be assessed in vivo by PET using the radionuclide-labeled glucose analog 18F-FDG (3).
Pharmacokinetic analysis of DCE-MRI data yields parameters for perfused capillaries including blood flow, permeability, and the total surface area. Assuming that vascularity, as reflected by these parameters, is also relevant for the delivery of relatively small cytotoxics to the tumor, it may be hypothesized that these parameters can be used for the prediction of treatment response. The value of baseline DCE-MRI parameters to predict treatment outcome has been shown for several tumor types including CRC (4,5), and its significance in the early monitoring of treatment response has been shown for rectal (5) and breast (6–8) cancer.
18F-FDG uptake is increased in malignant tumors. An adequate vascular supply and the presence of several membrane-bound glucose transport proteins are necessary for the delivery of glucose to tumor cells, and intracellular hexokinase is necessary for subsequent phosphorylation. 18F-FDG uptake can be quantified by glucose metabolic rates (MRglc) derived from dynamic 18F-FDG PET data. The value of baseline MRglc as a predictive parameter for treatment outcome has been shown for several tumor types, including non–small cell lung carcinoma and CRC (9), and its predictive value using changes in MRglc for the early evaluation of response during chemotherapy has been shown in many tumor types, including non–small cell lung carcinoma (10) and CRC (11).
Because DCE-MRI and 18F-FDG PET assess 2 different determinants of chemotherapy efficacy, their combination could aid in the unraveling of the principles of chemosensitivity. In this prospective study, we investigated the predictive value of pretreatment pharmacokinetic parameters and the value of (early) cytotoxic therapy–induced changes in pharmacokinetic parameters of Gd-DTPA and 18F-FDG with respect to overall survival (OS) and progression-free survival (PFS).
MATERIALS AND METHODS
Patients
Patients with liver metastases of histologically proven CRC who underwent a diagnostic work-up before the start of cytotoxic chemotherapy between June 2002 and September 2005 were eligible. Liver metastases were established during routine staging or during follow-up by abdominal CT (n = 21), ultrasound (n = 1), or MRI (n = 1). Follow-up included a 3-monthly ultrasonography or CT scan. Patients with diabetes mellitus, severe claustrophobia, or implanted electrical devices and with (multiple) small (<1 cm) lesions, in whom the limited spatial resolution of the PET scanner would pose technical difficulties for quantification, were excluded. The study was approved by the institutional review board of the Radboud University Nijmegen Medical Centre, and all patients gave written informed consent.
Thirty-three patients with liver metastases of CRC were included in this prospective study. For 5 patients, DCE-MRI data were not complete because of technical problems (n = 2) or the unavailability of a pretherapy scan (n = 1) or a follow-up scan (n = 2); for 4 patients, 18F-FDG PET data were not complete because of technical problems during the follow-up dynamic acquisition (n = 1) or the unavailability of a follow-up scan (n = 3). For 1 patient, both DCE-MRI and 18F-FDG PET at follow-up were inaccessible. Therefore, complete datasets of 2 DCE-MRI and two 18F-FDG PET scans were available for 23 patients for analysis of treatment response. Patient characteristics are listed in Table 1. Thirty-one lesions in total could be matched for lesion-by-lesion analysis on MRI (34 lesions visible) and 18F-FDG PET (56 lesions visible because of the larger axial field of view [FOV] of PET than MRI) by 2 experienced observers. In 4 patients, metastases visible on DCE-MRI could not be identified as separate lesions on 18F-FDG PET. Therefore, the MRglc of the combined lesion was used.
Patient Characteristics
Nine patients received chemotherapy in the first, 11 in the second, 2 in the third, and 1 in fourth lines. The median interval between the last day of the previous-line chemotherapy and the baseline scan for patients treated in the second or higher line was 39 d (interquartile range [IQR], 23–150 d). None of these 14 patients had been treated with antiangiogenic agents before inclusion in the study. The treatment regimens were irinotecan (n = 7), capecitabine (n = 5), capecitabine/irinotecan (n = 4), capecitabine/oxaliplatin (n = 3), 5-fluorouracil (5-FU)/folinic acid/oxaliplatin (FOLFOX; n = 3), and 5-FU/folinic acid (n = 1).
No patients were lost to follow-up. Median OS was 1.5 y (1-, 2-, and 3-y proportions, 70%, 26%, and 9%, respectively), and median PFS was 5.3 mo. At the closeout date, 2 patients were alive (follow-up, 4.3 and 5.6 y, respectively). All patients showed progression of disease.
DCE-MRI and 18F-FDG PET were performed before the start and after 3 cycles of chemotherapy (cycle duration, 21 d, except for FOLFOX, which lasted 14 d). When treatment was terminated before 3 cycles (n = 6; range, 0.5–2.0 cycles), the follow-up scan was performed earlier. The median duration of treatment was 50 d (IQR, 30–56 d). The median interval between the last treatment day and the follow-up scan was 6 d (IQR, 2.5–15.5 d).
DCE-MRI
Quantitative DCE-MRI Data Acquisition and Reconstruction
Measurements were performed on a 1.5-T Siemens MRI scanner, using a body phased-array coil. After conventional T1- and T2-weighted imaging, 15 mL of 0.5 M Gd-DTPA (Magnevist; Schering) was administered intravenously at an injection rate of 2.5 mL·s−1 by a Spectris MR injection system (Medrad Inc.). An axial T1-weighted fast low-angle shot sequence was used to monitor Gd-DTPA uptake in the tumor and the bolus passage in vessels in the spleen (repetition time [TR], 21 ms; echo time [TE], 1.5–1.57 ms; flip angle, 45°; slice thickness, 7 mm, 4–6 slices; matrix size, 256 × 125 pixels; FOV, 284 × 350 mm; total acquisition time, 90 s). The fast acquisition scheme was performed multislice; that is, 4–6 slices were acquired simultaneously within the TR, realized by short TE and short pulse duration. The acquisition matrix was 256 × 125 pixels per slice. Application of the partial Fourier technique (factor, 6/8) reduced the number of phase-encoding steps to 94, which in turn led to a net temporal resolution of 94 × approximately 21 ms = approximately 2 s. If the 4–6 slices in the axial FOV did not fully cover the tumor in the axial direction, slices were positioned in such a way that the largest diameter of the tumor (on the coronal view) was covered. During the acquisition, patients were instructed to breathe quietly and shallowly.
Immediately before the Gd-DTPA injection, proton density–weighted images were recorded with the same sequence parameters as those for the DCE-MRI, except for a flip angle of 10° and a TR of 250 ms. Data from these images were combined with the DCE-MRI data to calculate the concentration of Gd-DTPA in arbitrary units, using the methods described by Hittmair et al. (12).
MRI Data Analysis
For the analysis of DCE-MRI, a vascular normalization function was obtained from pixels in the spleen using an algorithm based on the concentration of Gd-DTPA (high in blood vessels) and time to bolus passage (short in arteries) as described earlier (13). Using a physiologic pharmacokinetic model (14), we analyzed the Gd-DTPA concentration versus time curves of the pixels in all MRI slices (256 × 125 pixels) containing tumor tissue, and the kep (s−1) of Gd-DTPA uptake was calculated according to the formula  , in which ct is the tissue concentration of Gd-DTPA, kep is the rate constant of contrast agent exchange between the extracellular extravascular space and the plasma compartment, Ktrans is the volume transfer constant between these compartments (s−1), cp is the concentration of contrast agent in plasma of a capillary, and ⊗ denotes a convolution operation (2). In Larsson's model (14), the Gd-DTPA uptake rate constant (kep) is directly related to tumor blood flow, the product of the permeability, and the total surface area of perfused capillaries, according to
  , in which ve is the volume of extravascular extracellular space per unit volume of tissue, P is the permeability of capillaries (cm·s−1), S is the total surface area of the vessels (cm2), and TBF is the tumor blood flow (mL·s−1). Previous reports have confirmed that there is a moderately strong positive correlation between kep and microvessel density in liver metastases (r = 0.458, P = 0.037) (15).
The spatial distribution of the pharmacokinetic parameters was represented as a map. On a T1-weighted MR image recorded directly before Gd-DTPA injection, a region of interest (ROI) was drawn that comprised the metastases. Only large lesions (i.e., >15 mm) that were totally covered by the FOV of the acquired images and were not disturbed by artifacts of inflow of Gd-DTPA in the abdominal aorta (i.e., lesions directly ventral to the aorta) were included. Six lesions were smaller than 30 mm. This ROI was applied to the map of pharmacokinetic parameters to select the single values of kep, Ktrans, and ve for all tumor pixels. Whole-tumor values were calculated after log transformation of all voxels within the ROI, thereby excluding voxels for which kep, Ktrans, and ve = 0 s−1, which are assumed to represent necrotic tissue or fit artifacts. Mean tumor values and 95% confidence intervals were obtained by backtransformation (13). To obtain a whole-patient value, a mean value, weighted by lesion volume, of all lesions within the FOV was determined by:
The coronal T1-weighted images were used to measure the maximal axial diameter of each included lesion (MAD, in mm) to evaluate morphologic treatment response. Patient-based MADs were calculated by the sum of all included lesions.
18F-FDG PET
Quantitative Dynamic 18F-FDG PET Data Acquisition and Reconstruction
Dynamic PET was performed on an ECAT-EXACT 47 dedicated PET scanner (Siemens/CTI) using the ECAT 7.2.1 software for 2-dimensional reconstruction. Patients fasted for at least 6 h before imaging. Intake of sugar-free liquids was permitted. Blood glucose levels (hexokinase method) (Aeroset; Abbott Diagnostics) were determined. The median fasting glucose level was 5.3 mmol·L−1 (maximum, 9.2 mmol·L−1). The location for the dynamic acquisition in the axial FOV (162 mm in 47 planes) of the scanner was based on whole-body 18F-FDG PET and CT scans obtained for routine clinical work-up, including as many measurable tumor lesions as possible. A 20-min transmission scan was made, using the internal 68Ge/68Ga sources, to correct for photon attenuation. Approximately 200 MBq (mean ± SD, 202 ± 40 MBq) of 18F-FDG (Covidien) was injected intravenously using constant infusion by a remote-controlled pump (Medrad Inc.). The dynamic data acquisition, performed in 2-dimensional mode, was started simultaneously with the injection of 18F-FDG and consisted of 16 time frames with variable duration (10 × 30, 3 × 300, and 3 × 600 s) for a total time of 50 min. During the acquisition, patients were instructed to breathe quietly and shallowly. Correction for decay, randoms, and scatter was performed. Attenuation-corrected images were reconstructed in 128 × 128 matrices using filtered backprojection with a gaussian filter of 4 mm in full width at half maximum. This resulted in forty-seven 3.375-mm slices for each time frame, with voxel dimensions of 3.432 × 3.432 × 3.375 mm and a spatial resolution of 6 mm in full width at half maximum in the reconstructed images.
18F-FDG PET Data Analysis
18F-FDG PET data were analyzed as described before (16). In brief, a plasma time–activity concentration curve was obtained by serial arterial sampling. When arterial sampling was not feasible or was contraindicated, an image-derived input function of the abdominal aorta was used (48% of forty-six 18F-FDG PET scans). Tumor time–activity concentration curves were obtained by determination of volume-weighted mean activity concentration within ROIs. These ROIs were placed semiautomatically over the metastases using 50% of the maximum voxel value within the lesion on the summed images of frames 14–16 (20–50 min after injection). For therapy response monitoring, the lesion-specific ROI with the largest volume was copied to the other scan (17). Using Patlak graphical analysis (3,18), we determined MRglc, using a lumped constant of 1 and a fractional blood volume of 0. A volume-weighted mean value for all lesions corresponding with DCE-MRI was obtained as patient-based data using the same equation as the one used for DCE-MRI data.
Clinical Follow-Up
Follow-up was performed according to a stringent protocol for 3 y in accordance with standard clinical care. Tumor response for clinical decision making was evaluated by experienced radiologists, without knowledge of DCE-MRI or dynamic 18F-FDG PET results, according to Response Evaluation Criteria in Solid Tumors (19). Changes in the DCE-MRI parameters (kep, Ktrans, ve), MAD, and 18F-FDG PET parameter MRglc during treatment were calculated as:
The date of progression was defined as the earliest date at which disease progression was confirmed. Survival and progression were measured from the date of baseline 18F-FDG PET or DCE-MRI (whichever was performed first) to the date of, respectively, disease-related death or progression. For patients who were alive (n = 2) at the closeout date (May 2009), survival was censored.
The median interval between all DCE-MRI and 18F-FDG PET scans was 0 d (IQR, 0–1 d). The mean interval between the baseline and the first follow-up PET scan was 59.1 ± 11.3 d.
Statistical Analysis
Both patient-based analysis and lesion-by-lesion analysis were performed. DCE-MRI, T1-weighted MRI, and 18F-FDG PET data were analyzed separately, and the results were masked. Variables were assessed for normality by Shapiro–Wilk statistics. Means (±SD) for normally distributed data or medians (IQR) are presented. Differences were assessed for significance by the Mann–Whitney U test and by the paired t test (normally distributed) or Wilcoxon signed rank test for paired data. Correlations were determined by the nonparametric Spearman ρ.
Cancer-related OS and PFS were calculated using Kaplan–Meier estimates. Both univariate and multivariate analyses were performed by the Cox proportional hazards model. The relationship between DCE-MRI and 18F-FDG PET parameters and OS and PFS was assessed for both pretreatment values (predictive value of tumor parameters) and changes in parameter values during treatment (predictive value of early treatment response). Separate (univariate) analysis was performed for the relationship between OS and PFS and the following covariates: number of lesions, patient age, TNM classification, tumor differentiation, histology or localization, chemotherapy line (first line vs. second or higher lines), and regimen and the number of chemotherapy cycles before the follow-up scan. Hazard ratios (HRs) are presented with their 95% confidence intervals (Wald χ2 test). Multivariate analysis was performed using imaging parameters and significant covariates in a backwardly designed conditional Cox proportional hazards model, removing variables when P was greater than 0.100.
All statistical analyses were performed with SPSS software (version 16.0.2 for Mac; SPSS Inc.). Statistical tests were based on a 2-sided significance level set at P = 0.050 for all tests.
RESULTS
Predictive Value of Pretreatment DCE-MRI and 18F-FDG PET
An example of DCE-MRI and 18F-FDG PET data is displayed in Figure 1. No statistically different pretreatment parameters for tumor size and vascular parameters were found for patients who were treated in the first line (n = 9) versus patients who had been treated with cytotoxic therapy previously (n = 14). MRglc was slightly lower in the patients who were treated in the first line. This, however, did not reach significance (median MRglc, 0.1095 μmol·mL−1·min−1 vs. 0.1373 μmol·mL−1·min−1, P = 0.072).
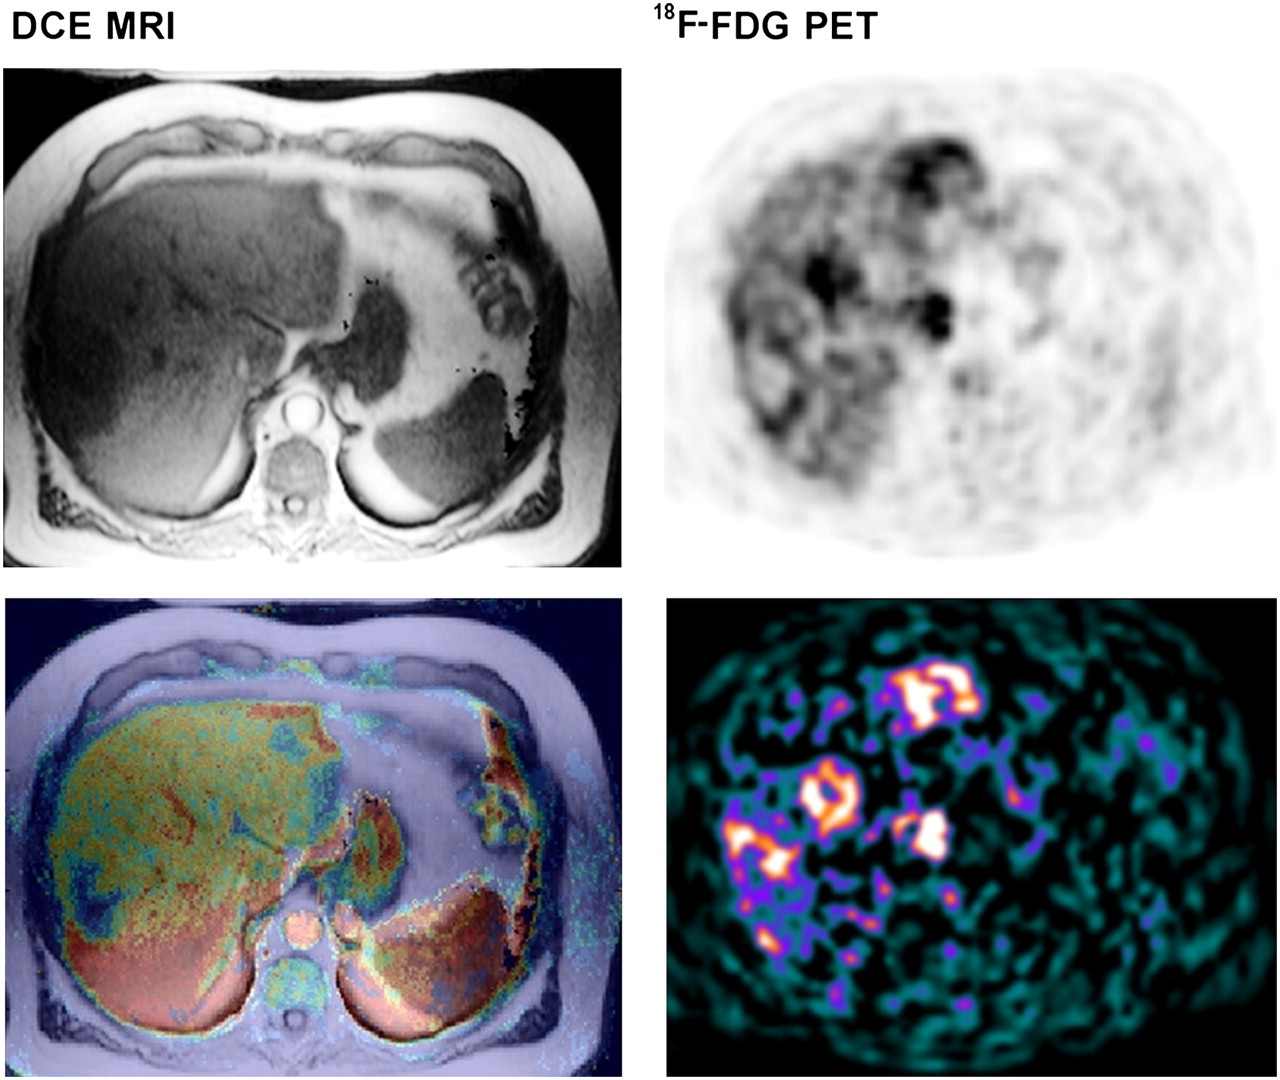
Example of 78-y-old man with intermediately differentiated adenocarcinoma of sigmoid (T3N1M1) with metachronous liver metastases. (Left, top to bottom) Conventional T1-weighted MR image (before Gd-DTPA) and fused parametric image of kep values with T1-weighted MR image. (Right, top to bottom) 18F-FDG PET uptake image (20–50 min after injection) and parametric image of MRglc.
Patient-based analysis of the pretreatment scans showed a significant positive correlation between the tumor size (MAD) and the fraction of extravascular extracellular space (ve) (ρ = 0.426, P = 0.043). Neither the patient-based analysis nor the lesion-by-lesion analysis yielded significant correlations between pretreatment DCE-MRI and 18F-FDG PET parameters. The correlation between baseline kep and MRglc was −0.028 (P = 0.880).
Univariate Cox regression analysis established an OS and PFS benefit in patients with low baseline MRglc values. Baseline MAD showed a minor but significant relationship with OS as well, but chemotherapy line (first line vs. higher lines) showed no significant relationship with either OS or PFS in this group of patients. None of the DCE-MRI parameters for vascularity showed a significant relationship with either OS or PFS. When these variables were used in multivariate analysis, correction for MAD increased the HR of MRglc for OS and PFS, but additional correction for chemotherapy line did not improve the predictive ability of the model as a whole (Table 2).
Predictive Value of Pretreatment Parameters to Survival Assessed by Cox Regression Analysis
Lesion-by-Lesion Analysis of Changes in Scan Parameters
A significant change in median MRglc (0.138 μmol·mL−1·min−1 to 0.059 μmol·mL−1·min−1, P < 0.001) was found at the follow-up, but no significant changes were seen in the other parameters. Ktrans did not change significantly (P = 0.088). No correlations were present between changes in 18F-FDG PET parameters and changes in DCE-MRI parameters during treatment.
Predictive Value of Changes in DCE-MRI and 18F-FDG PET Parameters
For response to chemotherapy, no statistical differences were seen between the changes in tumor size, DCE-MRI vascularity parameters, and MRglc, between the group that was treated with systemic treatment in the first line (n = 9) and the group that was treated in higher lines (n = 14) (all P > 0.305).
Results of scan parameters before and after the start of treatment are provided in Table 3. There was a significant change in both MRglc (median baseline, 0.128 μmol·mL−1·min−1 to 0.054 μmol·mL−1·min−1 at follow-up, P < 0.001) and Ktrans (median baseline, 0.009 s−1 to 0.016 s−1 at follow-up, P = 0.035) during chemotherapy. No significant correlations were found between parameter changes during treatment. The correlation between ΔKtrans and ΔMRglc was ρ = −0.172 (P = 0.433).
Baseline and Follow-up Values of Vascular and Metabolic Parameters (n = 23 Patients)
To assess whether preexisting vasculature as assessed by DCE-MRI influenced therapy response by delivery of cytotoxic drugs, kep before chemotherapy was correlated to metabolic and anatomic response, but no significant relationship could be established between kep and ΔMAD (ρ = −0.209, P = 0.340) or ΔMRglc (ρ = 0.257, P = 0.237). The same applied for Ktrans and ve. In lesion-by-lesion analysis, kep before chemotherapy was not correlated with ΔMAD (ρ = −0.197, P = 0.289) or ΔMRglc (ρ = 0.293, P = 0.109).
Univariate Cox regression analysis showed no relationship of any change in DCE-MRI or 18F-FDG PET parameters with respect to OS. When all lesions inside the larger FOV of the PET scanner were quantified (instead of only the matching lesions) to determine a patient-based MRglc, ΔMRglc was predictive for OS (HR, 1.15; P = 0.041). Only ΔMAD was related to both OS (HR, 1.40; P = 0.023) and PFS (HR, 1.34; P = 0.026). Chemotherapy line was not a significant confounder for OS or PFS. Multivariate Cox regression modeling showed both ΔMRglc (HR, 1.22; P = 0.008) and Δkep (HR, 0.99; P = 0.100) as predictors for OS, but the latter was irrelevantly small. For PFS, both ΔMAD (HR, 1.48; P = 0.010) and chemotherapy line (HR, 3.15; P = 0.023) were of predictive relevance. Results are shown in Table 4.
Predictive Value of Therapy-Induced Parameter Changes for Early Response Evaluation, Assessed by Cox Regression Analysis
DISCUSSION
Pretreatment Parameters for Vascularity and Metabolism
No association was seen between vascularity, assessed by DCE-MRI, and glucose metabolism, assessed by 18F-FDG PET. Our results confirm those of Brix et al. (20), who found no correlation between kep and 18F-FDG uptake (standardized uptake value [SUV]) in breast cancer. Semple et al. (21), however, found a positive correlation between kep and SUV (ρ = 0.5) and a positive, though nonsignificant, correlation between Ktrans and SUV in breast carcinoma patients before the commencement of treatment. They suggested that 18F-FDG delivery was restricted by the blood flow dynamics of the tumor. In a previous study (15), we found a negative correlation between kep and 18F-FDG uptake (tumor-to-nontumor ratios) in CRC.
The different relationships between vascular and metabolic tumor parameters described in the literature could imply that tumor vasculature is not related to MRglc. However, a more complex relationship between vasculature and MRglc, mediated by acute and chronic tumor hypoxia, could also play a role: Chronic hypoxia and diminished delivery of glucose could be caused by a low blood flow, a low permeability, or a small surface area of tumor blood vessels resulting in low values for kep. All these vascular parameters may result in a decreased supply of nutrients such as glucose and oxygen to the tumor, similar to the decreased delivery of Gd-DTPA, which would lead to decreased cell proliferation as an energy-saving method (22) or to necrosis or apoptosis. This situation would result in a positive correlation between kep and MRglc. Conversely, (transient) hypoxia due to poor vascular function (as measured by a low value for kep) might induce higher glucose uptake in the tumor for anaerobic glycolysis (15,23,24). The latter explanation would result in a negative correlation between kep and MRglc. Therefore, the opposite, combined, complex effects of acute and chronic hypoxia and nutrient supply could explain the lack of correlation between kep and MRglc. Another reason for this lack of correlation could be nonspecificity of Ktrans and kep, which may represent flow, vessel permeability, or surface area or a combination of these. Finally, imprecision in the determination of the DCE-MRI or PET parameters combined with the limited study size might explain the lack of correlation.
Both pretreatment tumor metabolism (MRglc) and size (MAD) were associated with higher hazards for death and progression. This confirms previous data (9), which showed that a 1-unit increase in SUV results in a 17% increase in the risk of death. Multivariate analysis showed no influence of chemotherapy line (first- vs. higher-line treatment) for the predictive abilities of MRglc and MAD.
Previously, Semple et al. (25) had observed a significant correlation (P < 0.05) between pretreatment kep and ΔSUV during chemotherapy of 17 breast cancer patients and concluded that the reduction of measured metabolism may be partly attributable to pretherapy vascular delivery (kep). Because Gd-DTPA and phenylacetate (which has a size similar to 5-FU) are similarly distributed in the interstitium of tumor tissue (26), a restriction of Gd-DTPA delivery to the interstitium reflects a restriction of 5-FU delivery to the immediate neighborhood of tumor cells. We could not confirm these findings in patients with CRC.
Early Changes in Metabolic and Vascularity Parameters During Treatment
We have found no significant treatment-induced changes in kep, ve, and MAD, whereas MRglc and Ktrans, respectively, significantly decreased and increased on a patient level. On a lesion level, the increase in Ktrans could not be reproduced. Our results suggest that the observed reduction in MRglc during chemotherapy cannot be explained by changes in tumor vasculature (Δkep). The antivascular effect of cytotoxic drugs is small and marginally influences cell metabolism and patient survival. It seems that direct cytotoxic effects leading to necrosis and apoptosis cause disease response and improved survival and that possible effects of chemotherapeutic agents on nutrient delivery play a minor role.
The reduction in kep during therapy has been described in breast cancer (27,28), and reduction in Ktrans during treatment has been described in rectal (5) and breast (6,7,29) cancer. Some authors explained these changes by the direct antivascular effect of the cytotoxic drugs (7,29) or by the loss of immature tumor vessels (5). Our results, however, do not suggest an effect of cytotoxic drugs on tumor vasculature in CRC.
We found no relationship between vascular parameters and clinical outcome. This confirms the results of our previous study showing no evident relevance of pretreatment kep, Ktrans, or ve for OS and PFS in colorectal liver metastases or any change in these parameters during first-line chemotherapy (30). In the present study, we observed a positive relationship between ΔMRglc and hazards for death but not for progression, which was mainly predicted by chemotherapy line and ΔMAD.
Because DCE-MRI and 18F-FDG PET both address different aspects of tumor physiology, they might be used complementarily in treatment-response evaluation. The choice for a specific imaging modality should depend on the treatment regimen. The cytotoxic drugs given to our patients interfere with DNA synthesis and stabilization, eventually leading to cell death. Therefore, the direct interaction with tumor vascularity is limited, as is suggested by our data, showing no change in DCE-MRI parameters during cytotoxic treatment. When antiangiogenic drugs are used, response might be predicted by DCE-MRI, as shown by 2 studies (31,32) in clear cell renal cell carcinoma patients treated with sorafenib. Response might be monitored by DCE-MRI, showing a decrease of kep (33), but results are still contradictory (32). The effect of cytotoxic drugs on cell metabolism can be monitored by 18F-FDG PET. Tumor metabolic response has predictive value (11), which is also shown by our data. Early disease-related deaths did occur in the group of metabolic responders. Therefore, a reduction in metabolism during therapy does not guarantee a long survival, and more effects presumably play a role.
Study Limitations
Patients were treated in different lines of chemotherapy using different chemotherapy regimens; thus, the included population was heterogeneous. Furthermore, currently combinations of cytotoxic treatment with antiangiogenic treatment are standard in first-line treatment. DCE-MRI may have a role as a tool for response evaluation in those patients who are being treated with antiangiogenics. Previous chemotherapy might already have influenced both metabolism and vascularity. However, subgroup analysis of the 9 patients treated with first-line chemotherapy did not change our conclusions.
Only a selection of lesions could be analyzed because of the limited FOV of the acquired images and the limited spatial resolution of (especially) the PET system, which might have caused some bias during selection.
The parameters for vascularity as derived from DCE-MRI were not verified by histologic quantification of microvessel density, because biopsies of stage IV patients are taken only in exceptional circumstances. However, we have previously described a relationship between both histology and DCE-MRI parameters (15). An advantage of DCE-MRI over histology is that DCE-MRI measures functional vasculature only, whereas the quantification of histologic staining of endothelial cells also includes nonperfused vessels.
CONCLUSION
Dynamic Gd-DTPA–enhanced MRI parameters of tumor vasculature showed no relationship to tumor metabolic response on dynamic 18F-FDG PET or to patient survival during cytotoxic chemotherapy either before or during treatment. Therefore, a decrease in metabolic activity and an increase in OS and PFS during chemotherapy cannot be attributed to changes in tumor vascularity, resulting in the altered delivery of drugs or nutrients of the same size as Gd-DTPA. The present study underlines the potential of 18F-FDG PET for response monitoring. The main conclusions of the article are valid for patients not receiving vascular-targeted therapy, and further study is required in the subset of patients who do receive additional antiangiogenic agents.
Acknowledgments
This study was presented at the 56th annual meeting of the Society of Nuclear Medicine, Toronto, Ontario, Canada, June 15, 2009.
Footnotes
-
COPYRIGHT © 2009 by the Society of Nuclear Medicine, Inc.
References
- Received for publication April 1, 2009.
- Accepted for publication August 17, 2009.


Jump to section
Related Articles
Cited By...
- No citing articles found.