


Abstract
Molecular imaging of tumor metabolism has gained considerable interest, since preclinical studies have indicated a close relationship between the activation of various oncogenes and alterations of cellular metabolism. Furthermore, several clinical trials have shown that metabolic imaging can significantly impact patient management by improving tumor staging, restaging, radiation treatment planning, and monitoring of tumor response to therapy. In this review, we summarize recent data on the molecular mechanisms underlying the increased metabolic activity of cancer cells and discuss imaging techniques for studies of tumor glucose, lipid, and amino acid metabolism.
Imaging of tumor cell metabolism has been remarkably successful in recent years. Numerous studies have demonstrated that malignant tumors can be detected with high sensitivity and specificity by imaging their increased metabolic rates for glucose, amino acids, or lipids. PET with the glucose analog 18F-FDG has become a routine clinical test for staging and restaging of malignant lymphoma (1) and most solid tumors (2), 11C-choline and 18F-fluorocholine are used at many European centers for detection of recurrent prostate cancer (3), and various radiolabeled amino acids have been shown to be clinically useful for brain tumor imaging (4,5). This success of metabolic imaging is perhaps unexpected, since the metabolic pathways targeted by these imaging probes are present in virtually all cells in the human body. Therefore, one would have predicted tumor cell metabolism imaging to provide an unspecific signal of limited use in clinical oncology. However, recent studies have revealed that oncogenic signaling and tumor cell metabolism are closely interrelated. For example, malignant transformation by various oncogenes or loss of tumor suppressor genes has been shown to result in quantitative and qualitative alterations of glucose metabolism (6,7). Conversely, genes involved in mitochondrial metabolism have been found to also function as tumor suppressor genes (8). In addition, the tumor environment causes specific adaptations of cellular metabolism that increase the uptake of metabolic substrates (9).
Several modalities can be used in humans for tumor cell metabolism imaging, including SPECT, PET, and magnetic resonance spectroscopy (MRS). Metabolic imaging is increasingly combined with CT and MRI for precise anatomic localization (3,10,11). These multimodality imaging approaches are now becoming the standard for staging and restaging of cancer patients and for evaluation and prediction of treatment response and may contribute to determining the prognosis of patients.
In contrast to other molecular imaging probes, such as receptor ligands, metabolic imaging probes do not target the expression of one molecule but provide information about the integrated function of multiple transporters and enzymes involved in a metabolic process. Thus, metabolic imaging provides unique data about the functional state of the tumor tissue that generally cannot be derived by gene expression profiles or immunohistochemistry. In this review we discuss the use of imaging to study glucose, lipid, and amino acid metabolism of cancer cells. We summarize current data on the link between malignant transformation and increased activity of these metabolic processes, describe techniques for imaging these processes noninvasively, and provide a brief overview on current clinical applications.
TUMOR GLUCOSE METABOLISM
Molecular Mechanisms Underlying Increased Glucose Use of Cancer Cells
The best-known alteration of energy metabolism in cancer cells is increased glycolysis. In normal mammalian cells, glycolysis is inhibited by the presence of oxygen, which allows mitochondria to oxidize pyruvate to CO2 and H2O. This inhibition of glycolysis is termed the Pasteur effect, after Louis Pasteur, who first demonstrated that glucose flux was reduced by the presence of oxygen (12). Conversion of glucose to lactic acid in the presence of oxygen is known as aerobic glycolysis and was reported by Otto Warburg at the beginning of the 20th century as a specific metabolic abnormality of cancer cells (13). Warburg even hypothesized that cancer results from a defect of mitochondrial metabolism that leads to aerobic glycolysis (13). In some tumor cell lines, however, the total contribution of glycolysis to ATP production reaches only about 15% (14). Furthermore, human and rodent glioma cells have been shown to exhibit high or moderate susceptibility to inhibitors of oxidative phosphorylation (15), and glioma cells with a glycolytic phenotype oxidize pyruvate and glutamine when glucose levels are low (15). These experimental data show that a mitochondrial defect is not a necessary prerequisite for cancer development and in a strict sense disprove Warburg's hypothesis.
Nevertheless, glucose transporters and glycolytic enzymes have frequently been found to be overexpressed in malignant tumors (6,7,16). In addition, various posttranslational mechanisms are causing increased glycolytic activity of cancer cells. These include translocation of hexokinase to the mitochondrial membrane resulting in increased enzymatic activity as well as increased concentrations of fructose-2,6,-biphosphonate (F2,6,BP), an allosteric activator of glycolysis (6,7,17). In addition to these experimental data, 18F-FDG PET of millions of oncology patients has unequivocally shown that most primary and metastatic human cancers show significantly increased glucose use.
As pointed out recently by Gatenby and Gillies (9), enhanced glycolysis seems at odds with an evolutionary model of carcinogenesis, because energy production by glycolysis is relatively inefficient. Glycolysis produces only 2 ATPs per glucose, whereas complete oxidation produces about 30 ATPs per glucose (18). Second, accelerated glycolysis causes potentially toxic acidification of the extracellular space. It is therefore not intuitive why malignant tumors generally demonstrate a metabolic phenotype that is more than 10 times less efficient than the one of normal cells.
In order to explain this apparent paradox, it has been proposed that the increase in glycolytic flux is a metabolic strategy of tumor cells to ensure survival and growth in environments with low oxygen concentrations. In this model, increased glycolysis represents a response to growth constraints during carcinogenesis. Studies have shown that growth of premalignant neoplastic cells is eventually limited by substrate availability, and the first substrate limitation encountered by neoplastic cells appears to be low or fluctuating oxygen concentrations (9,19). Upregulation of glycolysis is an adaptation to hypoxia, but it has significant negative consequences because it also causes a decrease in local extracellular pH due to increased lactate production. Prolonged exposure of normal cells to an acidic microenvironment typically results in necrosis or apoptosis through p53- and caspase-3-dependent mechanisms (9). Consequently, upregulation of glycolysis requires additional adaptation through resistance to apoptosis or upregulation of membrane transporters to maintain normal intracellular pH. Together, these changes result in a malignant phenotype and facilitate local invasion and metastasis formation (9).
In an alternative model, increased glycolysis is caused by genetic alterations that lead to uncontrolled activity of oncogenes. Several important oncogenes involved in the development and progression of common human cancers have been found to be also involved in regulation of glycolysis. For example, unregulated activity of the serine-threonine kinase Akt has been shown to increase glucose uptake of tumor cells as well as increase resistance to apoptosis (20–22). The oncogene c-myc, a transcription factor, directly binds numerous glycolytic genes (hexokinase 2, enolase, and lactate dehydrogenase A) and activates their expression (7,23). Oncogenic ras has been shown to increase the concentration of fructose-2,6,-bisphosphate (F2,6BP). F2,6BP is an allosteric activator of phosphofructo1-kinase, which catalyzes the phosphorylation of fructose-6-phosphate to fructose-1,6-bisphosphate (24). This reaction is an important regulator of glycolytic flux in mammalian cells (25). Conversely, the tumor suppressor gene p53 has been found to directly transactivate the expression of the protein “Synthesis of Cytochrome Oxidase 2” (SCO2) (26). SCO2 is critical for regulating the cytochrome c oxidase (COX) complex, the major site of oxygen use in the eukaryotic cell. Loss of SCO2 function is associated with decreased oxidative phosphorylation (26). In vitro and clinical studies have shown that cancer cells with loss of p53 function demonstrate higher uptake rates of 18F-FDG (27,28). These data suggest that activation of oncogenes or loss of tumor suppressor genes rather than the tumor environment may be the primary mechanism for the increased glycolytic activity of cancer cells.
Finally, 2 mitochondrial enzymes involved in the Krebs cycle have recently been shown to be involved in tumorigenesis. Mutations of succinate dehydrogenase (SDH) and fumarate hydratase (FH) gene are associated with the development of pheochromocytomas, leiomyomas, leiomyosarcoma, and renal cell carcinoma (8,29,30). Thus, for some tumors Warburg's original hypothesis—mitochondrial dysfunction as a cause of tumor development—has actually been confirmed by recent data. The mechanisms for tumorigenesis in cells with SDH or FH mutations are not fully elucidated, but formation of reactive oxygen species (ROS) in the defective mitochondria and stabilization of Hif1-α by excess succinate have been implicated.
These 3 models for the relationship between tumor development and glucose metabolism are not mutually exclusive. In fact, all 3 models result in the activation of the same effector mechanism, the stabilization of the transcription factor Hif-1 (hypoxia inducible factor 1) (31,32). Hif-1 activates the transcription of glycolytic genes (33) as well as of genes involved in cell proliferation and metastasis formation (31). HIF-1 also favors the glycolytic flux by increasing the expression of pyruvate dehydrogenase (PDH) kinase 1 (34). PDH kinase inhibits, by phosphorylation, PDH activity, thus decreasing formation of acetyl coenzyme A (acetyl-CoA) (which enters the Krebs cycle) and increasing the generation of lactate from pyruvate (34). HIF-1 is constituted by 2 subunits, HIF-1α and HIF-1β. Expression of HIF-1α is regulated by the phosphatidylinositol-3-kinase (PI3K) and mitogen-activated protein kinase (MAPK) pathways (31). These pathways are frequently deregulated in cancer cells and are activated by various growth factor receptors (21,35–37). Under regular oxygen tension, HIF-1α is hydroxylated (31). Hydroxylated HIF-1α interacts with the VHL (von Hippel Lindau) protein. VHL is the recognition component of a ubiquitin-protein ligase that targets HIF-1α for proteosomal degradation. During hypoxia, however, HIF-1α accumulates, since hydroxylation is oxygen-dependent (31). Thus, increased production of HIF-1α, induced by oncogenes, as well as HIF-1α stabilization during hypoxia may contribute to the glycolytic phenotype of cancer cells.
Imaging Techniques
18F-FDG PET is by far the most commonly used imaging technique to study glucose metabolism of cancer cells in-vivo. After intravenous injection, 18F-FDG is transported across the cell membrane by sodium-independent, facilitative glucose transporters (Gluts) (Fig. 1). These transporters allow energy-independent transport of glucose across the cell membrane down a concentration gradient (16). Thirteen members of the mammalian facilitative glucose transporter family have been identified. The genes belong to the solute carrier 2A family (SLC2A) (16). In malignant tumors Glut-1 is frequently overexpressed, but expression of Glut-3 and more recently Glut-12 has also been reported in some tumors types (16).

Simplified overview of metabolic processes targeted by PET and MRI. AA pool = amino acid pool; ChoK = choline kinase; FAS = fatty acid synthase; FR-1,6-BP = fructose-1,6-bisphosphate; G-6-P = glucose-6-phosphate; LAT = L-type amino acid transporter; LDH = lactate dehydrogenase; P-choline = phosphocholine; Ribose 5P = ribose-5-phosphate.
Unlike glucose, 18F-FDG is not a substrate for the sodium-dependent glucose transporters found in the tubulus system of the kidneys. As a consequence, 18F-FDG is not reabsorbed after glomerular filtration but excreted with the urine. This contributes to the rapid clearance of 18F-FDG from the bloodstream, which is important for imaging metabolically active tissues with high contrast. Intracellularly, 18F-FDG and glucose are phosphorylated by hexokinase to glucose-6-phosphate and 18F-FDG-6 phosphate, respectively. Glucose-6-phosphate is then further metabolized to fructose-1,6-biphosphate and enters glycolysis. Alternatively, glucose-6-phosphate enters the pentose phosphate pathway and is eventually converted to ribose-5-phosphate, which can serve as a building block for DNA and RNA synthesis. In contrast to this complex metabolic fate of glucose-6-phosphate, 18F-FDG-6-phosphate cannot be further metabolized in the glycolytic pathway because the fluorine atom at the C2 position prevents 18F-FDG-6P from further degradation. Furthermore, tumor cells generally demonstrate a very low or absent activity of glucose-6-phosphatase, which catalyses the dephosphorylation of glucose-6-phosphate and 18F-FDG-6-phosphate. As the cell membrane is impermeable for phosphorylated 18F-FDG, 18F-FDG-6 phosphate becomes trapped and steadily accumulates in metabolically active cells.
Although 18F-FDG undergoes only the first 2 steps of glucose metabolism (transport and phosphorylation by hexokinase), it is important to note that 18F-FDG flux nevertheless reflects exogenous glucose use of cancer cells, as long as patients are imaged at steady-state conditions. At steady-state conditions, the concentrations of the various metabolites produced during glycolysis are constant and the net glucose flux across the cell membrane equals total exogenous glucose use. Consequently, 18F-FDG uptake rates are dependent not only on the activity of glucose transporters and hexokinase but also on the activity of downstream molecules (24).
Technetium labeled glucose analogs have also been evaluated for imaging of tumor glucose metabolism. In these compounds, a chelator for technetium is bound to the 2 position of D-glucosamine. Technetium-labeled glucosamines have been shown to accumulate in murine tumor models. However, brain uptake of the compounds was low, raising questions on whether these imaging probes target cellular glucose metabolism or some other metabolic process in the tumor tissue (38–40).
D-glucosamines have also been labeled with fluorescent probes for optical imaging. 2-NDBG (2-[N-(7-nitrobenz-2-oxa-1,3-diazol-4-yl)amino]-2-deoxy-d-glucose) has been shown to be transported by GLUTs (41). Fluorescence microscopy with 2-NDBG is being used to study glucose uptake in vitro (42). However, the short emission wavelength of 2-NDBG limits its use for in vivo imaging (41,43). To overcome this limitation, D-glucosamine has been labeled with the near-infrared (NIR) fluorescent dye Cy5.5 (43). However, this compound was no longer transported by GLUTs, probably because of the relatively large size of the Cy5.5. molecule (molecular weight of Cy5.5, 1,128 g/mol as compared with 180 g/mol for glucose).
MR spectroscopy (MRS) with 13C has been extensively used to study cellular glucose metabolism ex vivo. In contrast to scintigraphic techniques MRS allows one to trace the fate of the 13C label through glycolysis and the TCA cycle. 13C MRS has been used to study whole-brain glucose uptake in humans after infusion of several grams of 13C glucose (44). The limited sensitivity and resulting poor spatial resolution have, however, so far precluded the use of this technique to study glucose metabolism of human tumors. The MRI signal can be increased more than 10,000-fold by hyperpolarization (45,46). This higher signal allows high-resolution images of the distribution of hyperpolarized 13C-labeled molecules within the tumor tissue in animal models (47). However, the hyperpolarization decays rapidly with a T1 of 40 s. As a consequence, imaging needs to be performed within a few minutes after injection of 13C-labeled compounds (48). Hyperpolarized 13C-pyruvate has recently been used in an animal model to study noninvasively the activity of lactate dehydrogenase (49). Mice bearing subcutaneous EL-4 tumors were injected with 75 mM of hyperpolarized 13C-pyruvate and imaged for 2 min in a 9.4-T system. MRI spectra of the tumors showed within 12 s the accumulation of pyruvate in the tumor and the formation of lactate. Flux of pyruvate to lactate was inhibited by chemotherapy within 24 h after treatment with etoposide (49).
A decrease in lactate levels in response to chemo- or radiotherapy has also been observed by 1H-MRS measurements. An advantage of lactate 1H MRS is that no imaging probe needs to be injected, since endogenous lactate levels are measured. In mice bearing RIF-1 sarcomas, lactate levels as assessed by a lactate-to-water ratio decreased by more than 60% within 24 h after administration of a single dose of cyclophosphamide (50). A rapid reduction of lactate levels has also been observed in murine tumor models after chemotherapy with 5-fluorouracil and radiation treatment (51,52). However, it is currently not known whether lactate spectroscopy has sufficient sensitivity to detect tumor response to therapy in the clinic (53).
Clinical Applications
Within the past 10 y, 18F-FDG PET/CT has become a routine clinical test for staging and restaging of a variety of malignant tumors, including lymphoma, melanoma, non–small cell lung cancer, esophageal cancer, and colorectal cancer. It goes far beyond the scope of this article to discuss the various applications of 18F-FDG PET/CT for cancer staging and restaging, and the reader is referred to recent reviews (3,54–57). 18F-FDG PET/CT is also increasingly used for monitoring tumor response to therapy. In the recently revised international response criteria (1) for malignant lymphoma, 18F-FDG PET plays a central role for assessing tumor response after completion of therapy. In 18F-FDG–avid lymphomas, such as Hodgkin's disease or diffuse B-cell lymphoma, even patients with large residual masses are considered to be complete responders, as long as the masses do not show focally increased 18F-FDG uptake (1). The new response criteria require 18F-FDG PET to be used for response assessment in 18F-FDG–avid lymphomas, such as diffuse large B-cell lymphoma and Hodgkin's disease. In other lymphoma subtypes, 18F-FDG PET is recommended if tumor response is the endpoint of a clinical trial (1).
In patients with Hodgkin's disease and aggressive non-Hodgkin's lymphoma, 18F-FDG PET has also shown very promising results for assessing tumor response early in the course of therapy. In a European multicenter study (58), 260 patients with Hodgkin's lymphoma were studied by 18F-FDG PET before and after 2 cycles of chemotherapy. The 2-y progression-free survival for patients with positive PET results after 2 cycles of chemotherapy was 13%, whereas it was 95.0% for patients with a negative PET scan (P < 0.0001). In a univariate analysis, the treatment outcome was significantly associated with PET response after 2 cycles of chemotherapy (P < 0.0001) and various well-known clinical prognostic factors such as stage and the international prognostic score (IPS). In multivariate analyses, however, only positive PET results after 2 cycles of chemotherapy turned out to be significantly correlated with patient survival (P < 0.0001). These data indicate that tumor response in 18F-FDG PET after 2 cycles of chemotherapy is a stronger predictor of patient outcome than the IPS and other well-established clinical prognostic factors. Thus, 18F-FDG PET appears to be the single most important tool for risk-adapted treatment in Hodgkin's lymphoma (58). Several single-center studies have also indicated that tumor response after 2 cycles of chemotherapy is highly predictive for patient outcome in patients with Hodgkin's disease (54). The ability to predict tumor response early in the course of therapy offers the opportunity to intensify treatment in patients who are unlikely to respond to first-line chemotherapy. Conversely, treatment could be shortened in patients who show a favorable response after 2 cycles of chemotherapy. This is of particular interest in Hodgkin's lymphoma, since chemotherapy combined with radiotherapy can cure most of the patients but also puts them at increased risk for secondary malignancies and other serious long-term complications, such as infertility and cardiopulmonary toxicity (59).
Risk-adapted treatment of Hodgkin's lymphoma has recently been evaluated in a phase II study by Dann et al. (60). These investigators used 18F-FDG PET/CT to adjust treatment after 2 cycles of chemotherapy (60). The survival data of this study suggest that a risk-adapted treatment of Hodgkin's disease using response to chemotherapy, as reflected by early interim 18F-FDG PET/CT, is feasible and may decrease the cumulative dose of potentially toxic and leukemogenic chemotherapy without affecting efficacy (60). Randomized trials comparing risk-adapted, PET/CT-guided therapy with standard chemotherapy in Hodgkin's lymphoma are ongoing (H10 EORTC/GELA and HD18).
In several single-center studies, early response to therapy was also a strong predictor of outcome in patients with aggressive non-Hodgkin's lymphoma (54). In a recent study by Haioun et al. (61) including 90 patients the event-free survival of patients with a negative PET scan after 2 cycles of chemotherapy was 84% as compared with 43% for patients with a positive PET scan (P < 0.001). As in Hodgkin's disease (58), the prognostic impact of “early PET” on event-free survival was observed both among patients with low-risk disease, indicated by an IPI (international prognostic index) of 1 or 2 (P = 0.01), and among those with high-risk disease (n = 53), indicated by an IPI score of 3, 4, or 5 (P = 0.004).
18F-FDG PET has also been evaluated for monitoring response to therapy in a variety of solid tumors (62). The majority of studies have been performed in patients undergoing neoadjuvant (preoperative) chemo- or chemoradiotherapy (62). This allowed investigators to correlate tumor 18F-FDG uptake after therapy or changes in 18F-FDG uptake during therapy with histopathologic measures of tumor response. Numerous studies in lung, esophageal, and rectal cancer have now shown that focal residual 18F-FDG uptake after preoperative chemotherapy is a specific marker for macroscopic viable tumor tissue (62). Furthermore, the level of tumor 18F-FDG uptake after therapy significantly correlated with the percentage of treatment-induced necrosis and fibrosis. However, microscopic residual disease cannot be excluded by 18F-FDG PET. For example, a study by Swisher et al. found in a group of 68 patients with esophageal cancer that 18F-FDG uptake in the tumor bed was not significantly different for patients with complete histopathologic tumor regression and patients with up to 50% viable tumor cells (63). Similarly, Tan et al. observed viable tumor cells in 85% of liver metastases of colorectal cancer that were treated by preoperative chemotherapy and showed no focal 18F-FDG uptake after completion of therapy (64).
Focal 18F-FDG uptake after chemo- or radiotherapy has been shown to be a strong prognostic factor. In one of the largest prospective studies published so far, Schwarz et al. (65) prospectively performed 18F-FDG PET in 92 patients with cervical cancer treated by chemoradiotherapy. Posttherapy 18F-FDG PET (2–4 mo after completion of therapy) showed a complete metabolic response in 65 patients (70%), a partial metabolic response in 15 (16%), and progressive disease in 12 (13%). The 3-y progression-free survival rates of these patient subgroups were 78%, 33%, and 0%, respectively (P < 0.001) (65).
Changes in tumor glucose use have been shown to be more accurate than size changes for assessment of histopathologic tumor response. For example, in a study including 42 patients with soft-tissue sarcomas treated by preoperative chemo- or chemoradiotherapy followed by surgical resection, 8 patients were classified as histopathologic responders (66). In these patients, tumor 18F-FDG uptake had been reduced on average by 75%, whereas 18F-FDG uptake in histopathologic nonresponders decreased by only 34% (P < 0.001). In contrast, there were only minimal changes in tumor size after preoperative therapy. The maximum tumor diameter decreased on average by 8% in responders and 2% in histopathologic nonresponders (P = 0.24).
Several studies have indicated that measurements of changes in tumor SUVs during chemotherapy allow prediction of subsequent reduction of the tumor mass as well as of survival in non–small cell lung cancer (67–69), mesothelioma (70), esophageal cancer (71), breast cancer (72), gastric cancer (73), and rectal cancer (74). In these studies 18F-FDG PET generally had a high negative predictive value for response, and patients who did not show a significant decrease in 18F-FDG uptake early in the course of treatment were unlikely to benefit from continued therapy. Early identification of nonresponding patients is of great clinical importance since frequently only a subgroup of the treated patients benefits from chemotherapy.
The MUNICON trial (75) has recently shown that quantitative measurements of tumor 18F-FDG uptake can be used to individualize neoadjuvant therapy. This trial included 110 patients with locally advanced adenocarcinomas of the esophagogastric junction scheduled to undergo preoperative chemotherapy followed by surgical resection. 18F-FDG PET was performed before therapy and after a short, 2-wk course of cisplatinum-based chemotherapy. If tumor 18F-FDG uptake had decreased by more than 35% at the time of the second PET scan, patients underwent the full, 3-mo course of chemotherapy. Otherwise, the patients underwent immediate tumor resection. This study design was based on previous studies, which had demonstrated that a decrease of tumor 18F-FDG uptake by less than 35% is associated with a histopathologic response rate of only 5% (71,76) (metabolic nonresponders), whereas the histopathologic response rate was 44% in metabolic responders (decrease of tumor 18F-FDG uptake by at least 35%). Consistent with these previous data, the histopathologic response rate in the MUNICON trial was 58%, thus confirming the feasibility of a PET-guided treatment algorithm (75).
For chemo- and radiotherapy there is considerable evidence that reduction of 18F-FDG uptake is caused by a loss of viable tumor cells. However, the close relationship between various oncogenic signaling pathways and tumor glucose metabolisms suggests that drugs targeting these signal transduction pathways may have a more direct effect on cellular glucose metabolism. In patients with gastrointestinal stromal tumors (GIST), 18F-FDG uptake decreases within hours after treatment with the c-kit inhibitor imatinib (77,78). Experimental studies have suggested that this rapid reduction of glucose metabolic activity does not reflect cell death but a translocation of glucose transporters from the plasma membrane to the cytosol (79). Changes in glycolysis preceded changes in tumor size by many weeks and were essential for documenting the activity of imatinib in GIST in clinical trials. Current studies are now using 18F-FDG PET to monitor development of resistance to imatinib and to assess the efficacy of salvage therapy with second-generation targeted inhibitors of the mutated c-KIT receptor present in this subset of GIST tumors.
Marked changes in tumor glycolysis might also occur in response to other protein kinase inhibitors. Inhibition of EGFR kinase with gefitinib has been shown to result within 4 h in glucose transporter translocation in lung cancer cell lines with activating mutations of the EGFR kinase domain. These metabolic alterations paralleled inhibition of Akt activity in sensitive cell lines and preceded changes in cell-cycle distribution, thymidine uptake, and apoptosis, thus suggesting that changes in glycolysis are both an early and a sensitive marker of treatment response. These observations were then confirmed in small-animal PET studies that detected up to a 55% decrease for 18F-FDG uptake in gefitinib-sensitive xenografts within 48 h after the start of treatment. Rapid changes in 18F-FDG uptake were also observed in a small pilot study of patients with non–small cell lung cancer treated with gefitinib (80).
The mTOR inhibitor rapamycin has also been found to cause rapid changes in tumor cell glucose metabolism. The protein kinase mTOR has been shown to regulate proliferation, but also glucose metabolic activity in response to activation of Akt and Hif-1. mTOR inhibition by rapamycin and rapamycin analogs is currently being evaluated for treatment of a variety of malignancies (81). In sensitive cell lines, rapamycin therapy decreased 18F-FDG uptake by up to 65% within 24 h after the start of therapy. This was associated with inhibition of hexokinase activity. The effects of rapamycin on tumor glucose metabolism could be imaged noninvasively by PET (Fig. 2). In sensitive tumors, 18F-FDG uptake decreased within 48 h by 56% ± 6%, whereas 18F-FDG uptake of rapamycin-resistant tumors did not decrease after therapy (82).
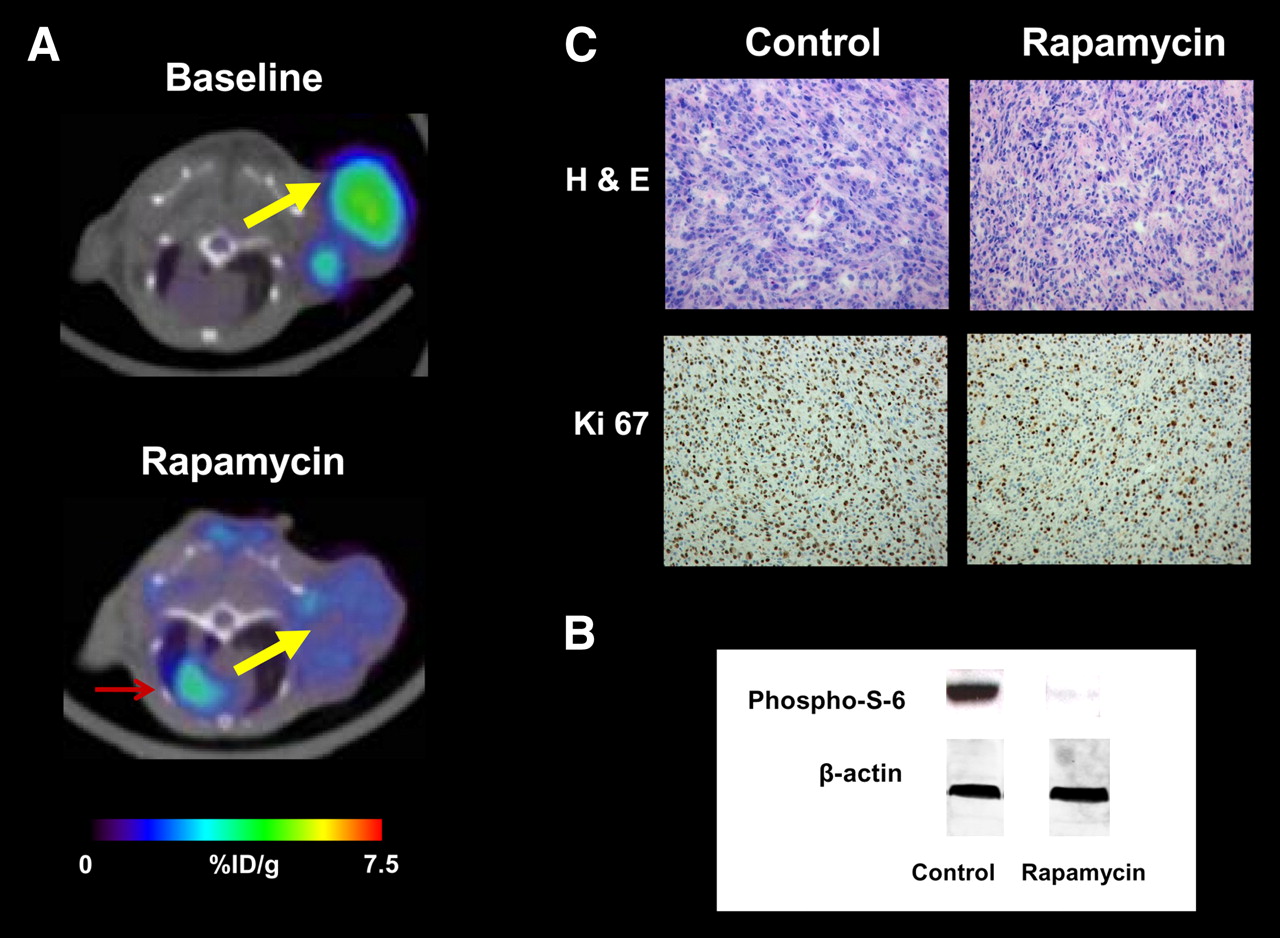
Monitoring mTOR inhibition by rapamycin with 18F-FDG PET. (A) 18F-FDG PET/CT images of tumor-bearing mice before (baseline) (top) and after 48 h of rapamycin therapy (bottom). Yellow arrow indicates U87 tumor xenograft; red arrow indicates myocardium. There was marked reduction of tumor 18F-FDG uptake after therapy. (B) Western blots of tumor tissue from rapamycin-treated or vehicle-treated mice showed loss of phospho-S-6, a marker of mTOR activity. β-actin served as loading control. (C) Hematoxylin–eosin (H & E) staining of tumor tissue showed no signs of treatment-induced necrosis. Staining for proliferation marker Ki67 demonstrated reduction in cellular proliferation with rapamycin therapy. %ID/g = percentage injected dose per gram.
TUMOR LIPID METABOLISM
In addition to increased glycolytic activity, several alterations of lipid metabolism are often found in cancer cells, including overexpression of fatty acid synthase (FAS) and overexpression of choline kinase (ChoK). FAS catalyzes the de novo synthesis of fatty acids from acetyl-CoA, malonyl-CoA, and nicotinamide adenine dinucleotide phosphate (NADPH) (83). In the liver and adipose tissue, FAS serves to store energy derived from carbohydrate metabolism as triglycerides. In contrast, human cancer cells do not store significant amounts of triglycerides but esterify fatty acids to phospholipids, such as phophatidylcholine (83). As shown in Figure 3, fatty acids are activated to acyl-CoA and in a 2-step reaction form diacylglycerides with glycerol 3-phosphate. These diacylglycerides then react with CDP-choline to form phosphatidylcholine (Fig. 3).
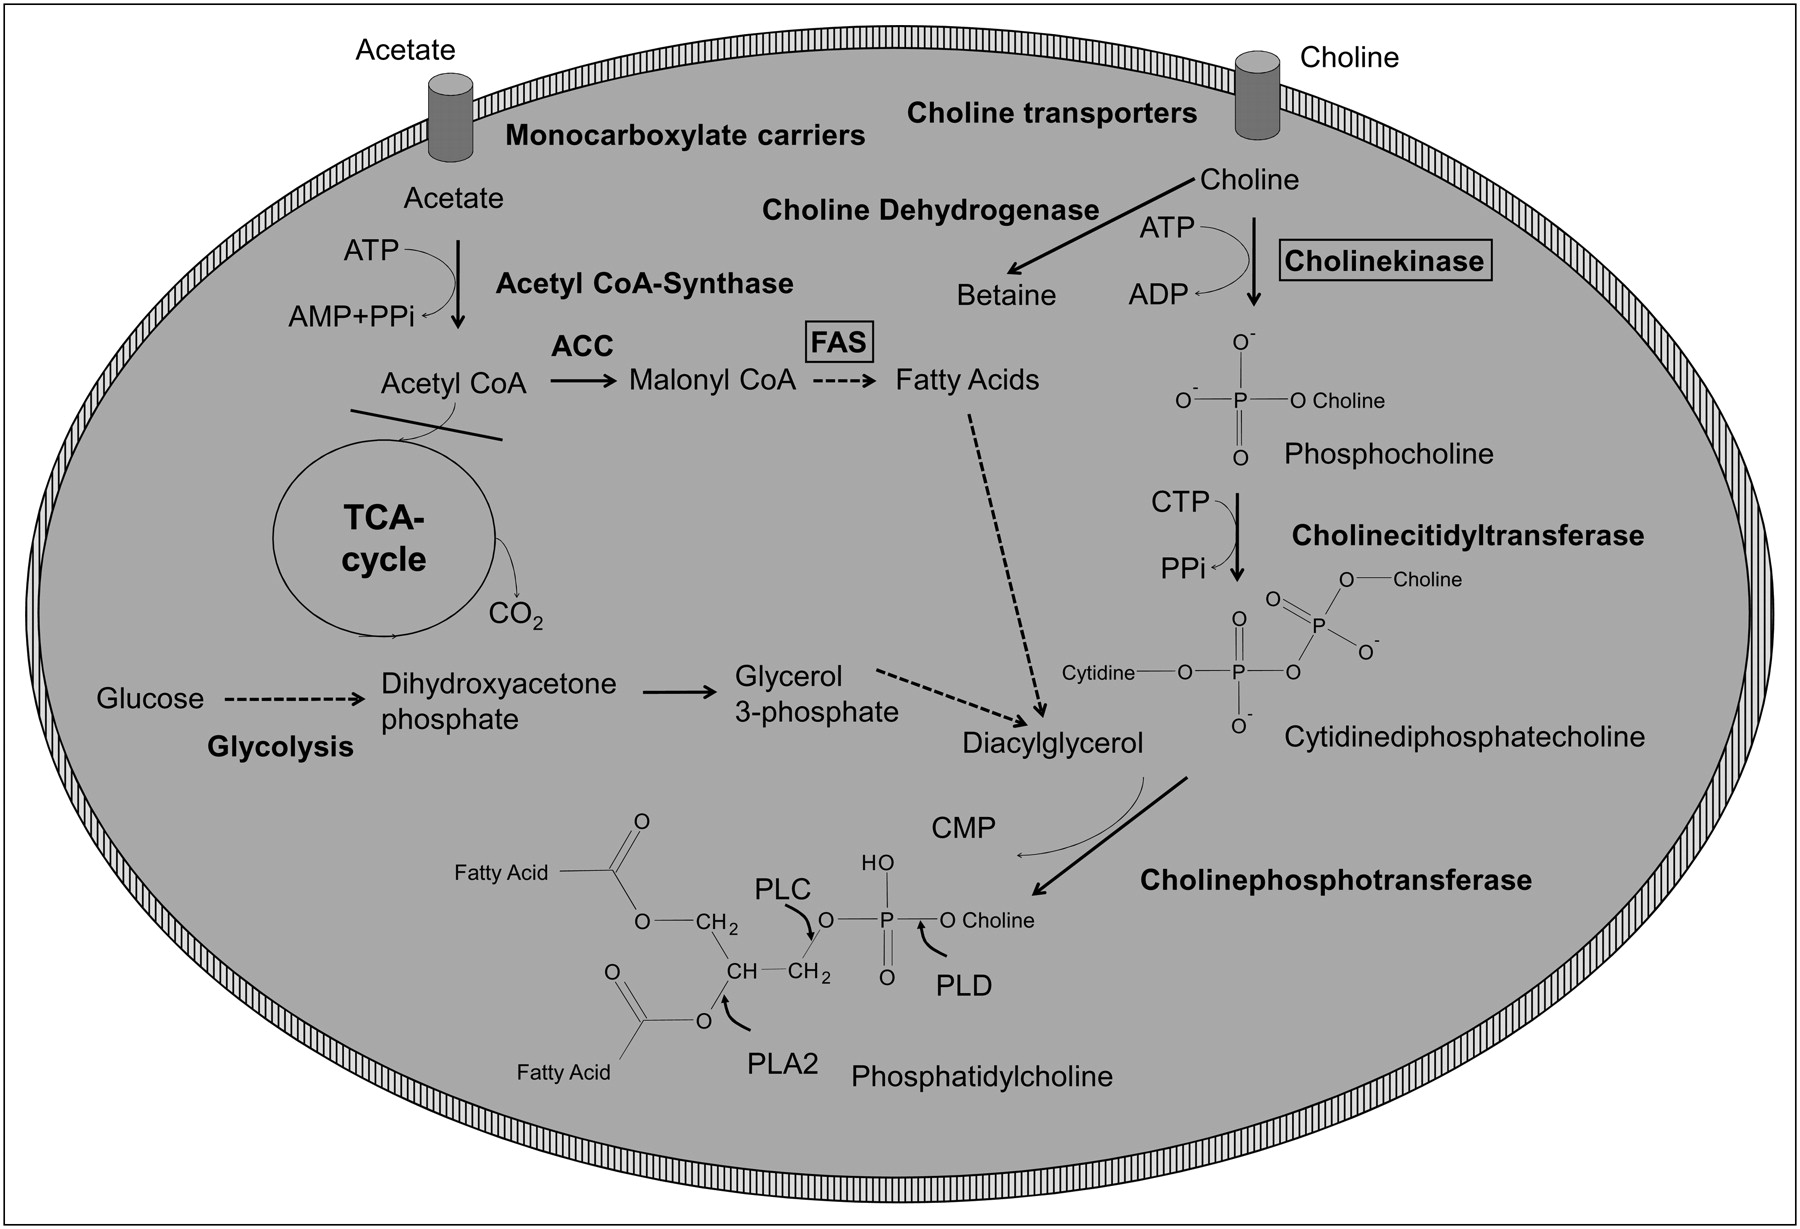
Simplified overview of tumor lipid metabolism. ACC = acetyl-CoA carboxylase; CDP = cytidine diphosphate; CMP = cytidine monophosphate; CTP = cytidine triphosphate; FAS = fatty acid synthase; PLA2 = phospholipase A2; PLC = phospholipase C; PLD = phospholipase D; PPi = diphosphate.
Overexpression of FAS has been observed in many human cancers including among others breast, prostate, lung, and colorectal cancer (84), and high levels were associated with a poor prognosis (84).
Experimental studies have indicated that various oncogenic signaling pathways lead to increased FAS expression. In prostate cancer cells with loss of the tumor suppressor gene PTEN (phosphatase and tensin homolog deleted on chromosome 10) pharmacologic inhibition of phosphatidylinositol-3-kinase (PI3K) with LY294002 reduced the high levels of FAS expression (85). Reintroduction of PTEN also reduced FAS expression, but subsequent transfection of constitutively active Akt restored FAS expression levels (85). HER2 signaling has also been implicated as a cause of increased FAS expression (86). Conversely, inhibition of FAS in ovarian and breast cancer cell lines has been shown to decrease Akt and HER2 activity (86,87), suggesting that there is a 2-way interaction between FAS and Akt/HER 2 signaling.
FAS inhibition by cerulenin or C75 induces apoptosis in various cancer cell lines. In contrast, treatment of mice with FAS inhibitors decreases adipocyte mass without hepatocellular injury or fat necrosis (83). These observations have generated interest in using FAS inhibitors as anticancer drugs. The mechanisms for apoptosis induced by FAS inhibition are not fully elucidated, but recent experimental data indicate that this apoptosis may be due to accumulation of FAS substrates triggering AMP-activated protein kinase (87).
Many malignant tumors, including lung, colon, breast, ovarian, and prostate cancer, have been shown to overexpress ChoK (88). ChoK phosphorylates free choline to phosphocholine (PCho), which represents the first step of choline metabolism. Catalyzed by choline-cytidyltransferase (CCT), PCho can then react with CTP (cytosine triphosphate) to form cytosine diphosphate-choline (CDP-choline). The phosphorylcholine unit of CDP-choline is then transferred to a diacylglycerol (DAG) by cholinephosphotransferase (CPT) to form phosphatidylcholine (PC), a major constituent of the mammalian cell membrane (88,89).
PC can be metabolized by 3 phospholipases (phospholipases A2, C, and D). These phospholipases hydrolyze different bonds of PC as shown in Figure 3. Phospholipase A2 splits PC into lyso-PC and a free fatty acid (FFA), metabolism by phospholipase C results in PCho and DAG, and phospholipase D generates choline and phosphatidic acid (89). Thus, the intracellular choline levels are determined by both the rate of choline uptake as well as the rate of phosphatidylcholine synthesis and degradation. As a consequence, choline uptake rates as measured with radiolabeled choline do not necessarily correlate with the intracellular choline concentration as measured by MRS (90).
Choline kinase expression has been shown to be associated with certain cell stresses such as polycyclic aromatic hydrocarbon carcinogens or carbon tetrachloride intoxication (91,92). These results indicate that choline kinase is a member of an acute responsive gene family, although the exact role of choline kinase induction as well as of newly generated PCho in various cell stresses are currently not fully understood. PCho has also been shown to act as a second messenger in cell growth signaling (93). Several oncogenes such as ras, src, raf, and mos increase choline kinase activity when expressed in mouse fibroblasts (91). Likewise, transfection of human mammary epithelial cells with the erbB2 oncogene has been reported to cause a significant increase in P-Cho levels (94,95). Choline kinase activity and phosphocholine levels were generally not well correlated with proliferation rates (95,96) suggesting that activation of choline kinase cannot be explained alone with net PC synthesis by proliferating cells.
Imaging Tumor Lipid Metabolism
Magnetic Resonance Spectroscopy (MRS).
Choline and choline metabolites play an important role for clinical MRS. Most of the early work on human tumors was performed using 31P-MRS. In 31P-MRS, phosphocholine and phosphoethanolamine are key components of the phosphomonoester peak, whereas glycerophosphocholine and glycerophosphoethanolamine dominate the phosphodiester peak (89). However, in recent years there has been much interest in the use of proton MRS because of its better sensitivity and, consequently, improved spatial resolution compared with 31P-MRS (97). In proton (1H) MRS, the total choline (tCho) peak is a measure of the concentration of choline, phosphocholine, glycerophosphocholine, betaine, and taurine (89). tCho has been shown to be increased in a variety of malignant tumors, including breast cancer prostate cancer and brain tumors (97).
Two basic techniques are used clinically to obtain localized 1H MR spectra from tumor tissue in vivo: single-voxel methods and magnetic resonance spectroscopic imaging (MRSI, also known as chemical shift imaging). Single-voxel methods acquire data from a single voxel positioned using MRI (98). Typical voxel sizes used in clinical studies range from 4 to 8 cm3 (98). The quality of single-voxel spectra is highly dependent on voxel positioning, since the inclusion of surrounding normal tissues will contaminate the tumor spectra. For similar reasons, single-voxel spectroscopy is limited for assessment of heterogeneous tumors. In MRSI a matrix of spectra (Fig. 4) is acquired either over a plane (2D MRSI) or a volume (3D MRSI). The voxel size in clinical 3D MRSI is 1 cm3 or more when using a standard 1.5-T clinical MRI system (99), and typical matrix sizes are 8 × 8 × 8 voxels (98,100–102). However, the quality of the spectra can be poorer than in single-voxel spectroscopy because of greater magnetic field inhomogeneities in the sampled volume, particularly with regard to achieving adequate water suppression. At higher magnetic field strengths (3 T), voxel sizes and image acquisition times can be reduced. Using high-sensitivity phased-array head coils, MRSI studies of the brain with 0.34-cm3 voxels have been acquired in 9.5 min (103). Spectroscopic images of the prostate with 16 × 16 × 8 voxels and a voxel size of 0.154 cm3 have been generated in 8.5 min (104). Because of physical issues associated with the anatomic location of cancers, proton MRSI cannot be used to image all tumors. Breathing or peristaltic motion and large air–tissue interfaces lead to severe magnetic susceptibility difficulties, which affect the local magnetic field homogeneity, resulting in line broadening and loss of signal. Thus, carcinomas located in the chest, abdomen, and gastrointestinal tract are difficult to assess with MRS (97).
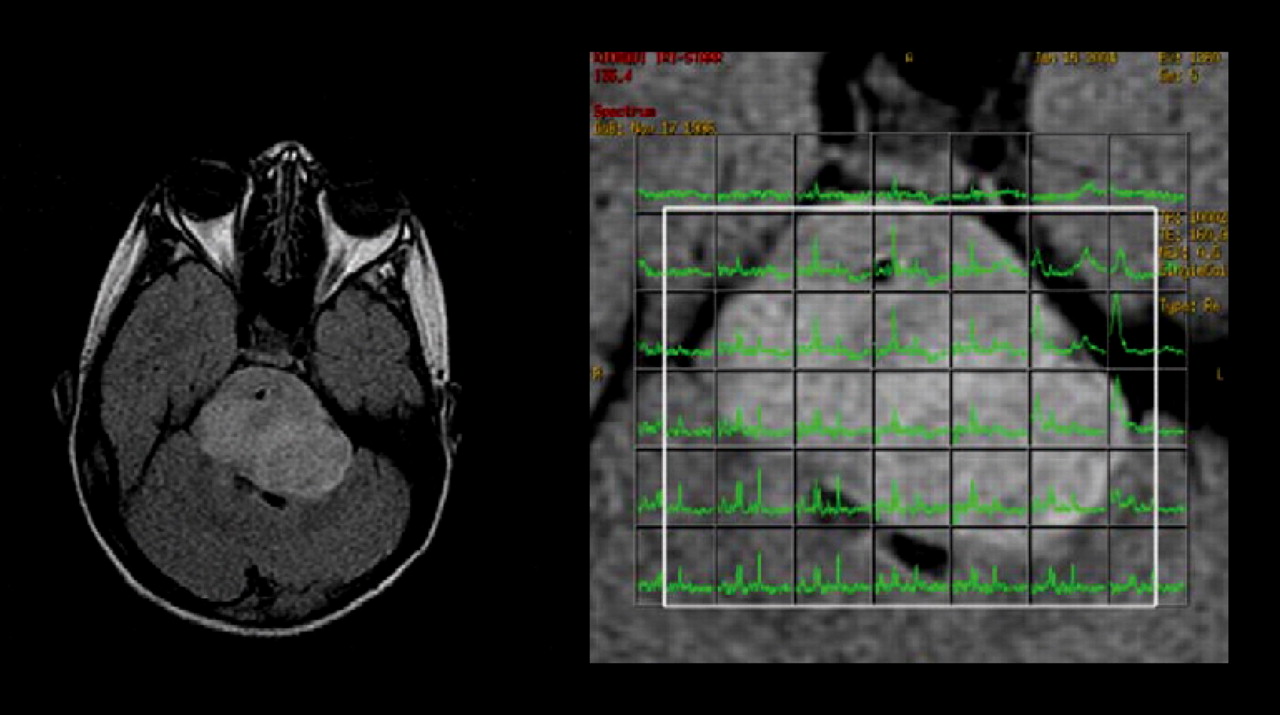
MRI (left) and proton spectroscopy (right) of brain stem glioma. Spectra for tumor voxels (right, green) demonstrated increased choline content of tumor tissue.
A characteristic metabolic abnormality observed with MRS in brain tumors is a reduction of the neuronal marker N-acetyl aspartate (NAA) and total creatine (tCr, creatine and phosphocreatine) and an increase of tCho (102,105). The tCho concentration gradually increases from normal white matter to grade II astrocytomas and to grade III astrocytomas. However, the tCho signal falls in glioblastoma multiforme, probably because of dilution of the signal by necrotic tissue (106). Variations of the tCho signal caused by differences in cellular density can be corrected by normalizing tCho by tCr (106–108). Table 1 summarizes typical MRS findings in brain tumors and other ring-enhancing brain lesions (89,90).
Compared with normal prostate tissue, prostate cancer demonstrates decreased levels of citrate and increased levels of tCho. Production and secretion of citrate is an important function of the human prostate (109). Citrate is synthesized from oxaloacetate (OAA) and acetyl-CoA by citrate synthase. The next step of citrate metabolism in the Krebs cycle is the isomerization of citrate to isocitrate by the enzyme aconitase. However, in the prostate the activity of aconitase is low and consequently citrate accumulates and is eventually secreted (109). Thus, the normal prostate gland is characterized by “aerobic glycoloysis,” since the Krebs cycle and consequently oxidative phosphorylation are inhibited. In prostate cancer, citrate metabolism is shifted to citrate oxidation in the Krebs cycle, and citrate levels in prostate cancer are significantly lower than in normal prostate and benign prostate hyperplasia (110). Consequently, the choline-to-citrate ratio can be used to detect prostate cancer with MRSI and to differentiate prostate cancer from benign prostate hyperplasia (111). Table 2 summarizes reported citrate-to-choline ratios in prostate hyperplasia and prostate cancer in comparison to other metabolite ratios measurable by MRS (112,113).
Choline PET.
Radiolabeled choline (11C-choline) (114) and choline analogs (18F-choline and 18F-fluoroethylcholine) (115,116) have been used to study tumor lipid metabolism by PET. The first step of choline accumulation by tumor cells is transport across the cell membrane by various transporters. Since choline is a polar molecule, uptake by passive diffusion is low. There are 3 known choline transport systems in human cells (117). These systems have initially been classified functionally as low-affinity, high-affinity, and intermediate-affinity transport (117). Low-affinity choline transport is sodium-independent and demonstrates a Km for choline transport of > 100 μM. This form of choline transport appears to be mediated by the polyspecific organic cation transporters OCT1 and OCT1. The major driving force for choline transport via OCT1 and OCT2 is the negative membrane potential. Low-affinity choline transporters are thought to be ubiquitously present and related to phosphatidylcholine synthesis (117). At low concentrations, choline is transported by a high-affinity, sodium-dependent system with a Km for choline transport of about 2 μM (118). The molecule mediating high-affinity choline transport is the CHT1 transporter. CHT1 is primarily expressed in cholinergic neurons and related to acetylcholine synthesis (118). The third transport system is sodium-independent and demonstrates an immediate affinity for choline transport (Km, 20–200 μM) (117). Choline-specific transporter proteins (CTL1–CTL5) apparently mediate intermediate-affinity choline transport. The Km of choline transport in cancer cell lines is most consistent with transport by the intermediate-affinity transport system (119).
Radiolabeled choline and choline analogs are rapidly accumulated in a variety of human cancers, including prostate cancer, gliomas, non–small cell lung cancer, and esophageal cancer. Uptake usually plateaus within 10–20 min after injection (114). Experimental studies have indicated that a large fraction of the intracellular choline still represents nonmetabolized choline (120), suggesting that choline transport and not phosphorylation is the key factor for choline uptake of cancer cells. Consistent with these observations, tumor uptake of the choline derivative 18F-deshydroxycholine that cannot be phosphorylated by choline kinase has been shown to be similar to11C-choline at early time points (10 min after injection) (119). At later time points, however, uptake of 11C-choline was significantly higher than of 18F-deshydroxycholine, indicating that phosphorylation by choline kinase increases intracellular trapping of choline and that choline kinase activity does also affect the in vivo PET signal (119).
Acetate PET.
11C-acetate has been used for several years to study oxidative metabolism of the myocardium (121,122). More recent studies have shown that 11C-acetate is also accumulated by various malignancies, including prostate cancer (123–125). 11C-acetate is transported across the cell membrane by monocarboxylate carriers (MCT). MCTs catalyze facilitative diffusion of monocarboxylates together with a proton. There is no energy input other than that provided by the concentration gradients of lactate and protons (126). Lactate is the monocarboxylate whose transport across the plasma membrane is quantitatively the greatest. In cancer cells, MCTs are essential for the efflux of lactate generated by anaerobic glycolysis. However, MCTs also transport many other monocarboxylates, including, for example, pyruvate, acetoacetate, and acetate (126). In tissues with active oxidative phosphorylation, such as the myocardium or the renal tubulus system, acetate is activated to acetyl-CoA and enters the TCA cycle (Fig. 3). In the TCA cycle, acetate is metabolized to CO2, which is rapidly released from the cell. After intravenous injection, 11C-acetate is thus rapidly taken up by the myocardium, but the activity concentration in the myocardium decreases within minutes as radioactivity is released in the form of 11C-O2. In contrast, 11C-acetate has been shown to steadily accumulate in prostate cancer and other malignant tumors (114,123,127), indicating that the metabolic fate of acetate in cancer cells is fundamentally different. In cancer cells, an anabolic pathway seems to dominate, which uses acetate for synthesis of fatty acids and lipids. In fact, 14C-acetate has been used for many years to quantify fatty acid synthesis in vitro (128). Cell culture and animal studies have also supported that acetate uptake of cancer cells is related to fatty acid synthesis. Pharmacologic inhibition of fatty acid synthase and acetyl-CoA carboxylase significantly decreased radiolabeled acetate uptake of cancer cell lines in vitro and in animal models (128,129). Furthermore, uptake of 11C-acetate by human prostate cancer xenografts correlated with fatty acid synthase expression levels (129). However, even high doses of fatty acid synthase inhibitors did not completely inhibit acetate uptake indicating that other mechanism are also involved in acetate uptake of tumor cells (129).
Clinical Applications
Imaging of tumor lipid metabolism has been used clinically in a variety of malignant tumors, but most of the studies have been performed in prostate cancer, breast cancer, and brain tumors (97). PET with radiolabeled choline has been found to be most useful in prostate cancer, as this tumor is frequently negative on 18F-FDG PET (130). Furthermore, urinary excretion of 11C-choline is markedly lower than that of 18F-FDG, which facilitates evaluation of primary and recurrent tumors in the pelvis (114). Urinary excretion of 18F-choline and 18F-fluoroethylcholine is higher than that of 11C-choline, but at early time points after injection tumor uptake of 18F-fluorocholine can be differentiated from activity in the urinary bladder (131). Choline uptake of prostate cancer has not turned out to be closely correlated with grading and Gleason score (98,132–134). Antihormonal therapy has been shown to decrease choline uptake of newly diagnosed prostate cancer (134). However, in patients with rising PSA levels after radical prostatectomy or radiotherapy, antihormonal therapy does not seem to affect the sensitivity of choline PET (135,136)
Choline is taken up by hyperplastic prostate tissue and by various inflammatory lesions, including chronic and acute prostatitis, which limits the specificity of choline PET for detection and correct localization of cancer foci within the prostate. Compared with histopathologic evaluation of the prostate, a sensitivity of about 60% and a specificity of about 70% have been reported in 2 studies including a total of 67 patients (137,138). The sensitivity of MRSI for detection and localization of prostate cancer has been found to range from 63% to 86%, depending on the criteria used for interpretation (n = 53 patients). Specificity ranged from 49% to 75% (139). In the same study the corresponding sensitivity and specificity of MRI ranged from 77% to 81% and 46% to 61%, respectively (139). The diagnostic accuracy of MRI can be improved by combining MRSI with diffusion-weighted images (101).
Zakian et al. (140) evaluated the ability of MRSI to localize and to biologically characterize prostate cancer. One hundred twenty-three patients with prostate cancer were studied by MRSI before surgery. Twenty-one of these studies were not evaluable because of various technical factors. Furthermore, 8 patients with chronic prostatitis on pathology were excluded from analysis. In the remaining 94 patients, 239 foci of prostate cancer were detected with step-section pathologic analysis. Overall, MRSI detected 135 of the lesions (sensitivity, 56%). MRSI was false-positive at 61 sites. The detection rate of MRSI was dependant on the Gleason score. Sensitivity was 44% for Gleason score 3 + 3 but increased to 90% for Gleason score ≥ 4 + 4 (141). The choline-to-citrate ratio correlated with the Gleason score, but there was considerable overlap between the individual Gleason scores (141).
The earliest and most common indication of recurrent prostate cancer is a rising PSA level (“biochemical failure”). In patients with elevated PSA levels, the key clinical consideration is the differentiation between local and systematic relapse. Local relapse can be treated in curative intent with salvage radiotherapy of the prostate bed, whereas there are only palliative treatment options for patients with systemic recurrence. In addition, the success rate of salvage radiotherapy decreases with rising PSA levels, emphasizing the need for early detection of local recurrence (142). Choline PET/CT has been evaluated by several groups for detection of recurrent prostate cancer (135,136,143–148). Results of recent studies are summarized in Table 3. Overall, reported sensitivities and specificities for detection of prostate cancer vary from 56% to 95% and 40% to 100%, respectively (Table 2). The wide range of the reported diagnostic accuracy of choline PET/CT likely reflects differences in the studied patient populations as well as difference in the imaging procedures and in the applied reference standard. As shown in Table 2, PSA levels at the time of PET/CT varied significantly between the different studies. This indicates that some studies included patients with more advanced disease that may be easier to detect by choline PET. On the other hand, studies using PET/CT have shown a higher diagnostic accuracy than studies using PET alone, since PET/CT allows a better differentiation between physiologic choline uptake in the small bowel and focal uptake in lymph node metastases or locally recurrent prostate cancer (136,146). Finally, studies have used different reference standards (histopathologic evaluation or clinical follow-up). Histopathologic evaluation provides the highest specificity (145), but it may be of limited sensitivity in patients with small-volume disease that can be false-negative on biopsies of the prostate region. Furthermore, biopsies of lymph nodes or distant metastases are generally directed by imaging findings, which results in a verification bias. Other studies used PSA levels during follow-up as a reference standard. However, this reference standard is less specific and may be confounded by the effects of systemic therapy.
Diagnostic Accuracy of Choline PET and PET/CT for Detection of Recurrent Prostate Cancer
Despite these differences and limitations of current studies, choline PET/CT appears to be a clinically useful test to detect local recurrence and to exclude lymph node and distant metastases in patients with rising PSA levels. The sensitivity of choline PET/CT for detection of recurrent prostate cancer decreases with lower PSA levels. In one study, the detection rate of recurrent prostate cancer was 36% for patients with a PSA level of less than 0.1 ng/mL and increased to 73% for patients with a PSA level of more than 3 ng/mL (136). However, even in patients with low PSA levels, choline PET/CT can identify a significant number of patients with lymph node or distant metastases that will not benefit from salvage radiotherapy of the prostate region. In recent studies, 102 patients with PSA levels of less than 2 ng/mL underwent choline PET/CT (Table 4). In these patients, choline PET/CT detected lymph node or distant metastases in 20 cases (19%). Even in patients with PSA levels of less than 1 ng/mL, choline PET/CT detected lymph node and distant metastases in 8 of 55 cases (15%) (Table 1). These findings indicate that choline PET/CT can have a significant impact on patient management, since patients with PSA levels of less than 2 ng/mL are frequently considered as good candidates for salvage radiotherapy of the prostate region (142). Conversely, salvage radiotherapy has been successful in patients with relatively high PSA levels but no evidence for metastatic disease on choline PET/CT. In a study by Reske et al. (147), salvage radiotherapy was successful in 9 of 10 patients with PSA levels of more than 2.0 ng/mL but no metastases on choline PET/CT.
Findings on Choline PET/CT in Patients with Low PSA Levels
Local recurrence of prostate cancer has also been studied by proton MRSI (142). The reported diagnostic accuracy of MRSI is higher than that of choline PET/CT, with a sensitivity of 70%–90% and a specificity of about 80% (112,113,148). Diagnostic accuracy can be further increased by combining MRSI with dynamic contrast-enhanced MRI (112). In a study of 70 patients, combined evaluation of MRSI and dynamic contrast-enhanced MRI yielded a sensitivity and specificity of 86% and 100%, respectively (112). However, only the prostate region can be evaluated by MRSI. In contrast, whole-body PET/CT can detect local recurrences as well as lymph node and distant metastases.
In summary, current data suggest that choline PET/CT and MRSI can detect recurrent prostate cancer at low PSA levels. Thus, metabolic imaging may guide salvage radiotherapy by identifying the exact location of recurrence. Furthermore, metabolic imaging may identify patients with aggressive tumors that will not benefit from salvage radiotherapy, as lymph node and distant metastases can be detected at relatively low PSA levels. However, these encouraging observations in single center and mostly retrospective series need to be confirmed in prospective studies.
Imaging of prostate cancer by acetate PET has been evaluated in a smaller number of clinical studies. Like choline, acetate is generally accumulated by prostate cancer to a higher extent than 18F-FDG (149,150). However, benign prostate hyperplasia also demonstrates increased acetate uptake (124). In patients with elevated serum PSA after prostatectomy or radiotherapy of prostate cancer, acetate PET has been shown in small series to localize the site of recurrence with an accuracy similar to that of choline PET (148,151). Vees et al. studied 20 consecutive patients with recurrent prostate cancer by either acetate PET or choline PET/CT. PSA levels were less than 1 ng/mL in all patients. Acetate PET images were coregistered with separately acquired CT scans. Choline PET was positive in 5 of 10 patients and acetate PET in 6 of 10 patients. A lower sensitivity of acetate PET was observed by Oyama et al. (150), who studied 46 patients with recurrent prostate cancer. Overall, acetate PET was positive in 27 patients. However, only 1 of 24 patients with a serum PSA of less than 5 was positive on acetate PET in this study. These discrepant findings may be related to the fact that Oyama et al. used standalone PET, whereas PET/CT image fusion was used in the study by Vees et al. (148). The importance of correlation with anatomic imaging modalities was underlined by a study by Wachter et al. (152), who studied 50 patients with elevated or increasing serum prostate-specific antigen levels. Fusion of acetate PET images with CT or MRI changed characterization of 14 of 51 equivocal lesions identified on acetate PET (27%). In 20% of the studied patients, acetate PET fused with CT or MRI identified lymph node or distant metastases and thus had a significant impact on patient management (152).
In the area of brain tumor imaging, proton MRS has shown promise for noninvasive tumor grading, tumor delineation, and differentiation between radiation necrosis and tumor recurrence (153,154). In a recent retrospective study evaluating 27 patient with suspected grade II or grade III gliomas, total choline, creatine, and NAA were significantly different between grade II (n = 9) and grade III (n = 17) tumors (154). A choline-to-NAA ratio of more than 0.8 allowed correct identification of all grade III gliomas (154). The addition of MRS to MRI has been shown to increase the accuracy of tumor grading. In a comparative study, 160 patients with primary cerebral gliomas underwent conventional MRI, dynamic contrast-enhanced MRI, and proton MRS (153). The sensitivity and specificity of conventional MRI for differentiation of high-grade from low-grade gliomas was 73% and 65%, respectively. With the combination of dynamic contrast MRI, the Cho-to-Cr and Cho-to-NAA ratio increased the sensitivity for detection of high-grade gliomas to 93%, whereas the specificity remained almost unchanged at 60% (153).
Tumor extension on MRSI has been found to differ significantly from contrast enhancement on conventional MRI, suggesting that MRSI may be helpful for radiation treatment planning (155). Pirzkall et al. (155) studied 30 patients with anaplastic astrocytomas or glioblastoma after surgical resection. Ten of these patients demonstrated no contrast enhancement on conventional MRI, suggesting complete macroscopic tumor resection. However, 8 of these patients demonstrated large regions (average volume, 20 mL) with an increased choline-to-NAA ratio. In 19 patients, voxels with an increased choline-to-NAA ratio were found outside the tumor volume identified on T2-weighted images. Preliminary follow-up examinations suggested that recurrent tumors developed predominantly at the site of abnormalities on MRSI (155).
After radiotherapy, significantly higher choline-to-creatine and choline-to-NAA ratios are found in recurrent tumors than in radiation injury (156). Using a threshold of 1.8 for the choline-to-creatine or choline-to-NAA ratios, Weybright et al. (156) were able to correctly differentiate between radiation injury and tumor recurrence in 27 of 28 patients (15 of 16 recurrent tumors and 12 of 12 radiation injuries). A similar high sensitivity (94%) and specificity (100%) has been reported by Zeng et al. in a group of 28 patients with new contrast-enhancing lesions in the vicinity of a previously resected and irradiated high-grade glioma (157).
In breast cancer, the focus of MRSI has been tumor detection and monitoring response to neoadjuvant therapy. The sensitivity and specificity of MRSI for detection of breast cancer based on increased choline levels has been reported to be about 80% and 92%, respectively (158). However, because of its limited spatial resolution, MRSI is currently not considered as useful for detection of T1 tumors (diameter < 2 cm) (158). Fibroadenomas account for the majority of false-positive findings on MRS (158). After neoadjuvant therapy, choline levels of breast cancer return to normal in histopathologically responding tumors (159). A recent pilot study has evaluated 16 patients with locally advanced breast cancer at 4 T before neoadjuvant therapy, within 24 h after the first chemotherapy dose, and after the fourth dose. Thirteen patients completed the protocol and were evaluable with MRS. The change in choline concentration within 24 h after the first dose was significantly different between patients with an objective response after completion of therapy and those with no response (160). These findings indicate that metabolic changes as assessed by proton spectroscopy may provide a very rapid readout for the effectiveness of neoadjuvant chemotherapy in breast cancer patients.
AMINO ACID TRANSPORT
Mammalian cells take up amino acids by a set of transport molecules with overlapping substrate specificity. Amino acid transport systems have been functionally characterized by affinity for specific amino acids, sodium dependency, and sensitivity to inhibitors before the actual transporter proteins had been identified. Based on functional characteristics, 13 major amino acid transport systems can be differentiated (161). These include the sodium-dependent systems A, ASC, N, Gly, B0, B, B0,+, XAG−, and β and the sodium-independent systems L, y+, b0,+, and xC− (161). Upregulation of A and L amino acid transport has been observed in many cancer cell lines (161). System A activity correlates with cell growth in many cell types, including virally transduced cells (161). There are 3 known proteins mediating A type amino acid transport: SNAT1, SNAT2, and SNAT4 (SNAT: sodium-coupled amino acid transporter) (162). These proteins are members of the SLC38 (solute carrier 38) gene family. Since these transporters were cloned fairly recently, detailed studies on gene expression in cancers are lacking. However, activation of SNAT1 on the mRNA level has been reported in hepatocellular carcinoma (163).
System L mediates sodium-independent transport of aromatic and branched-chain amino acids. There are currently 4 known proteins that mediate L type amino acid transport, designated LAT1–LAT4. The LAT1 protein is covalently linked by a disulfide bridge to the glycoprotein CD98 (also called 4F2hc) (164). Only the heterodimer CD98/LAT1 is able to transport amino acids across the plasma membrane, but the actual catalytic domain of the transporter is the LAT1 protein (164). Even before the function of LAT1/CD98 as an amino acid transport was known, partial cDNA clones of LAT1 were identified because of the upregulation of the corresponding mRNA in proliferating cells, for instance in activated human lymphocytes (cDNA E16) and rat hepatoma cells (cDNA TA1) (165,166). LAT1 is physiologically expressed in many human tissues, including the brain, where it mediates transport of neutral amino acids across the blood–brain barrier (164). LAT1 is also highly expressed in a variety of tumors and tumor cell lines of various origins (167–169). In a series of 321 patients with surgically treated non–small cell lung cancer, LAT1 protein expression as determined by immunohistochemistry was more frequently found in squamous cell carcinoma than in adenocarcinoma (170). Survival of patients with LAT1 expression was significantly worse than that of patients without LAT1 expression (5-y survival rate, 52% vs. 88%). LAT1 expression was also a significant prognostic factor in patients with gliomas (171) and transitional cell carcinomas (170).
LAT1 and also LAT2 are obligatory exchanging transporters: for every amino acid transported into the cell, an amino acid is transported out of the cell (164). Thus, LAT1 and LAT2 cannot, by themselves, induce a change in the overall intracellular amino acid concentration (164). However, they can modify the intracellular concentrations of substrate amino acids because their affinities for intracellular and extracellular amino acids are different (164). LAT3 and LAT4 are structurally different from LAT1 and LAT2 (172,173). LAT3 and LAT4 are functionally active by themselves and are not linked to CD98 (172,173). There are also differences in the affinity to different amino acids (172,173).
After transport across the cell membrane, amino acids can enter protein synthesis or multiple other anabolic and catabolic processes. However, during the relatively short time interval that can be studied by PET, amino acid transport generally appears to be the dominant factor for the uptake of most clinically used radiolabeled amino acids (174). Various amino acid analogs that do not enter protein synthesis have shown similar tumor uptake as natural amino acids (175–177).
Imaging of Amino Acid Transport
Amino acid transport by system A has been imaged with the specific substrate [N-methyl-11C]α-methylaminoisobutyric acid (11C-MeAIB) (178). In pilot clinical studies, 11C-MeAIB has been found to accumulate in lymphomas and head and neck cancers (179). Normal organs with high 11C-MeAIB included the renal cortex, the salivary glands, and the pancreas (180). Excretion of 11C-MeAIB to the urine was low (<1.5% of the injected dose).These results are encouraging for the use of 11C-MeAIB to investigate system A transport activity in patients, but further clinical studies are needed.
Radiolabeled methionine (l-[11C-methyl]methionine) (MET), tyrosine (l-[1-11C]tyrosine), and various tyrosine analogs including l-[2-18F]fluorotyrosine (181), O-(2-[18F-fluoroethyl])-l-tyrosine (FET) (182), l-[3-18F]fluoro-α-methyl tyrosine (FMT) (183), and l-[3-123I]iodo-α-methyl tyrosine) (IMT) (184) represent the most commonly used amino acid tracers in clinical studies. Other tyrosine/phenylalanine analogs evaluated for tumor imaging in patients include l-[2-18F]fluorophenylalanine (185), 18F-l-DOPA (186,187), O-methyl-6-18F-fluoro-l-DOPA (18F-OMFD) (188), p-123I-iodo-l-phenylalanine (189), and 123I-2-iodo-l-tyrosine (190). In addition, the alicyclic amino acid derivatives 1-aminocyclobutane-11C-carboxylic acid (11C-ACBC) (191) and anti-1-amino-3-18F-fluorocyclobutyl-1-carboxylic acid (18F-FACBC) (192) have been shown to accumulate in several human tumors (193).
A comprehensive review of these various imaging probes is beyond the scope of this review, and only certain common characteristics are addressed here. Cell culture studies indicate that L-type amino acid transport appears to be a common mechanism for tumor uptake of MET (194), the tyrosine/phenylalanine analogs (195), and ACBC/FACBC (196). Other amino acid transporters also contribute to a varying but overall lesser degree to the total cellular uptake of these amino acid tracers. Consistent with these in vitro experiments, in vivo studies in tumor-bearing animals (194) and patients with brain tumors have shown a close correlation between the uptake of MET and IMT (175), MET and FET (176), and MET and FDOPA (177). Although the role of the L system in the uptake of clinically used amino acid tracers is well established, there is only limited information as to which of the 4 LAT proteins is mediating tracer uptake by cancer cells. Antibodies against the individual LATs are not generally available, which precludes studies that correlate LAT protein expression in the tumor tissue with the uptake of specific amino acid tracers. Transport studies in Xenopus laevis oocytes expressing LAT1 indicate that IMT and iodotyrosine are transported by LAT1 (197,198).
Clinical Applications
Experimental studies indicate that compared with 18F-FDG, a variety of radiolabeled amino acids are less accumulated by inflammatory lesions (199–201). Based on these data, it has been expected that amino acid PET should be more specific for detection and staging of malignant tumors than 18F-FDG PET. However, in clinical studies, high amino acid uptake has also been observed in infection and inflammation. For example, MET has been shown to accumulate in sarcoidosis (202), and high uptake of FET was documented in brain abscesses (203). Two recent clinical studies have indicated that FMT is not accumulated by inflammatory lesions in patients with sarcoidosis (204) and that FMT PET is more specific than 18F-FDG PET for mediastinal staging of non–small cell lung cancer (205). However, tumor FMT uptake was significantly lower than 18F-FDG uptake (mean SUV 1.5 as compared with 6.8 for 18F-FDG), and the sensitivity of FMT PET for detection of lymph node metastases was only 50% (205). Thus, future studies are warranted to determine whether FMT or other radiolabeled amino acids can improve the accuracy of tumor staging in lung cancer.
MET and 11C-tyrosine have been shown to significantly accumulate in a variety of extracranial malignant tumors including lung cancer, head and neck cancers, breast cancer, sarcomas, and malignant lymphomas (206–212). All these tumors could be visualized with high contrast. However, in studies comparing MET PET with 18F-FDG PET, tumor MET uptake was in most cases lower than 18F-FDG uptake (212,213). A low uptake of MET in inflammatory lesions was observed in selected cases but could not be convincingly demonstrated in larger series of patients. In addition, the biodistribution of MET is characterized by high uptake in liver and pancreas as well as by variable uptake in the small and large intestine (214). This makes MET less suitable than 18F-FDG for studies of the abdomen and pelvis. The biodistribution of FET is more favorable, with predominantly renal excretion and low intestinal and liver activity (182). However, with the exception of squamous cell carcinoma (215), uptake of FET in extracranial tumor has generally been found to be low (216). Overall, no clear benefits of using radiolabeled amino acids instead of 18F-FDG for detection and staging of extracranial tumors have been documented in larger series of patients so far. An exception may be prostate cancer, which was more frequently positive on MET PET than on 18F-FDG PET in one study (217). A recent pilot study has also shown promising data for imaging of prostate cancer with 18F-FACBC (193).
For imaging of intracranial lesions, radiolabeled amino acids proved to be superior to 18F-FDG for tumor detection and delineation (218–220). Since normal gray matter accumulates 18F-FDG to an extent similar to many malignant tumors, contrast between tumor tissue and surrounding normal brain is frequently poor (4,218). Therefore, many centers are now using radiolabeled amino acids for studies of brain tumors instead of 18F-FDG. The 3 main applications of amino acid PET or SPECT in patients with brain tumors are tumor grading, differentiation of tumor recurrence from treatment-induced changes, such as radiation necrosis, and delineation of tumor infiltration for radiotherapy planning.
The correlation between uptake of radiolabeled amino acids and tumor grade has been quite extensively studied for the past 20 y (221–227). The reported results are, however, conflicting as some investigators found a close correlation between amino acid uptake and histopathologic tumor grade (225), whereas others found no significant associations (226). Various factors probably explain these variable results. These include differences in the analysis of the PET or SPECT studies (static uptake measurements vs. analysis of the time course of amino acid uptake) (228) but also differences in the studied patient populations. For example, low-grade oligodendrogliomas tend to show higher amino acid uptake than low-grade astrocytomas (223). Finally, the accuracy of noninvasive tumor grading by MRI has significantly improved since the first studies on grading of brain tumors by amino acid uptake were reported. Thus, the potential incremental diagnostic value of amino acid PET for tumor grading is becoming smaller. In a comparative study, IMT-SPECT and MRI provided the same accuracy for tumor grading (229).
Early and accurate differentiation of treatment-induced changes and tumor recurrence is gaining importance as more and more treatment options for recurrent gliomas are becoming available. Furthermore, first-line treatment of gliomas has become more aggressive, resulting in a higher frequency of treatment-induced changes in normal cerebral tissue. In routine MRI, however, treatment-induced changes and tumor recurrence frequently show identical features (contrast enhancement and edema) (Fig. 5). In this situation, studies using amino acid PET and SPECT (230–232) have shown a high sensitivity and specificity for differentiation of tumor recurrence and radiation injury (Table 5).
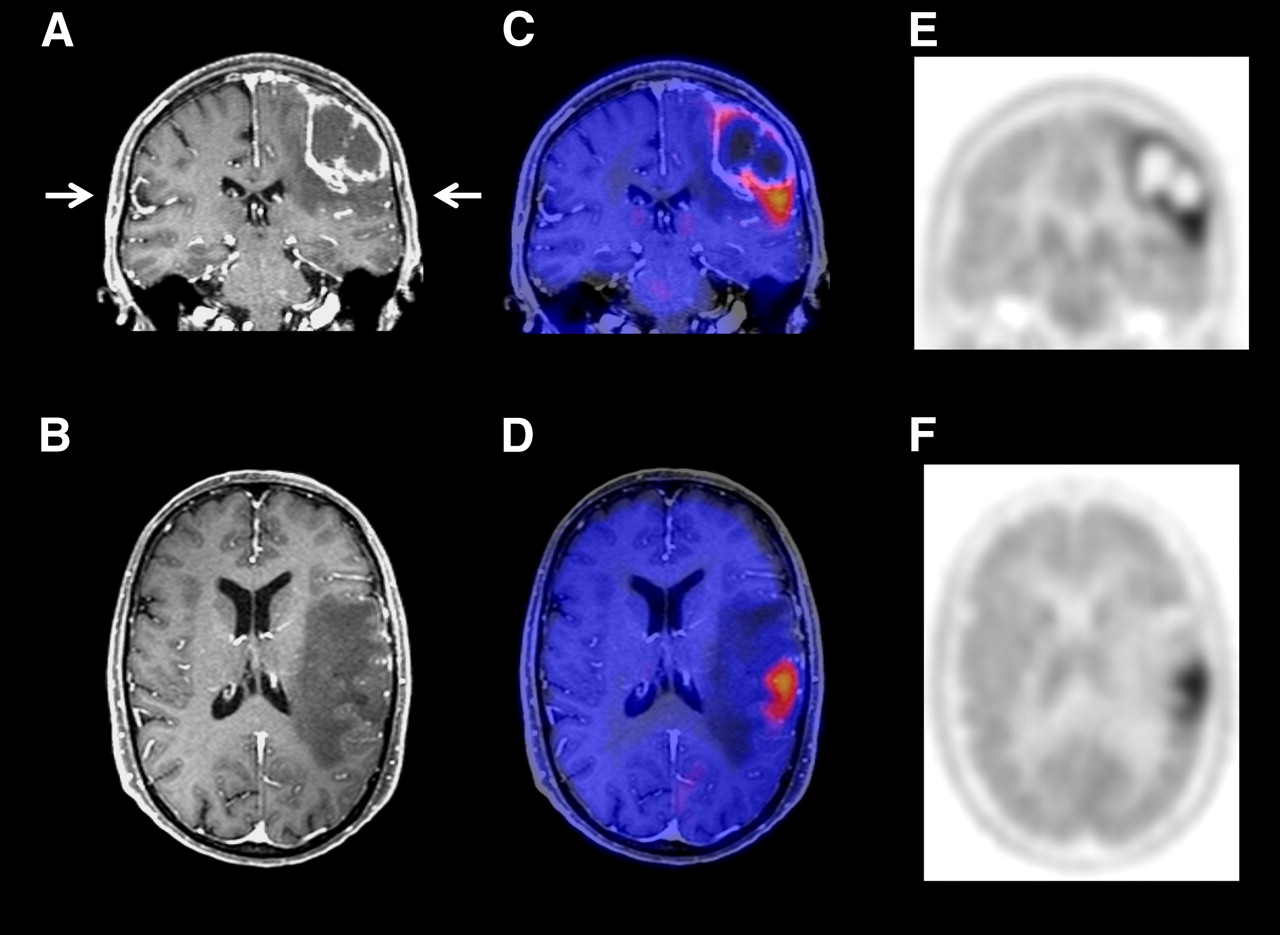
Contrast-enhanced MRI and methionine PET scans of patient with recurrent astrocytoma of grade III. MRI (A and B) showed contrast-enhancing lesion and surrounding edema. Methionine PET images (E and F) and PET/MRI fusion images (C and D) showed intensely increased tracer uptake inferior to contrast enhancement on MRI, indicating that majority of tumor mass was outside area of contrast enhancement.
Differentiation of Radiation Necrosis and Tumor Recurrence by Amino Acid PET or SPECT
Stereotactic and intensity-modulated radiotherapy allows high-dose irradiation of brain tumors while sparing normal brain tissue (233). The optimal use of these new radiation treatment techniques obviously requires accurate delineation of the tumor borders. Traditionally, treatment planning has been based on the results of CT and MRI, because these investigations provide high-resolution, 3-dimensional images of the tumor and surrounding normal brain. Furthermore, calculation of the radiation dose distribution requires measurements of the tissue radiodensity by CT (233). Contrast enhancement on CT or MRI is frequently used to delineate gross tumor volume of high-grade tumors (233). However, it is well established that contrast enhancement only inaccurately delineates gliomas. Serial biopsies of patients undergoing craniotomy for malignant gliomas revealed infiltrating tumor cells more than 3 cm distant from the contrast-enhancing tumor margin (234). In a more recent study by Pauleit et al. (5), only 10 of 26 stereotactic biopsies of gliomas that contained tumor cells demonstrated contrast enhancement on MRI (sensitivity, 38%). The situation is further complicated in pretreated patients, as contrast enhancement is not a reliable sign of recurrent tumor but may also indicate radiation necrosis or other treatment-induced reactions. In a recent study by Rachinger et al. (230) including 45 patients, the specificity of contrast enhancement for recurrent glioma was only 50% (7 of 14 patients) (Table 3).
In MRI, hyperintensity on FLAIR images has also been used to define tumor extension. However, these signal abnormalities are relatively unspecific and are also found in peritumoral edema without infiltrating tumor cells. Stereotactic biopsies of brain regions positive on FLAIR images revealed tumor cells in only about 50% of the biopsies (5). Comparing CT and MET PET with autopsy findings, Bergström et al. (235) noted 25 y ago that increased MET uptake better correlates with brain tumor extension than contrast enhancement on CT. This observation has been confirmed in a series of studies (4,236,237) correlating amino acid PET with stereotactic biopsies (Table 6). These studies consistently found a very high specificity and sensitivity of amino acid PET for tumor delineation. False-negative results primarily occurred in grade 2 astrocytomas.
Accuracy of Amino Acid PET for Brain Tumor Delineation in Comparison with Histologic Evaluation
In the most comprehensive analysis published so far, Pauleit et al. (5) analyzed whether FET PET can improve tumor delineation in comparison to MRI. They studied 31 patients with newly diagnosed gliomas that underwent contrast-enhanced MRI and FET PET. Tumor extension was defined either on MRI (T1-weighted images before and after administration of gadolinium-DTPA and FLAIR images) or a combination of MRI and PET. Fifty-two stereotactic biopsies served as the gold standard. The sensitivity of MRI for detection of tumor tissue was 96%, but specificity was only 53%. Combined use of MRI and FET PET yielded a similar sensitivity of 93% but a substantially improved specificity of 94% (5).
In patients scheduled to undergo radiotherapy, marked differences between tumor volumes defined on amino acid PET or SPECT and MRI have been observed. In 39 patients with previously operated gliomas, MET uptake corresponded to contrast enhancement in 7 patients (18%), whereas in 31 of 39 cases (79%), the region of MET uptake was larger than that of Gd enhancement, and in 29 of 39 patients (74%) contrast enhancement extended beyond the region of increased MET uptake (238). Focal MET uptake was detected up to 45 mm beyond Gd enhancement and up to 40 mm beyond the hyperintense area on T2 (238).
Based on these data, one study has evaluated the impact of PET-based radiation treatment planning on patient outcome in a group of 44 patients with recurrent, high-grade gliomas treated with fractionated stereotactic radiotherapy (239). The median overall survival was 5 mo when treatment planning was performed by MRI or CT, compared with 9 mo when treatment planning was based on amino acid PET and MRI or CT (P = 0.03) (239). A randomized multicenter trial is planned to prospectively confirm these encouraging results.
CONCLUSION
Imaging of tumor cell metabolism has been in clinical use for many years. Recently, however, interest in metabolic imaging has markedly grown, since a series of studies has indicated that metabolic imaging can have a marked impact on patient management by improving tumor staging, radiation treatment planning, and monitoring of tumor response to therapy. Furthermore, experimental studies are beginning to reveal a close link between oncogene activation and metabolic alterations in cancer cells and suggest that metabolic imaging may be used to monitor noninvasively targeted therapies that inhibit specific oncogenes. Imaging of tumor cell metabolism is therefore expected to remain a cornerstone of clinical and preclinical molecular imaging in the coming years.
Footnotes
-
COPYRIGHT © 2008 by the Society of Nuclear Medicine, Inc.
References
- 1.↵
- 2.↵
- 3.↵
- 4.↵
- 5.↵
- 6.↵
- 7.↵
- 8.↵
- 9.↵
- 10.↵
- 11.↵
- 12.↵
- 13.↵
- 14.↵
- 15.↵
- 16.↵
- 17.↵
- 18.↵
- 19.↵
- 20.↵
- 21.↵
- 22.↵
- 23.↵
- 24.↵
- 25.↵
- 26.↵
- 27.↵
- 28.↵
- 29.↵
- 30.↵
- 31.↵
- 32.↵
- 33.↵
- 34.↵
- 35.↵
- 36.
- 37.↵
- 38.↵
- 39.
- 40.↵
- 41.↵
- 42.↵
- 43.↵
- 44.↵
- 45.↵
- 46.↵
- 47.↵
- 48.↵
- 49.↵
- 50.↵
- 51.↵
- 52.↵
- 53.↵
- 54.↵
- 55.
- 56.
- 57.↵
- 58.↵
- 59.↵
- 60.↵
- 61.↵
- 62.↵
- 63.↵
- 64.↵
- 65.↵
- 66.↵
- 67.↵
- 68.
- 69.↵
- 70.↵
- 71.↵
- 72.↵
- 73.↵
- 74.↵
- 75.↵
- 76.↵
- 77.↵
- 78.↵
- 79.↵
- 80.↵
- 81.↵
- 82.↵
- 83.↵
- 84.↵
- 85.↵
- 86.↵
- 87.↵
- 88.↵
- 89.↵
- 90.↵
- 91.↵
- 92.↵
- 93.↵
- 94.↵
- 95.↵
- 96.↵
- 97.↵
- 98.↵
- 99.↵
- 100.↵
- 101.↵
- 102.↵
- 103.↵
- 104.↵
- 105.↵
- 106.↵
- 107.
- 108.↵
- 109.↵
- 110.↵
- 111.↵
- 112.↵
- 113.↵
- 114.↵
- 115.↵
- 116.↵
- 117.↵
- 118.↵
- 119.↵
- 120.↵
- 121.↵
- 122.↵
- 123.↵
- 124.↵
- 125.↵
- 126.↵
- 127.↵
- 128.↵
- 129.↵
- 130.↵
- 131.↵
- 132.↵
- 133.
- 134.↵
- 135.↵
- 136.↵
- 137.↵
- 138.↵
- 139.↵
- 140.↵
- 141.↵
- 142.↵
- 143.↵
- 144.↵
- 145.↵
- 146.↵
- 147.↵
- 148.↵
- 149.↵
- 150.↵
- 151.↵
- 152.↵
- 153.↵
- 154.↵
- 155.↵
- 156.↵
- 157.↵
- 158.↵
- 159.↵
- 160.↵
- 161.↵
- 162.↵
- 163.↵
- 164.↵
- 165.↵
- 166.↵
- 167.↵
- 168.
- 169.↵
- 170.↵
- 171.↵
- 172.↵
- 173.↵
- 174.↵
- 175.↵
- 176.↵
- 177.↵
- 178.↵
- 179.↵
- 180.↵
- 181.↵
- 182.↵
- 183.↵
- 184.↵
- 185.↵
- 186.↵
- 187.↵
- 188.↵
- 189.↵
- 190.↵
- 191.↵
- 192.↵
- 193.↵
- 194.↵
- 195.↵
- 196.↵
- 197.↵
- 198.↵
- 199.↵
- 200.
- 201.↵
- 202.↵
- 203.↵
- 204.↵
- 205.↵
- 206.↵
- 207.
- 208.
- 209.
- 210.
- 211.
- 212.↵
- 213.↵
- 214.↵
- 215.↵
- 216.↵
- 217.↵
- 218.↵
- 219.
- 220.↵
- 221.↵
- 222.
- 223.↵
- 224.
- 225.↵
- 226.↵
- 227.↵
- 228.↵
- 229.↵
- 230.↵
- 231.↵
- 232.↵
- 233.↵
- 234.↵
- 235.↵
- 236.↵
- 237.↵
- 238.↵
- 239.↵
- Received for publication March 6, 2008.
- Accepted for publication April 7, 2008.


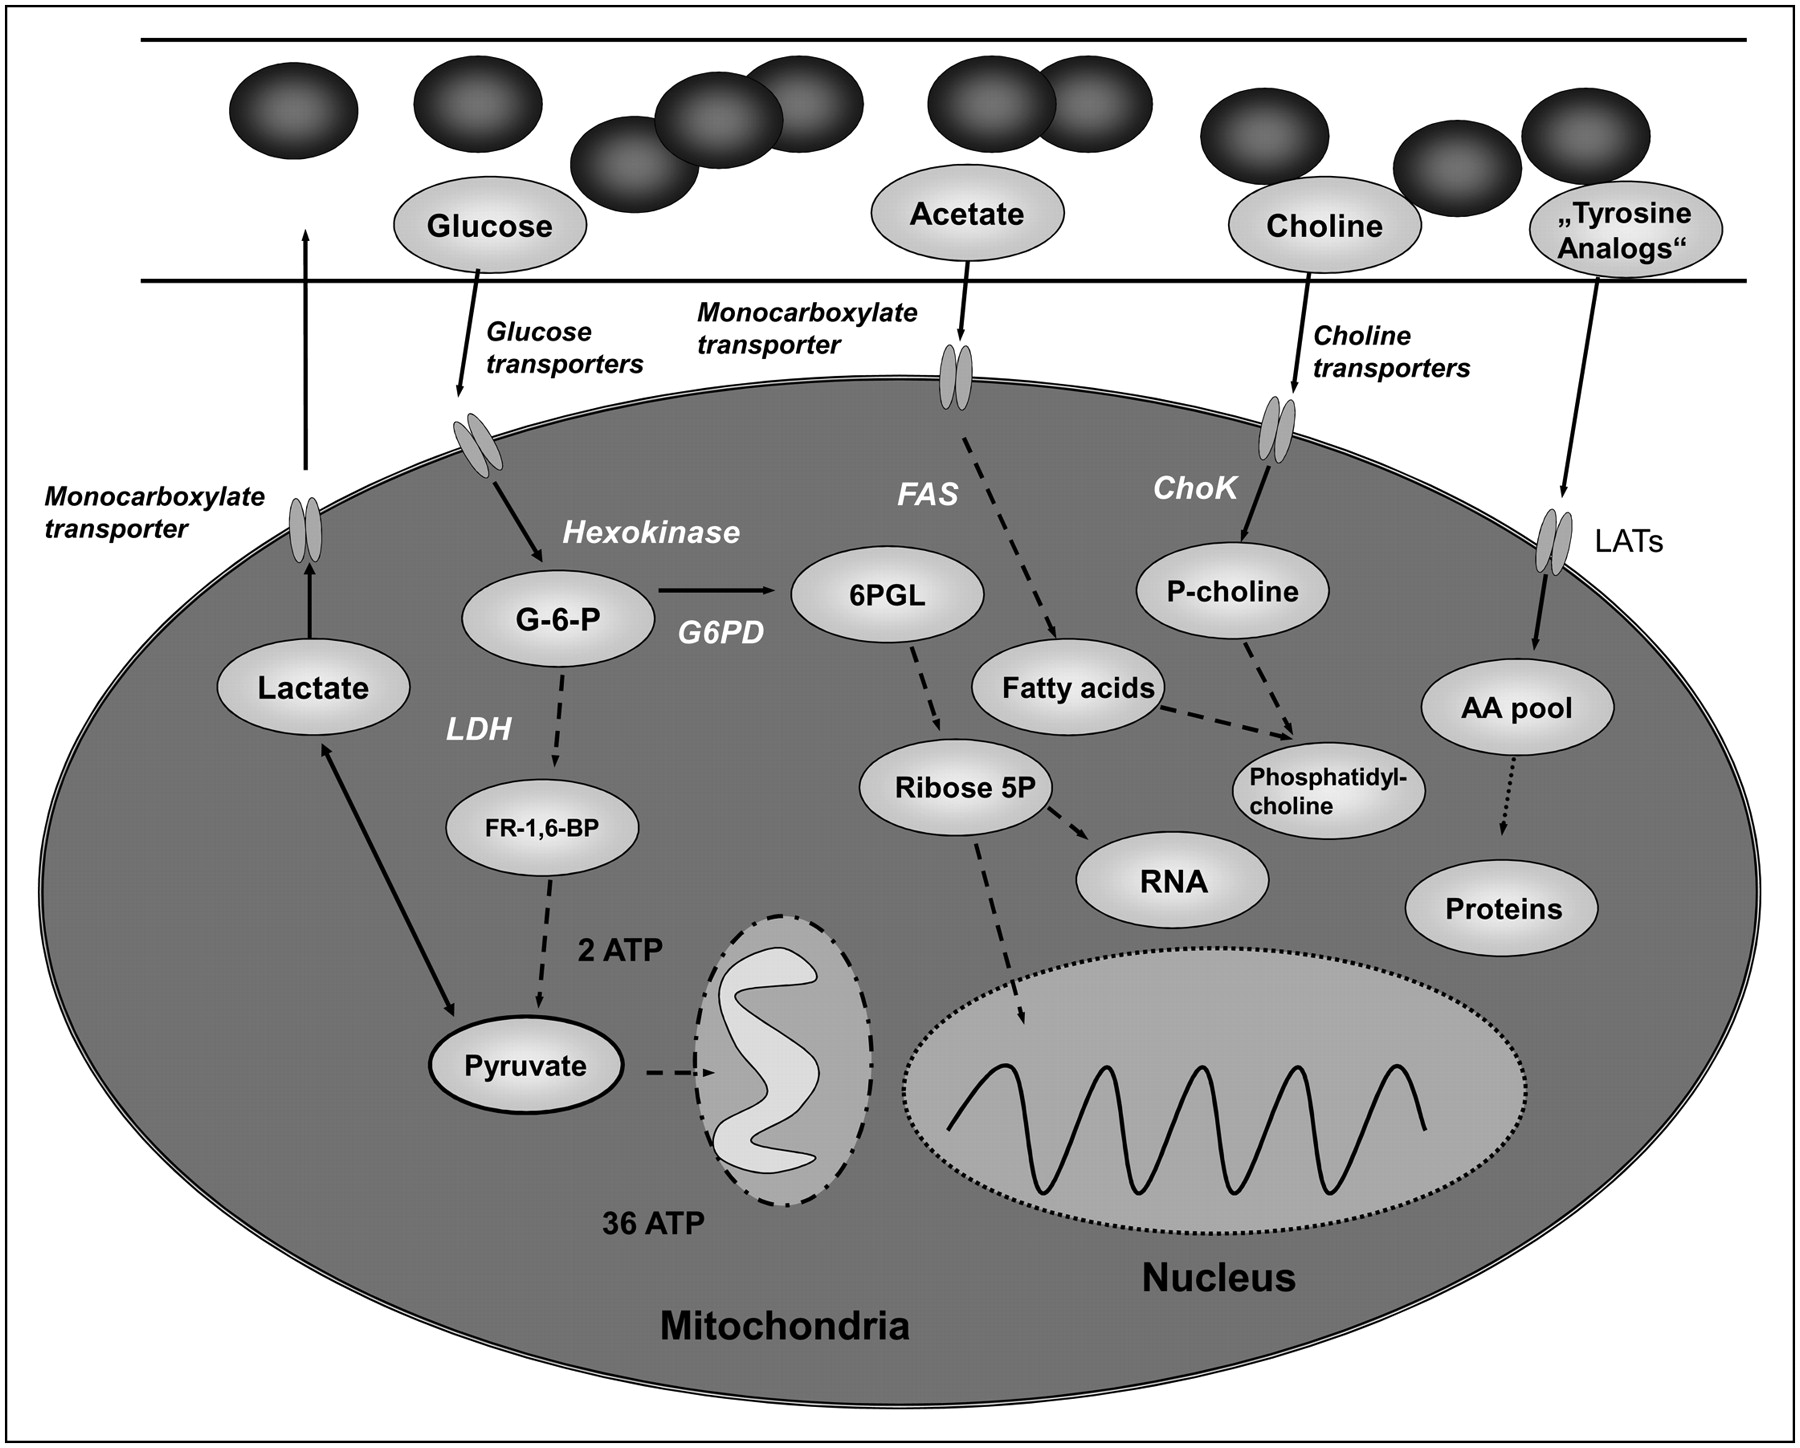
Jump to section
Related Articles
Cited By...
- Metabolic heterogeneity of colorectal cancer as a prognostic factor: insights gained from fluorescence lifetime imaging
- Pyruvate kinase M1 suppresses development and progression of prostate adenocarcinoma
- Interaction of Halogenated Tyrosine/Phenylalanine Derivatives with Organic Anion Transporter 1 in the Renal Handling of Tumor Imaging Probes
- Multiparametric MR-PET Imaging Predicts Pharmacokinetics and Clinical Response to GDC-0084 in Patients with Recurrent High-Grade Glioma
- 11C-Choline Pharmacokinetics in Recurrent Prostate Cancer
- Imaging Cancer Metabolism: Underlying Biology and Emerging Strategies
- The Utility of PET/CT in the Planning of External Radiation Therapy for Prostate Cancer
- Deletion of Lactate Dehydrogenase-A in Myeloid Cells Triggers Antitumor Immunity
- Impact of 18F-Fluciclovine PET on Target Volume Definition for Postprostatectomy Salvage Radiotherapy: Initial Findings from a Randomized Trial
- Imaging Tumor Metabolism to Assess Disease Progression and Treatment Response
- Anti-3-18F-FACBC (18F-Fluciclovine) PET/CT of Breast Cancer: An Exploratory Study
- New Approaches to Molecular Imaging of Multiple Myeloma
- Reversal of Warburg Effect and Reactivation of Oxidative Phosphorylation by Differential Inhibition of EGFR Signaling Pathways in Non-Small Cell Lung Cancer
- Relationship Between 18F-FDG PET/CT Scans and KRAS Mutations in Metastatic Colorectal Cancer
- Development of a Widely Usable Amino Acid Tracer: 76Br-{alpha}-Methyl-Phenylalanine for Tumor PET Imaging
- Anti-1-Amino-3-18F-Fluorocyclobutane-1-Carboxylic Acid: Physiologic Uptake Patterns, Incidental Findings, and Variants That May Simulate Disease
- Widefield Optical Imaging of Changes in Uptake of Glucose and Tissue Extracellular pH in Head and Neck Cancer
- Pituitary Incidentaloma Found on O-(2-18F-Fluoroethyl)-L-Tyrosine PET
- Lack of Association between KRAS Mutations and 18F-FDG PET/CT in Caucasian Metastatic Colorectal Cancer Patients
- 62Cu-Diacetyl-Bis (N4-Methylthiosemicarbazone) PET in Human Gliomas: Comparative Study with [18F]Fluorodeoxyglucose and L-Methyl-[11C]Methionine PET
- Antiangiogenic Therapies: Going beyond Their Limits
- Combined Targeting of PDK1 and EGFR Triggers Regression of Glioblastoma by Reversing the Warburg Effect
- Expanding the Scope of Fluorine Tags for PET Imaging
- Heterogeneity in Lung 18FDG Uptake in Pulmonary Arterial Hypertension: Potential of Dynamic 18FDG Positron Emission Tomography With Kinetic Analysis as a Bridging Biomarker for Pulmonary Vascular Remodeling Targeted Treatments
- Transport of 3-Fluoro-L-{alpha}-Methyl-Tyrosine by Tumor-Upregulated L-Type Amino Acid Transporter 1: A Cause of the Tumor Uptake in PET
- Relationship between 18F-Fluorodeoxyglucose Accumulation and KRAS/BRAF Mutations in Colorectal Cancer
- 5-(2-18F-Fluoroethoxy)-L-Tryptophan as a Substrate of System L Transport for Tumor Imaging by PET
- Impact of 3,4-Dihydroxy-6-18F-Fluoro-L-Phenylalanine PET/CT on Managing Patients with Brain Tumors: The Referring Physician's Perspective
- Preparation and Characterization of L-[5-11C]-Glutamine for Metabolic Imaging of Tumors
- Lactate: A Metabolic Key Player in Cancer
- Multimodal Imaging with 18F-FDG PET and Cerenkov Luminescence Imaging After MLN4924 Treatment in a Human Lymphoma Xenograft Model
- Noninvasive Bioluminescent and MicroPET Imaging for the Regulation of NF-{kappa}B in Human Hepatoma-bearing Mice