


Abstract
The aim of this study was to investigate the value of pharmacokinetic modeling for quantifying 11C-choline uptake in patients with recurrent prostate cancer. Methods: In total, 194 patients with clinically suspected recurrence of prostate cancer underwent 11C-choline dynamic PET over the pelvic region (0–8 min), followed by a 6-min static acquisition at about 25 min after injection. Regions of interest were drawn over sites of disease identified by a radiologist with experience in nuclear medicine. 11C-choline uptake and pharmacokinetics were evaluated by SUV, graphical analysis (Patlak plot; KiP), and 1- and 2-compartment pharmacokinetic models (K1, K1/k2, k3, k4, and the macro parameter KiC). Twenty-four local recurrences, 65 metastatic lymph nodes, 19 osseous metastases, and 60 inflammatory lymph nodes were included in the analysis, which was subsequently repeated for regions of interest placed over the gluteus maximus muscle and adipose tissue as a control. Results: SUVmean and KiP were 3.60 ± 2.16 and 0.28 ± 0.22 min−1 in lesions, compared with 2.11 ± 1.33 and 0.15 ± 0.10 min−1 in muscle and 0.26 ± 0.07 and 0.02 ± 0.01 min−1 in adipose tissue. According to the Akaike information criterion, the 2-compartment irreversible model was most appropriate in 85% of lesions and resulted in a K1 of 0.79 ± 0.98 min−1 (range, 0.11–7.17 min−1), a K1/k2 of 2.92 ± 3.52 (range, 0.31–20.00), a k3 of 0.36 ± 0.30 min−1 (range, 0.00–1.00 min−1) and a KiC of 0.28 ± 0.22 min−1 (range, 0.00–1.33 min−1). The Spearman ρ between SUV and KiP, between SUV and KiC, and between KiP and KiC was 0.94, 0.91, and 0.97, respectively, and that between SUV and K1, between SUV and K1/k2, and between SUV and k3 was 0.70, 0.44, and 0.33, respectively. Malignant lymph nodes exhibited a higher SUV, KiP, and KiC than benign lymph nodes. Conclusion: Although 11C-choline pharmacokinetic modeling has potential to uncouple the contributions of different processes leading to intracellular entrapment of 11C-choline, the high correlation between SUV and both KiP and KiC supports the use of simpler SUV methods to evaluate changes in 11C-choline uptake and metabolism for treatment monitoring.
Prostate cancer (PCa) is one of the most commonly diagnosed cancers in men worldwide. It is estimated that 164,690 new cases of PCa will be diagnosed and that 29,430 men will die of the disease in the United States in 2018 (1). Despite initial treatment with curative intent, biochemical recurrences, defined as an increase in prostate-specific antigen (PSA) level, occur in more than 25% of cases.
11C-choline is a PET radiopharmaceutical for the detection and localization of recurrent PCa, with its Food and Drug Administration approval being based primarily on its ability to detect disease not visualized with conventional imaging. Choline is a precursor of phospholipids, major structural components of the plasma membrane, and as such is necessary for membrane synthesis and cell division (2). It is predominantly transported into cells via high-affinity sodium-dependent choline transporters, phosphorylated by choline kinase (which is overexpressed in many malignant tumors, including PCa), and incorporated into phospholipids such as phosphatidylcholine. Choline also plays a role in cell proliferation by modulating transmembrane signaling (3).
Meta-analysis of PCa patients with biochemical recurrence undergoing 11C-choline PET (12 studies, 1,055 patients) by Umbehr et al. reported a pooled sensitivity of 85% and a pooled specificity of 88% (4). Evangelista et al. reviewed the use of 11C-choline PET in biochemical relapse of PCa (19 studies, 1,555 patients), reporting a pooled sensitivity of 86% and a pooled specificity of 93% for all sites of disease (5). More recently, Fanti et al., evaluating 11C-choline in recurrent PCa (29 studies, 2,686 patients), reported 89% pooled sensitivity and 89% pooled specificity (6). On the other hand, Ren et al., performing a meta-analysis of 18F-fluciclovine PET/CT (6 studies, 251 patients) in the diagnosis of recurrent PCa, reported 87% pooled sensitivity and 66% pooled specificity (7); however, the specificities for extraprostatic disease may be higher than the meta-analysis suggests (8). 11C-choline is relatively insensitive in patients who have biochemically recurrent PCa after surgery with PSA values of less than 2 ng/mL. A recent study comparing 68Ga-labeled PSMA-11 and 11C-choline PET for detection of PCa metastases concluded that 68Ga-labeled PSMA-11 PET exhibited significantly higher uptake and a significantly higher detection rate than 11C-choline PET in the subgroup of patients with PSA levels below 1 ng/mL (9). However, 11C-choline PET/CT is attractive for monitoring tumor response to therapy in patients with metastatic PCa. 11C-choline uptake reflects a basic metabolic process of the cancer cells that is not directly regulated by androgen signaling. In contrast, PSMA expression is negatively regulated by androgens. During androgen deprivation therapy, uptake of PSMA ligands may therefore increase at least temporarily in responding tumors (10). Quantitative analysis of PSMA PET scans during androgen deprivation therapy, a cornerstone of all PCa therapy, may therefore be challenging.
To use 11C-choline PET/CT for monitoring tumor response, it is important to provide quantitative measures of tracer uptake. The simplest approach to assess 11C-choline uptake is the calculation of SUV at a fixed time. For 18F-FDG PET, multiple studies have shown that SUVs and SUV changes during therapy correlate well with glucose metabolic rates determined from tracer kinetic modeling (11). Therefore, SUVs are now routinely used to monitor changes in glucose metabolic activity (12). However, there are only a few similar analyses for 11C-choline PET/CT.
The aim of the current study was to explore the potential added benefit of pharmacokinetic modeling for quantifying PET uptake in a large cohort of patients with recurrent PCa using a radiotracer that has already been extensively applied in a clinical setting. We also sought to determine how well SUVs from static PET scans correlate with 11C-choline uptake rates derived from dynamic scans. Furthermore, we investigated whether pharmacokinetic modeling of 11C-choline biodistribution can facilitate better differentiation of tumor-involved and inflammatory lymph nodes.
MATERIALS AND METHODS
Patient Selection
All patients participated in an institutional review board–approved expanded access study (protocol 15-117) and gave written informed consent to the examination and use of anonymous data for research and publication purposes. There were 4 inclusion criteria. The first was biopsy-proven adenocarcinoma of the prostate initially treated with curative intent. The second, biochemical recurrence, was defined as a PSA level of at least 0.2 ng/mL in at least 2 sequential tests for patients treated with prostatectomy; a PSA level of at least 0.2 ng/mL above the posttherapy nadir for patients treated with radiation therapy, brachytherapy, or cryotherapy; or a PSA level of at least 0.2 ng/mL above the most recent therapy nadir for patients who received additional treatment in the setting of recurrence. The third inclusion criterion was negative or inconclusive findings on standard-of-care imaging studies (e.g., CT, MRI, conventional bone scintigraphy, or 111In-capromab pendetide scintigraphy), and the fourth was an age of at least 18 y. In total, 194 patients were included in the study between March 2016 and December 2016.
PET/CT Imaging
11C-choline was synthesized on-site by N-11C-methylation of dimethylethanolamine in ethanol with 11C-methyl iodide and isolated by solid-phase extraction on a cation-exchange cartridge. Residual dimethylethanolamine and 11C-methyl iodide were removed from the cartridge by rinsing it with ethanol and water, and the remaining purified product was eluted with sterile isotonic saline through a sterilizing filter into the final product vial.
The patients fasted for at least 4 h before the scan and were encouraged to void before and after imaging. Concurrent with an intravenous bolus injection of 370–740 MBq of 11C-choline, the patients underwent dynamic PET on a Discovery 690 or Discovery 710 PET/CT scanner (GE Healthcare) over the pelvic region (0–8 min; binned into 6 × 10 s, 4 × 30 s, and 5 × 60 s). This scan was followed by a whole-body scan lasting about 18 min after injection (not used for the purpose of pharmacokinetic modeling) and a 6-min static acquisition at about 26 min after injection, focused over the pelvic region. The CT images acquired immediately before the PET scan were performed with 120 kVp, 80 mAs, and a 3.8-mm slice thickness. All PET emission data were corrected for attenuation, scatter, and random events and then iteratively reconstructed into a 128 × 128 × 47 matrix (voxel dimensions, 5.46 × 5.46 × 3.27 mm) using the ordered-subset expectation-maximization algorithm provided by the manufacturer.
Image Analysis
The images were analyzed in PMOD, version 3.604 (PMOD Technologies GmbH). Regions of interest were manually drawn over sites of disease and inflammatory lymph nodes that were identified by a radiologist with experience in PET/CT imaging and nuclear medicine, on the late-time-point 6-min static PET scan. For this purpose, the PET scans were fused with their corresponding CT scans to provide anatomic information. Uptake in inguinal lymph nodes was considered inflammatory because the inguinal nodes are not in the lymphatic drainage system of the prostate (13).
11C-choline uptake was measured by the SUVmean within the region of interest. Graphical analysis was performed to calculate the Patlak slope (KiP). In addition, irreversible and reversible 1-compartment (1T1K and 1T2K, respectively) and 2-compartment (2T3K and 2T4K, respectively) pharmacokinetic models were investigated to calculate the kinetic rate constants K1, K1/k2, k3, and k4. In all 4 compartment models, the blood volume fraction was also fitted. Additionally, a macro parameter derived from compartmental analysis (KiC) was calculated and compared with the KiP. KiC is a unidirectional uptake rate constant defined as Eq. 111C-choline equilibration time, T*, was calculated as
 Eq. 2and represents the time after which unbound 11C-choline has reached more than 99% of its final ratio relative to blood. The input function was derived from the dynamic PET images, segmenting the femoral artery on the early frame with the highest image intensity by selecting approximately the 200 hottest voxels. Image-derived input function time–activity curves were defined using the available temporal data (i.e., the first 8 min of the dynamic acquisition and the last 6 min of the static frame) and fitted with a triphasic exponential function. The target activity concentration at each time frame was weighed by
 Eq. 3where c is the scaling factor, Δti is the frame duration, AC(ti) is the decay-corrected activity concentration measured at midframe time ti, and λ is the isotope decay constant (ln2 divided by half-life). Because metabolite counts were not acquired on a patient-by-patient basis, population-wise metabolite correction was applied using previously reported values (14,15). The Akaike information criterion as implemented in PMOD was used to determine the most appropriate compartmental model (16). The correlation between investigated metrics was analyzed using the Spearman ρ. Metrics were compared between groups using the unpaired 2-tailed Student t test. A P value of less than 0.05 was assumed to represent statistical significance.
RESULTS
According to the National Comprehensive Cancer Network guidelines, the pretreatment risk categories for the 194 patients were category I for 1 patient, IIA for 28 patients, IIB for 23 patients, III for 71 patients, and IV for 58 patients. In 13 patients, the risk category could not be calculated. In total, 48% of patients (94/194) had positive findings on the whole-body 11C-choline scan, indicating local recurrence in 12% of patients (24/194), lymph node metastasis in 32% of patients (62/194), and bone metastasis in 14% of patients (27/194). Four of 27 patients with bone metastases also exhibited lymph node metastases. The median PSA and Gleason score were 2.5 ng/mL (range, 0.3–82.9 ng/mL) and 7 (range, 6–10), respectively. The detection rate for local recurrence or metastatic disease varied by PSA value: 12% (6/49) for a PSA value of less than 0.5 ng/mL, 34% (11/32) for 0.5–1.0 ng/mL, 68% (21/31) for 1.0–2.0 ng/mL, and 68% (56/82) for more than 2.0 ng/mL. Detection according to the National Comprehensive Cancer Network risk category was 100% for category I (1/1), 64% for IIA (18/28), 30% for IIB (7/23), 48% for III (34/71), 47% for IV (27/58), and 54% unknown (7/13).
Twenty-one patients had lesions outside the 15.7-cm axial field of view of the dynamic scan. Pharmacokinetic modeling was performed for the remaining 73 patients, with 108 malignant lesions (24 local recurrences, 65 lymph node metastases, and 19 osseous metastases) being included in the analysis. For these patients, the pharmacokinetic modeling was also conducted for regions of interest placed over gluteus maximus muscle and adipose tissue. Additionally, 60 inguinal lymph nodes with probable inflammation were analyzed in 26 patients. Biopsies were performed in 33 of the 73 patients for whom pharmacokinetic modeling was performed. In all 33 patients, the results were positive. The biopsy results were negative in all 3 patients for whom biopsies were performed in inguinal lymph nodes.
SUVmean and KiP were 3.60 ± 2.16 and 0.26 ± 0.17 min−1 in malignant lesions, compared with 1.63 ± 0.70 and 0.11 ± 0.04 min−1 in inflammatory lymph nodes, 1.02 ± 0.40 and 0.07 ± 0.03 min−1 in muscle, and 0.26 ± 0.07 and 0.02 ± 0.01 min−1 in adipose tissue (Table 1). Malignant lymph nodes were found to have a significantly higher SUV, KiP, and KiC than inflammatory lymph nodes (Table 1, P < 0.01). 11C-choline equilibration was sufficiently fast relative to the total scan duration in all lesions and inflammatory lymph nodes.
Summary of 11C-Choline Dynamic PET Analysis
According to the Akaike information criterion as implemented in PMOD, the 2T3K model was the most appropriate in 85% of lesions, with the 1T1K and 1T2K models being the most appropriate in the remaining 15% of lesions. The Akaike information criterion values for the 1T1K, 1T2K, 2T3K, and 2T4K models were 147 ± 16, 140 ± 15, 127 ± 12, and 132 ± 18, respectively. The pharmacokinetic modeling results for all analyzed tissues, as calculated with the 2T3K model, are summarized in Table 1. A significantly higher SUV, KiP, KiC, K1, Ki/k2, and k3 were observed in malignant lesions than in inflammatory lymph nodes, with values for muscle and adipose tissue being lower still. The 11C-choline distribution volume (approximated by K1/k2) was around unity in inflammatory lymph nodes and muscle tissue; however, it was slightly lower in adipose tissue, indicating the dependence of radiotracer distribution volume on tissue composition. Osseous and lymph node metastases were significantly better perfused than local recurrences or reactive lymph nodes. Adipose tissue was the least well perfused, with k3 values close to zero. A subanalysis of lesions categorized as local recurrences, lymph nodes, and osseous metastases is also included in Table 1. Despite similar SUVs between local recurrences and osseous metastases (4.00 ± 2.25 and 3.86 ± 1.24, respectively), a significant difference was observed in K1 (0.49 ± 0.36 and 0.99 ± 0.92 min−1, respectively; P = 0.02).
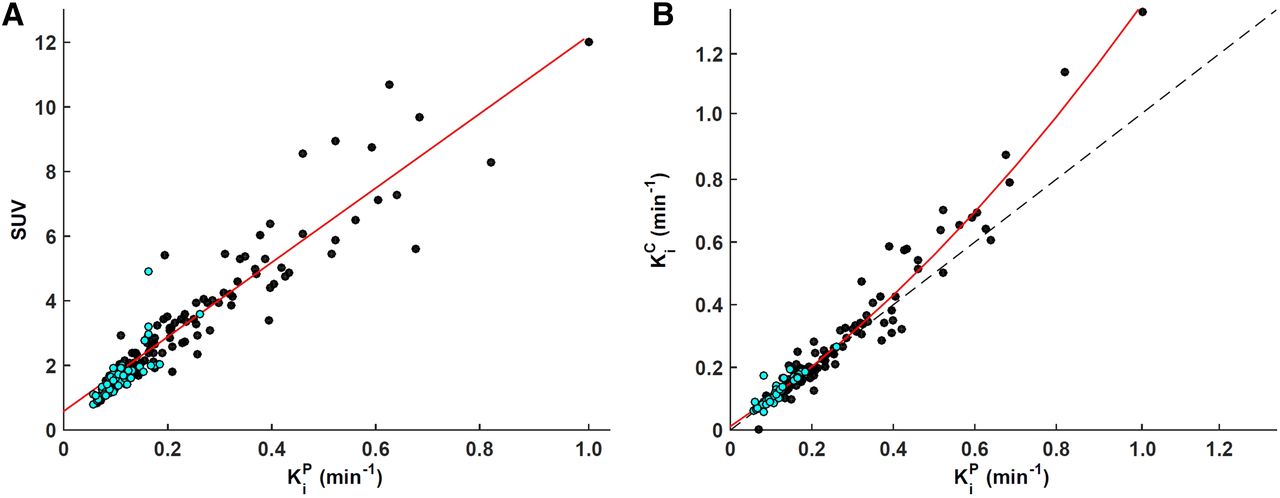
The Spearman ρ between lesion SUV and KiP was 0.94 (Fig. 1A), whereas that between lesion SUV and KiC was 0.91. A high correlation was observed between KiP and KiC (0.97) (Fig. 1B). A slight discrepancy between lesion KiP and KiC was mediated by K1: the correlation between Δ(KiP-KiC) and K1 was found to be −0.67. The discrepancy became more apparent for a Ki of 0.4 min−1 or greater (corresponding to an SUV ≥ ∼6), indicating that the compartment model is not robust in these scenarios. Among the investigated kinetic rate constants, the correlation with SUV was the strongest for K1 in all tissues (0.71), whereas for K1/k2 and k3 it was 0.44 and 0.33 (Table 2). No correlation was found between lesion K1 and k3 (ρ = −0.16; P = 0.09); however, the correlation between K1/k2 and k3 was −0.36 (P < 0.01). No significant correlation was observed between Gleason score or National Comprehensive Cancer Network score and any of the imaging metrics (i.e., SUV and kinetic rate constants). The Spearman ρ reached significance for correlations between PSA and SUV, KiP, and KiC (0.28, 0.26, and 0.21, respectively).

Population-wise comparison of 11C-choline metrics derived from static and dynamic PET acquisitions. (A) Scatterplot of Patlak slope KiP (x-axis) vs. SUV (y-axis) for all lesions (black, n = 108, ρ = 0.94) and inflammatory lymph nodes (cyan, n = 60, ρ = 0.93). Regression slope = 11.5; regression intercept = 0.6. (B) Scatterplot of influx rate constant Ki as derived from graphical Patlak analysis (KiP, x-axis) and compartmental modeling (KiC, y-axis) for all lesions (black, n = 108, ρ = 0.97) and inflammatory lymph nodes (cyan, n = 60, ρ = 0.96). Second-degree polynomial fit and line of identity are shown as solid red line and dashed black line, respectively.
Spearman ρ with SUV
In 15% of the lesions for which 1-compartment models resulted in a lower Akaike information criterion value, fitting of time–activity curves was suboptimal regardless of the model used. This result was primarily due to a continuing gradual increase in tumor signal after an initial plateau was reached, as well as the suboptimal metabolite correction, which likely underestimated the radiotracer available for intracellular trapping (resulting in k3 ≥ 0.4 min−1). When the analysis for all 108 lesions was repeated using input functions not corrected for metabolites, the quality of the fits improved substantially in the aforementioned 15% of lesions, and the 2T3K model was assessed as most appropriate in almost all cases. The correlations between SUV and KiP and between SUV and KiC were lower, however, at 0.83 and 0.80, respectively, whereas the corresponding correlations for K1, K1/k2, and k3 were 0.72, 0.67, and 0.31, respectively.
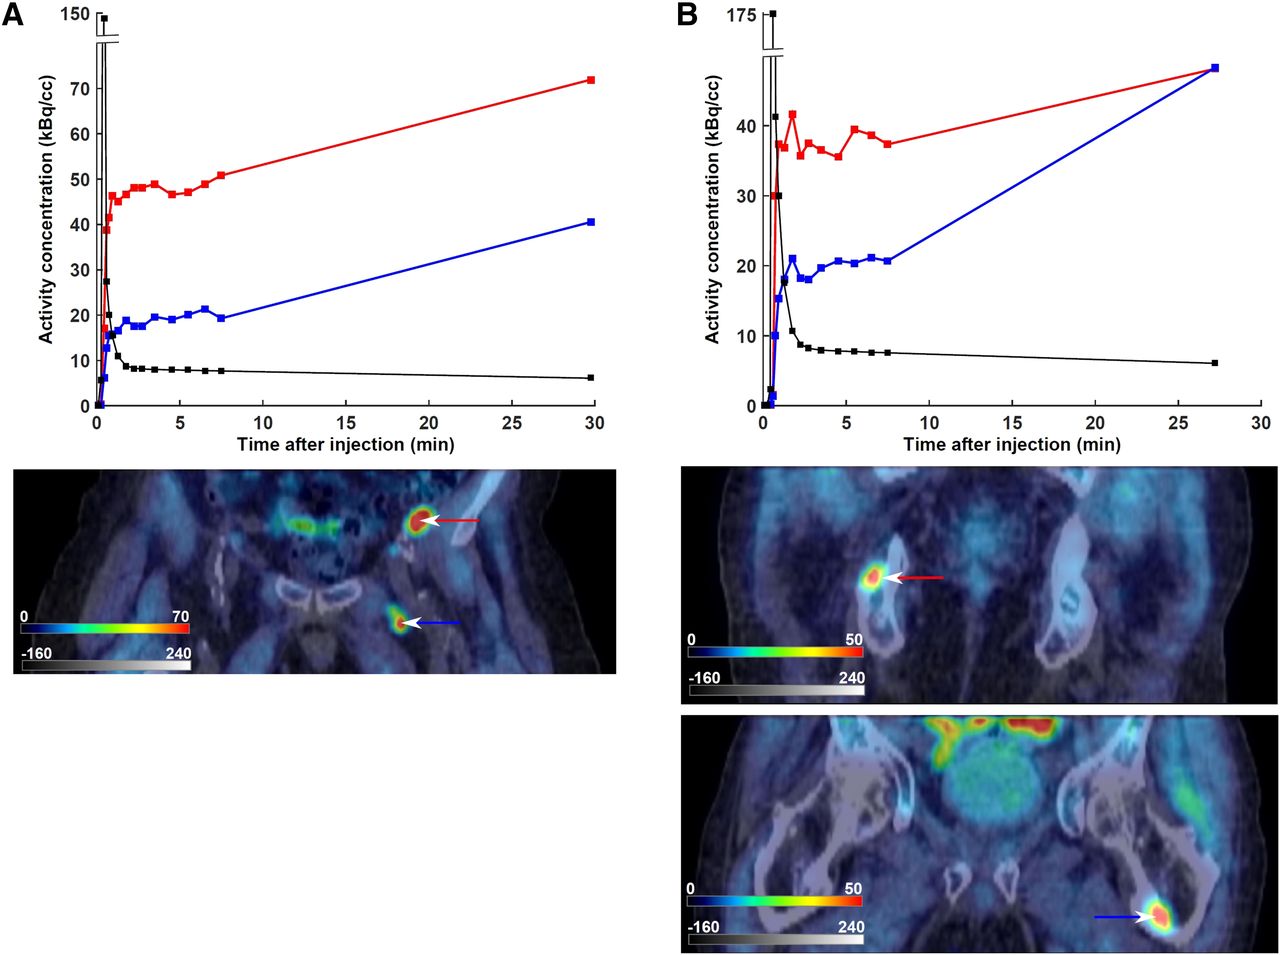
An example of both concordance and discordance between SUV and 11C-choline pharmacokinetics is presented in Figure 2. In patient 1 (PSA, 8.6 ng/mL; Gleason score, 7), a metastatic lymph node with a higher SUV also exhibited a higher K1 and K1/k2 (as well as a higher KiC; Fig. 2A). On the other hand, the 2 osseous metastases in patient 2 (PSA, 9.8 ng/mL; Gleason score, 8) exhibited markedly different kinetic rate constants despite having similar SUVs (Fig. 2B).

Relationship between SUV and 11C-choline pharmacokinetics in 2 patients with biopsy-proven disease recurrence. Late static PET scans, fused with their corresponding CT scans, are included. Input function time–activity curves are superimposed in black. Color scales are kBq/cm3 and Hounsfield units for PET and CT, respectively. (A) Patient 1, exhibiting concordance between SUV and kinetic rate constants. First lymph node, marked with red time–activity curve and arrow (SUV = 10.7, K1 = 1.64 min−1, K1/k2 = 4.91, k3 = 0.21 min−1), exhibits both higher SUV and higher K1 and K1/k2 than second lymph node, marked with blue time–activity curve and arrow (SUV = 6.0, K1 = 0.59 min−1, K1/k2 = 1.16, k3 = 0.70 min−1). (B) Patient 2, exhibiting discordance between SUV and kinetic rate constants. The osseous metastasis marked with red time–activity curve and arrow (SUV = 5.0, K1 = 0.97 min−1, K1/k2 = 4.17, k3 = 0.18 min−1) has similar SUV but different pharmacokinetics from the osseous metastasis marked with blue time–activity curve and arrow (SUV = 5.0, K1 = 0.41 min−1, K1/k2 = 1.27, k3 = 1.00 min−1).
DISCUSSION
Compared with dynamic imaging, static PET scans are clinically more feasible, shorter, and better suited to a busy clinical schedule. However, our study indicated that similar SUVs can be produced by lesions exhibiting very different pharmacokinetics that reflect differences in tumor differentiation and perfusion. Nevertheless, a high correlation was observed between SUV and Ki as determined either by graphical Patlak analysis or by pharmacokinetic modeling, supporting the value of using the simpler static measure in place of dynamic PET scans to quantify 11C-choline uptake in these patients for treatment monitoring.
Intracellular choline levels are determined both by the rate of choline uptake and by the rate of phosphatidylcholine synthesis and degradation. Experimental studies have indicated that a large fraction of the intracellular choline still represents nonmetabolized choline, suggesting that choline transport and not phosphorylation is the key factor in choline uptake by cancer cells (17,18). Henriksen et al. demonstrated that although tumor uptake of the choline derivative 18F-deshydroxycholine—which cannot be phosphorylated by choline kinase—is similar to that of 11C-choline at early time points (<5 min after injection), uptake of 11C-choline is significantly higher at longer incubation times (>20 min after injection), because at earlier times radiolabel internalization is largely dependent on the choline transport rate whereas at later times choline phosphorylation becomes the dominant step in cellular enrichment (19).
The accumulation of 11C-choline in tumors was rapid, as observed previously (15,20,21). In many cases, a plateau had already been reached within 1–3 dynamic 10-s frames. Among all investigated kinetic rate constants, K1 correlated best with SUV. These results are consistent with the foregoing observations if K1 is taken to reflect not only tumor perfusion and vascular permeability but also the rate of choline transporter activity, whereas k3 is assumed to reflect the irreversible and slower process of phosphorylation by choline kinase, which increases intracellular trapping of choline. In our study, K1 and k3 did not significantly correlate with each other. The preference of an irreversible 2-compartment model over other investigated models by the Akaike information criterion indicates that inclusion of the kinetic rate constant k3 is preferable for describing 11C pharmacokinetics.
Inaba has measured PCa blood flow using 15O-water PET and reported that it averaged 15.7 mL/min/100 g (i.e., 0.157 min−1, assuming unit density tissue), compared with 29.4 mL/min/100 g in PCa tissue (22). Subsequent studies confirmed that the average blood flow rate in PCa is approximately 2–3 times higher than in normal prostate (23). In the current study, comparison with normal prostate tissue was not possible since all patients underwent prostatectomy before 11C-choline PET, although K1 was about 3 times higher than values previously reported for normal prostate (Table 1) (19,20). Osseous and lymph node metastases were found to have still higher K1 values than local recurrences (Table 1). PCa has a high propensity to metastasize to bone (24), specifically to the most heavily vascularized parts of the skeleton (25), and to stimulate osteoblast activity (26). This process is facilitated by the presence of adhesive molecules on tumor cells that bind them to marrow stromal cells, in turn increasing the production of angiogenic factors and bone-resorbing factors that enhance tumor growth (27). High perfusion of osteoblastic metastases has also been described using 18F-NaF PET (28).
Analysis of time–activity curves revealed that in several cases, the activity concentration continued to gradually increase after an initial plateau was reached, in agreement with previous observations (29). Apart from free 11C-choline and 11C-phosphocholine, the tumor PET signal from 11C-choline scanning also comprises the metabolite 11C-betaine (an organic osmolyte produced in liver and kidneys), which contributes to the total uptake through donation of the radiolabeled methyl group to l-homocysteine, producing radiolabeled l-methionine (2). Both 11C-choline and 11C-betaine enter the cells, albeit at different rates, which can conceivably vary between lesions. This process could in principle be modeled as a combined 4-tissue-compartment model, in which the tissue kinetics of both 11C-choine and 11C-betaine are described by 2 interlinked 2-tissue-compartment models. However, such a model requires more parameters than can reliably be fitted. There is also evidence that small amounts of 11C-choline or its radioactive metabolites slowly accumulate in blood cells (14,30), introducing additional variability in how much of the measured 11C activity concentration in blood is available for transport and intracellular trapping.
To the best of our knowledge, there has so far been only a single study of 11C-choline pharmacokinetics in PCa—a study focusing on 14 patients with newly diagnosed disease (20). The authors reported a very high correlation between SUV and Ki as derived from graphical analysis (Pearson r = 0.96, P < 0.01), in agreement with our results. On the other hand, Verwer et al., investigating 18F-fluoromethylcholine dynamic PET in 8 PCa patients, concluded that commonly used SUV metrics cannot be applied to quantify 18F-fluoromethylcholine uptake reliably (31). The authors calculated K1 from a 1T1K model (thus reflecting Ki) and reported an R2 of 0.34 between SUV and K1 (in our study, the corresponding R2 was comparable, at 0.38). However, we found that a 1T1K was not the most appropriate model and that in most cases, a 2T3K model resulted in better fits. The authors also reported an R2 of 0.58 between SUV and KiC (we observed a corresponding R2 of 0.75), but the results of graphical analysis were not included (32). In another study—of 18F-fluoroethylcholine dynamic PET in PCa patients (32)—the authors constrained K1 to no more than 1 mL·min−1·g−1 (Fig. 7A in 33); however, since K1 does not have the same units as k2 or k3 (which represent fractions of mass transferred per unit time), physiologic values of K1 can theoretically be above 1 mL·min−1·g−1. This possibility likely deteriorated the reported low correlation between SUV and K1 (R2 of 0.08).
11C-choline uptake in inguinal lymph nodes was considered likely to represent inflammation (13). However, a limitation of our study was that disease recurrence could be confirmed for only 33 of 73 patients, because biopsies were not performed for the remaining patients. Another limitation was the absence of 11C-choline metabolite analysis on a patient-by-patient basis, since arterial blood was not collected. Instead, a population-wise metabolite correction function, derived using previously published data (14,15), was multiplied by the patient’s image-derived input function. In the foregoing studies, metabolism of 11C-choline resulted in the fact that about 15% of the radioactivity present at 60 min after injection was due to 11C-choline, with 11C-betaine being the only observed radioactive metabolite. Patient-wise variability in metabolite fraction probably affected the quality of fitting but is not expected to have altered the interpretation of the results.
CONCLUSION
Our data represent the largest—to our knowledge—pharmacokinetic analysis of dynamic 11C-choline PET scans on recurrent metastatic PCa. Our analysis showed that 11C-choline pharmacokinetics in this setting were best described by the irreversible 2-compartment model. Malignant lymph nodes exhibited a higher SUV, as well as a higher KiP and KiC, than benign lymph nodes. Osseous metastases exhibited a higher blood flow than did local recurrences, despite having similar SUVs. Although pharmacokinetic modeling has potential to uncouple the contributions of different processes leading to entrapment of 11C-choline within cancer cells, the high correlation between SUV and both KiP and KiC supports the use of a simpler SUV method to evaluate changes in 11C-choline uptake and metabolism for treatment monitoring.
DISCLOSURE
This study was supported by Cancer Center Grant P30 CA008748 from NIH (principal investigator, Craig B. Thompson). No other potential conflict of interest relevant to this article was reported.
Footnotes
Published online Apr. 6, 2018.
- © 2018 by the Society of Nuclear Medicine and Molecular Imaging.
REFERENCES
- Received for publication February 26, 2018.
- Accepted for publication March 23, 2018.


Jump to section
Related Articles
Cited By...
- No citing articles found.