


Abstract
18F-Fluoride PET allows noninvasive evaluation of regional bone metabolism and has the potential to become a useful tool for assessing patients with metabolic bone disease and evaluating novel drugs being developed for these diseases. The main PET parameter of interest, termed Ki, reflects regional bone metabolism. The aim of this study was to compare the long-term precision of 18F-fluoride PET with that of biochemical markers of bone turnover assessed over 6 mo. Methods: Sixteen postmenopausal women with osteoporosis or significant osteopenia and a mean age of 64 y underwent 18F-fluoride PET of the lumbar spine and measurements of biochemical markers of bone formation (bone-specific alkaline phosphatase and osteocalcin) and bone resorption (urinary deoxypyridinoline) at baseline and 6 mo later. Four different methods for analyzing the 18F-fluoride PET data were compared: a 4k 3-compartmental model using nonlinear regression analysis (Ki-4k), a 3k 3-compartmental model using nonlinear regression analysis (Ki-3k), Patlak analysis (Ki-PAT), and standardized uptake values. Results: With the exception of a small but significant decrease in Ki-3k at 6 mo, there were no significant differences between the baseline and 6-mo values for the PET parameters or biochemical markers. The long-term precision, expressed as the coefficient of variation (with 95% confidence interval in parentheses), was 12.2% (9%–19%), 13.8% (10%–22%), 14.4% (11%–22%), and 26.6% (19%–40%) for Ki-3k, Ki-PAT, mean standardized uptake value, and Ki-4k, respectively. For comparison, the precision of the biochemical markers was 10% (7%–15%), 18% (13%–27%), and 14% (10%–21%) for bone-specific alkaline phosphatase, osteocalcin, and urinary deoxypyridinoline, respectively. Intraclass correlation between the baseline and 6-mo values ranged from 0.44 for Ki-4k to 0.85 for Ki-3k. No significant correlation was found between the repeated mean standardized uptake value measurements. Conclusion: The precision and intraclass correlation observed for Ki-3k and Ki-PAT was equivalent to that observed for biochemical markers. This study provided initial data on the long-term precision of 18F-fluoride PET measured at the lumbar spine, which will aid in the accurate interpretation of changes in regional bone metabolism in response to treatment.
The functional imaging technique of 18F-fluoride PET allows a direct quantitative assessment of bone metabolism at specific sites of the skeleton (1–12). In the early 1990s, when 18F-FDG PET was evolving as a major tool in the field of oncology, 18F-fluoride PET was introduced as a technique for quantifying bone metabolism by Hawkins et al., who first described the 3-compartmental kinetic model that can be applied in clinical studies (7). Like 18F-FDG PET, 18F-fluoride PET has several methods for quantitation, ranging from simple semiquantitative measures to methods that require complex protocols for scan acquisition (13,14).
18F-Fluoride PET has been validated by direct comparison with the gold standard of bone biopsy (9,10). Although bone biopsy is considered the gold standard, it is rarely used in clinical practice because of several limitations, including its invasive nature and the fact that it is limited to just a single skeletal site. The most common and practical method for obtaining information on the rate of global skeletal metabolism is the measurement of urinary or serum biochemical markers of bone turnover (15). Although such measurements can readily be performed, it is likely that a global measure of skeletal function will attenuate or mask metabolic bone activity in focal bone disease or at metabolically active skeletal sites such as the lumbar spine. 18F-Fluoride PET has 2 major advantages. First, it is noninvasive, making it attractive in a clinical setting, and second, it can provide information about specific skeletal sites.
18F-Fluoride PET has been used in several clinical studies investigating variations in regional bone metabolism with type and severity of metabolic bone disease, including osteoporosis, renal osteodystrophy, and Paget's disease (2,4,8,9,12). This technique can be used to quantify therapeutic response in those with osteoporosis (3) and those with Paget's disease treated with bisphosphonates (8). It may also have a role in the assessment of physiologic events such as bone graft revascularization and osteogenesis after allogenic bone grafts (6,16–18).
If 18F-fluoride PET is to be utilized as a technique to quantify therapeutic response, knowledge of the precision of the measurements is required for accurate interpretation of changes over time and for planning research studies. The lumbar spine is known to be the optimum site for quantifying therapeutic response in patients with metabolic bone disease because of the magnitude of bone density changes there, compared with other skeletal sites (19). The aim of the current study was to evaluate the long-term precision of skeletal kinetic parameters measured at the lumbar spine using 18F-fluoride PET. Because changes in bone metabolism in response to treatment are typically measured over 3–6 mo, precision was assessed over 6 mo in the present study. The precision of 18F-fluoride PET was also compared with that of the conventional method of biochemical markers of bone turnover.
MATERIALS AND METHODS
Subjects
The study population consisted of 16 postmenopausal women with a mean age of 64.0 y (range, 53–76 y). All subjects had a bone mineral density (BMD) T-score of less than −2 at the lumbar spine or hip and were therefore classified as having osteoporosis or significant osteopenia according to the World Health Organization criteria for diagnosing osteoporosis (20). None of the subjects had diseases known to affect bone metabolism other than significant osteopenia or osteoporosis. Standard laboratory tests of serum calcium, albumin-corrected calcium, alkaline phosphatase, phosphate, and liver and kidney profiles, including serum creatinine, parathyroid hormone, and vitamin D levels, were assessed at each visit and were found to be within normal limits for all subjects. Each subject underwent 18F-fluoride PET, measurements of biochemical markers of bone turnover, and dual-energy x-ray absorptiometry measurements of BMD at the lumbar spine and hip at baseline and 6 mo. Thirteen subjects were on stable antiresorptive therapy for the treatment of osteoporosis for a minimum of 12 mo at baseline (median duration of treatment, 25 mo) and remained on this therapy between baseline and the 6-mo visit. Five of the subjects were on etidronate, 1 on risedronate, 3 on raloxifene, 3 on hormone replacement therapy, and 1 on etidronate and hormone replacement therapy. All patients were treatment-compliant, defined as taken more than 90% of their expected treatment between baseline and the follow-up visit. The remaining 3 subjects were not on any treatments for osteoporosis throughout the study period. Written informed consent was obtained from all study participants, and the study was approved by the Guy's Hospital Research Ethics Committee.
BMD Measurements
Dual x-ray absorptiometry measurements of BMD (g/cm2) at the lumbar spine (L1–L4) and left hip were performed at baseline and 6 mo using a QDR4500 (Hologic). The Hologic reference range and the NHANES III range (21) were used to derive lumbar spine and hip T-scores, respectively.
Measurements of Biochemical Markers of Bone Turnover
Measurements of serum bone-specific alkaline phosphatase (Alkphase-B; Metra Biosystems) and serum osteocalcin (Novocalcin; Metra Biosystems) were performed as markers of bone formation. Fasting second-morning-void urinary deoxypyridinoline cross-links (Pyrilinks-D, Metra Biosystems), corrected for creatinine, were measured as a marker of bone resorption. Blood and urine samples were taken at baseline and 6 mo on the day of the 18F-fluoride PET scan and were collected at the same time of the day at each visit. Samples were stored at −70°C and then analyzed as a single batch using the same kit to minimize between-run imprecision errors.
Radiotracer
18F-Fluoride was produced via the 18O(p,n)18F nuclear reaction in a RDS112 cyclotron (CTI/Siemens) by irradiating H2180 with 11-MeV protons. After purification, the 18F-fluoride was automatically transferred to a sterile vial containing normal saline via a 0.22-μmol filter for sterilization. Radiochemical purity was always greater than 99%.
Blood Sampling
Venous blood samples were taken at 2, 4, 10, 20, 30, 40, 50, and 60 min after the injection of 18F-fluoride. A portion of each sample was centrifuged, and plasma and whole-blood 18F counting rates were measured using a well counter that had been cross-calibrated with the PET scanner. The ratio of plasma to whole-blood 18F-fluoride concentrations with time was used to correct for plasma/whole blood differences, as required for deriving the arterial plasma input function.
PET Image Acquisition and Analysis
PET was performed on a ECAT 951R scanner (Siemens). The subjects were positioned supine with the mid lumbar region within the field of view. A 15-min transmission scan was then acquired using 68Ge/68Ga external rods for subsequent attenuation correction. Ninety megabecquerels of 18F-fluoride were injected intravenously simultaneously with the initiation of a dynamic emission scan. The dose was approximately one third that used for diagnostic 18F-fluoride PET scans and was chosen to reduce the total effective dose to the research participants. This same dose has been used successfully in our study that examined the direct effects of risedronate treatment on fluoride kinetics at the lumbar spine (3). The injection protocol was consistent for all patients to minimize any differences in the time to peak plasma activity. The 60-min dynamic emission scan consisted of the following time frames: 12 × 10 s, 4 × 30 s, and 14 × 240 s. Images were reconstructed by filtered backprojection, using a Hann 0.5 filter, and corrected for attenuation using the transmission scan, resulting in thirty-one 3.48-mm slices for each frame with a pixel size of 2 mm and an image spatial resolution of 8.5 mm (full width at half maximum). To obtain static images for the placement of regions of interest (ROI), we summed frames 23–30.
ROIs were derived using the summed static image and were placed over the vertebral bodies using an automated method that used a threshold of 50% of the maximum bone activity for each image set (Fig. 1A). Only the vertebral body was included in the ROI, and disk spaces were excluded from analysis. Slices directly above or below the intervertebral disk spaces were not used to avoid any spillover effects. For each subject, 1–3 complete vertebrae were available within the field of view for analysis (Figs. 1B and 1C). The ROIs were then used to produce time–activity curves for individual vertebrae. The same ROIs were used for calculating standardized uptake values (SUVs).
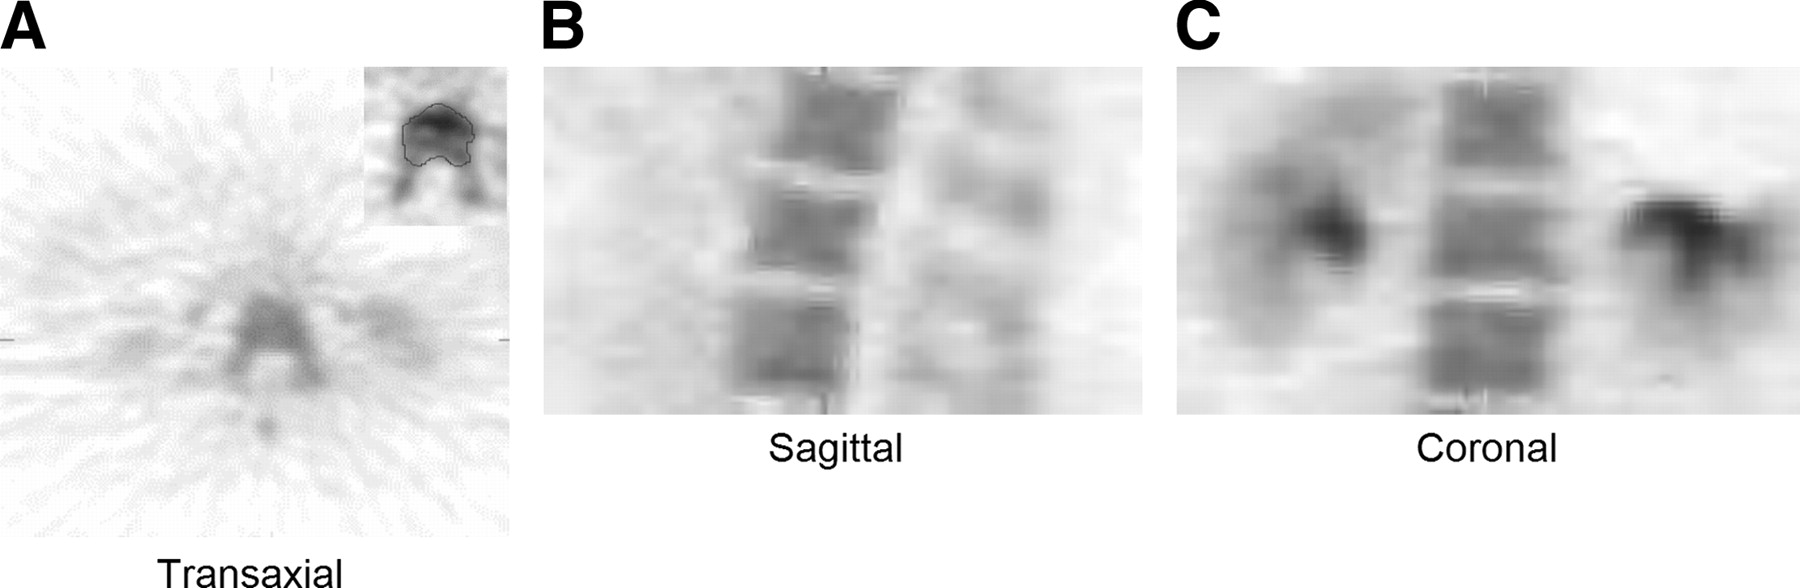
18F-Fluoride PET images of lumbar vertebra showing ROI around vertebral body: transaxial view (image zoomed in inset) (A), sagittal view (B), and coronal view (C).
Image-Derived Arterial Plasma Input Function
To obtain individual kinetic parameters, we required the concentration of 18F-fluoride in plasma in relation to time. The plasma arterial input function was derived by measuring 18F-fluoride counts over the aorta. An early dynamic frame, in which the bolus of activity was best visualized, was used, and an automatic procedure was used to position ROIs over the aorta. Then, the mean value within each ROI was averaged over all planes. The time-dependent differences between the required plasma and measured whole-blood concentrations using the image data were corrected using the venous blood samples taken during the dynamic scan. This method of deriving an input function has been validated previously (22) by comparison with direct arterial sampling in a group of postmenopausal women. No significant differences were observed in the kinetic PET parameters obtained using either the image-derived or arterial sampling methods (22); therefore, the former method was chosen in preference to invasive arterial sampling.
18F-Fluoride PET Data Processing
The PET data were processed using 4 different analytic methods to obtain an estimate of bone metabolism: nonlinear regression based on a 4k 3-compartmental model (Ki-4k), nonlinear regression based on a 3k 3-compartmental model (Ki-3k), Patlak graphical analysis (Ki-PAT), and SUV calculation (SUVmean). Values for each parameter were derived for each vertebra and then averaged to give a regional parameter for the lumbar spine for each subject.
Nonlinear Regression 4k 3-Compartmental Model (4k)
The skeletal 18F-fluoride kinetic parameters were estimated using the 3-compartmental tracer kinetic model described by Hawkins et al. (7), which consists of a vascular (whole blood) compartment, an extravascular bone compartment, and a bone mineral compartment (Fig. 2). The rate constants K1–k4 describe the transport of 18F-fluoride between compartments. K1 describes the unidirectional clearance of fluoride from plasma to the extravascular compartment, k2 the reverse transport of fluoride from the extravascular compartment to plasma, and k3 and k4 the incorporation and release, respectively, from the bone mineral compartment. The macroparameter Ki, representing the net clearance of fluoride to the bone mineral compartment, was calculated as: Eq. 1Ki is a function of both K1 that reflects bone blood flow, and the fraction of the tracer that undergoes specific binding to the bone mineral ((k3/(k2 + k3)). This constant has been shown to reflect the level of osteoblastic activity in bone and is therefore considered to be a valid measure of bone metabolism (9,10). In order to account for vascular 18F-fluoride activity in the tissue region, we included a fifth parameter, fractional blood volume, in the model.
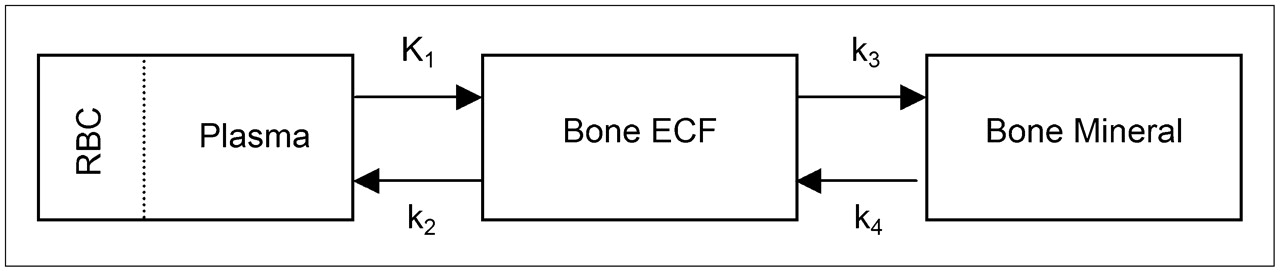
Three-compartmental 4k bone kinetic model described by Hawkins et al. (7) to analyze 18F-fluoride PET bone studies. See text for description of rate constants. RBC = red blood cells; ECF = extracellular fluid.
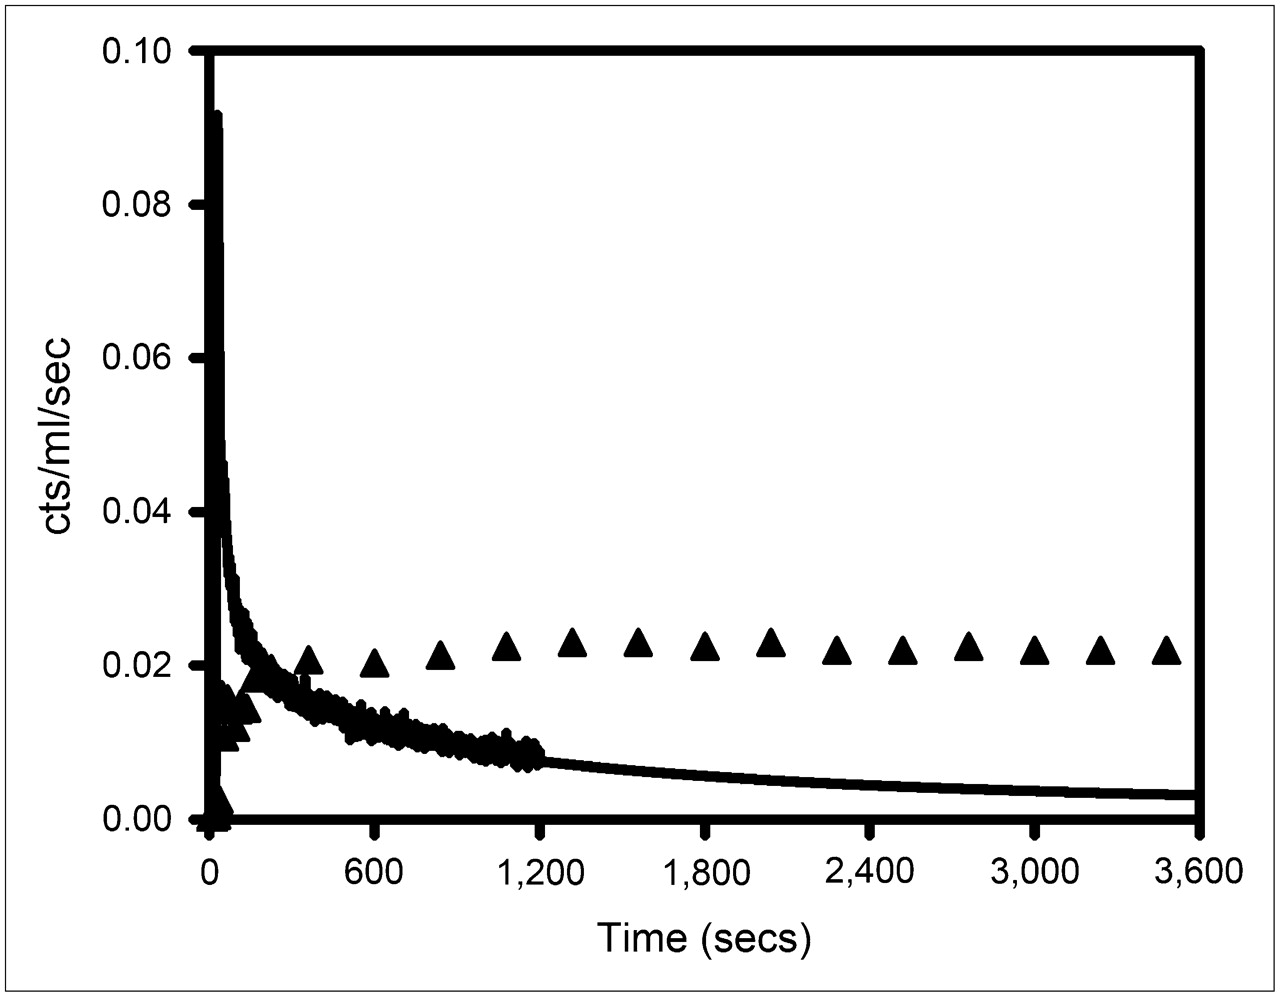
An example of a tissue time–activity curve and plasma input function used to derive the kinetic parameters using the 4k and 3k model and Patlak analysis is shown in Figure 3.

Representative study showing image-derived arterial plasma input function (continuous line) and vertebral ROI time–activity curve (▴). Vertebral values have been multiplied by 4 for easier comparison with input function. Decay corrections have been applied.
Nonlinear Regression 3k 3-Compartmental Model (3k)
This method of obtaining the skeletal kinetic parameters uses the 3-compartmental model (Fig. 2) (7) but with k4 assumed to be zero; that is, there is unidirectional uptake of tracer by tissue with no release of 18F-fluoride from bone mineral during the 1-h scan, giving a 3-compartmental 3k model. Ki-3k was calculated using Equation 1.
Patlak Graphical Analysis (PAT)
The macroparameter Ki was calculated using graphical analysis (23,24) for a 3k 3-compartmental model (Fig. 2). Using Patlak analysis, Ki-PAT is calculated using the following equation: Eq. 2where Ct(t) is the tissue activity concentration of 18F-fluoride at time t within the ROI, Cb(t) is the blood concentration of tracer (obtained using the input function data), and V is the effective distribution volume of the tracer. This method assumes that k4 is equal to zero in that fluoride is irreversibly bound to bone mineral. Ki-PAT is obtained from the slope of the linear part of the fit of Ct(t)/Cb(t) versus
  . To allow for equilibrium between the blood and extravascular compartments and ensure a linear fit, we used the data from 10 min to the end of scan acquisition. A linear fit was observed in all patients, allowing the same time to be used for each subject for all scans. An example of a Patlak plot is shown in Figure 4.
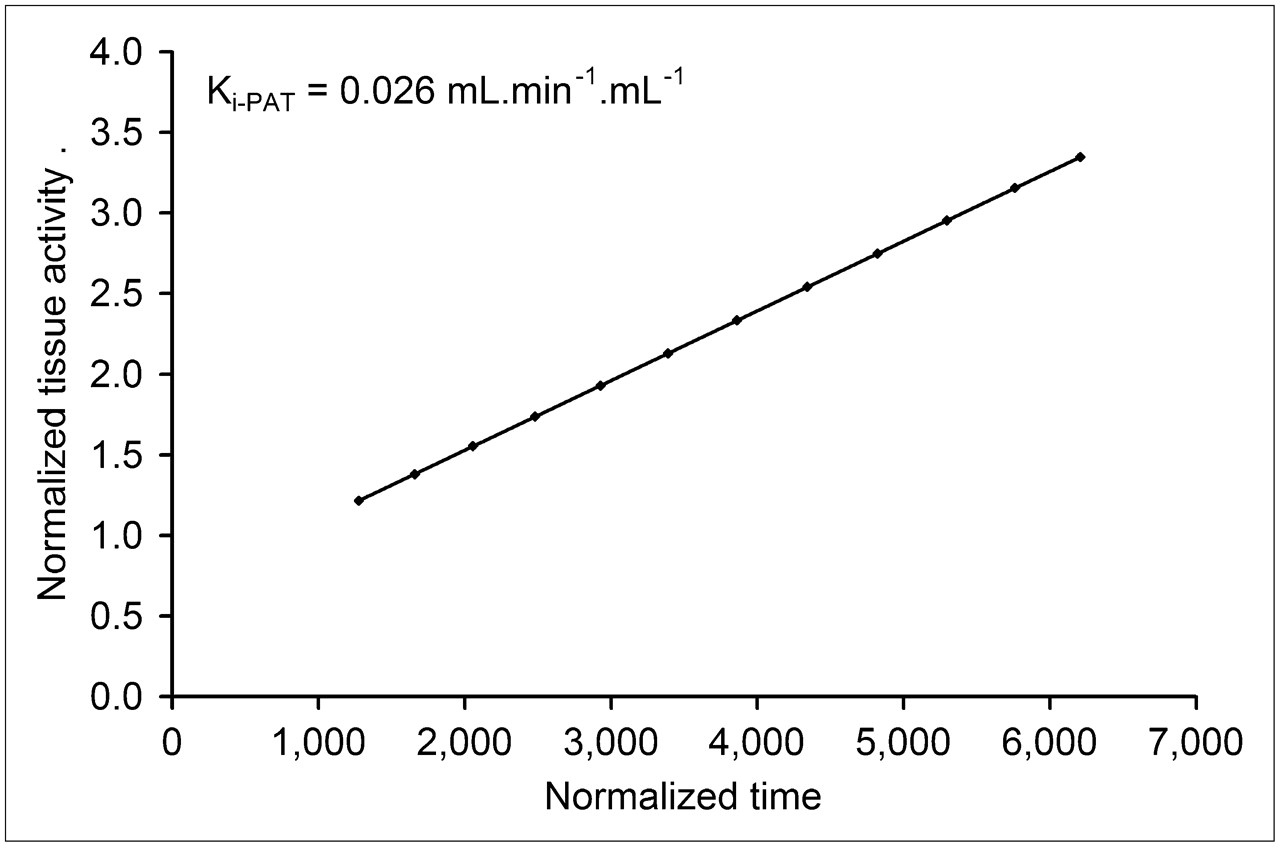
Representative Patlak plot. Ki-PAT is equal to slope of normalized tissue activity against normalized time derived using linear regression.
SUV
Image data for the last 2 time frames during dynamic scan acquisition (i.e., 52–60 min) were summed for the purpose of calculating SUV. SUVs were calculated using the mean activity concentration within the ROIs by applying the following equation: Eq. 3where A is the mean tissue activity (counts/mL) within each ROI in the summed images, ID is the injected dose (MBq), and m is the patient body weight (kg). To avoid inaccuracies, which could arise if mean SUV (SUVmean) is estimated when uptake of 18F-fluoride is still rising, we evaluated individual dynamic time–activity curves for each subject. In all subjects at both assessment points, we confirmed that 18F-fluoride had reached equilibrium at the time after injection SUVmean was assessed (52–60 min). Decay corrections were applied accordingly.
Statistical Analysis
Results are expressed as mean and SD. The paired Student t test was used to compare differences in the skeletal kinetic parameters between baseline and 6 mo. Tests for normality were performed and parametric and nonparametric tests used accordingly. One-way ANOVA correcting for multiple comparisons using the Bonferroni method was applied to compare Ki values estimated with each of the 3 analytic methods for calculating Ki (4k, 3k, and Patlak). Box plots were used to assess the range of differences observed in the PET parameters between baseline and 6 mo and also to check for outliers. The Wilcoxon signed-rank sum test was used to compare the individual precision errors between the 3 methods for calculating Ki. Precision was expressed as the coefficient of variation (CV) calculated using the root mean square SD. Agreement between baseline and the 6-mo measurements was expressed as the intraclass correlation. A P value of 0.05 or less was considered statistically significant.
RESULTS
Table 1 shows the group average for the PET kinetic parameters, biochemical markers of bone turnover, and BMD measurements taken at baseline and 6 mo. There was no significant change in biochemical markers or spine and hip BMD between baseline and 6 mo. Ki-3k showed a small but significant decrease at 6 mo, whereas no significant change was found in Ki-4k, Ki-PAT, or SUVmean. Values of Ki-3k and Ki-PAT were significantly lower than those observed using the 4k model, by an average of 25.9% and 4.2%, respectively. No significant difference was found in Ki values derived using the 3k model or PAT. Individual subject results at baseline and 6-mo are shown in Table 2.
18F-Fluoride PET Parameters, Biochemical Markers, and BMD at Baseline and 6 Months
Individual Results for Ki and SUVmean at Baseline and 6 Months
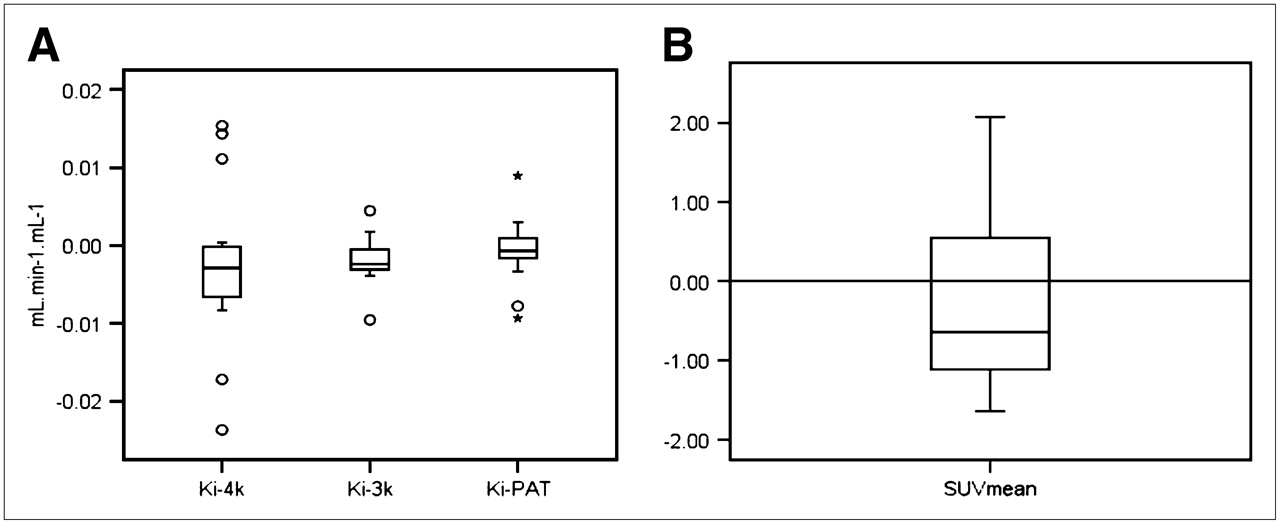
Box plots of the individual differences between the baseline and 6-mo assessments for the 3 methods used to derive Ki and SUVmean are shown in Figure 5. The range of changes was larger for Ki-4k than for Ki-3k and Ki-PAT, and the number of outliers observed for Ki-4k was also greater. Two of the subjects (subjects 4 and 15 in Table 2) showed large differences between baseline and 6 mo for all 3 analytic methods of deriving Ki. The magnitude of these changes was over 1.5 and 3 times the interquartile range, and these are shown as outliers and extreme values, respectively, in Figure 5. These same subjects did not show large changes (exceeding 1.5 times the interquartile range) for any biochemical marker measurements.

Box plot showing differences in repeated measurements for Ki-4k, Ki-3k, and Ki-PAT (A) and for SUVmean (B). Boxes represent values between 25th and 75th percentiles, horizontal bars inside boxes indicate median, vertical bars above and below boxes represent 10th and 90th percentiles, outliers greater than 1.5× interquartile range are presented by circles, and extreme values greater than 3× interquartile range are indicated by asterisk.
The precision of the PET parameters ranged from 12.2% for Ki-3k to 26.6% for Ki-4k (Table 3). The individual precision errors in Ki for each subject were significantly greater using the 4k model than the 3k model or PAT. No significant difference in precision were found among Ki-3k, Ki-PAT, and SUVmean. The precision values of the 3 biochemical markers were similar to the value observed for Ki using the 3k model and PAT and SUVmean but were less than that observed using the 4k model (Table 3). The intraclass correlation between measurements taken at baseline and 6 mo was highly significant for Ki-3k, Ki-PAT, and all biochemical markers but was only moderate for Ki-4k and not significant for SUVmean (Table 3).
Precision of 18F-Fluoride PET and Biochemical Markers
DISCUSSION
18F-Fluoride PET has the potential to become a useful tool for the noninvasive assessment of regional bone perfusion and metabolism in patients with metabolic bone disease (1–12). However, knowledge of the precision of this technique is vital for the accurate interpretation of changes in fluoride kinetic parameters observed in response to treatment or with disease progression and for the planning of future studies. To date, the spine has been the site of choice in most studies using 18F-fluoride PET. The reasons are that the change in bone metabolism is greater than that observed at other skeletal sites; the aorta lies within the field of view, allowing noninvasive estimation of the input function (1–4,7,12,25); and the size and shape of the vertebral bodies make them amenable to accurate image analysis. This study has shown, for what is to our knowledge the first time, that the precision of 18F-fluoride at the spine is equivalent to that observed using the commonly applied biochemical markers of global bone metabolism.
The precision of 18F-fluoride PET assessed over 6 mo ranged from approximately 13% for Ki-3k, Ki-PAT, and SUVmean to 26.6% for Ki-4k (Table 3). To date, only 1 other study has reported the precision of 18F-fluoride PET for the assessment of regional skeletal kinetics (6). In that study—of 9 patients undergoing bone tumor resection and graft surgery, measured twice over 6 mo—the within-subject CV for normal limb bones was 75%, 79%, and 83% for SUV, Ki-PAT, and Ki-4k, respectively (6). These values far exceed those observed for measurements taken at the lumbar spine in the current study assessed over the same period (Table 3). Reasonable explanations are that measurements were taken at limb bones, which are associated with lower tissue activity, and smaller ROIs were used—both of which are known to increase variability and lead to a loss of sensitivity in the measurement of true radionuclide concentration (26,27). These explanations are reinforced by the fact that in 3 patients from the same study who had repeated measurements of the thoracic spine, the within-subject variation was 8.8%, 13.5%, and 13.9% for SUV, Ki-PAT, and Ki-4k, respectively (6). The precision was best for Ki-3k (CV, 12.2%) in the present study (Table 3), even though a significant decrease in this parameter was observed between baseline and 6 mo. The authors have no reasonable explanation for this decrease, because one would not expect further reductions in bone remodelling activity in patients who had been on stable antiresorptive treatment for a minimum of 12 mo. However, this finding did not adversely influence the precision, as shown by the smaller CV and 95% confidence interval for Ki-3k in Table 3.
The level of agreement between repeated measurements, expressed as the intraclass correlation, was good for the biochemical markers and for Ki-3k and Ki-PAT, whereas agreement between repeated measures of Ki using the 4k model was weaker and no significant correlation was observed for repeated SUVmean measurements (Table 3). Short-term test–retest variability assessed using 18F-FDG PET in patients with malignant tumors has been shown to be excellent, with an intraclass correlation exceeding 0.95 for Ki-PAT, SUVmean, and Ki-3k (27–29). However, the fact that the range of values observed for kinetic variables in malignant tumors using 18F-FDG PET far exceeded that observed for 18F-fluoride PET measured in normal bone at 1 skeletal site would enhance the intraclass correlation. Most important, precision was assessed over 6 mo in the current study, and the reported measures of precision therefore reflect normal day-to-day fluctuations in bone metabolism in addition to measurement error.
Since the publication by Hawkins et al. in 1992 reporting the feasibility of quantitatively assessing regional skeletal fluoride uptake in focal and generalized bone disease, the preferred tracer kinetic model is the 4k 3-compartmental (2-tissue) model (1–12,25). In the current study, the precision errors for Ki-4k were more than double those observed for Ki-3k (Table 3), with both methods using nonlinear regression, but the 3k model assumes no release of 18F-fluoride from bone mineral during the 1-h scan (k4 = 0). In 13 of the 16 subjects, the precision errors observed for Ki-4k were greater than those observed for Ki-3k (P < 0.05). Because errors in calculating the individual rate constants tend to be high and are not independent from one another, and prolonged scan acquisition times would be necessary to accurately estimate k4 (in fact, the CV of k4 estimated in this study was poor at 75%), the inclusion of k4 in the model would likely have an unfavorable effect on the overall precision of the macroparameter Ki. Although the small absolute values of k4 observed in the current and other studies are consistently greater than zero (1,3,7,8,11,12), the assumption of a zero value for k4 may be reasonable, because it does result in better precision for estimating Ki (Table 3).
Kinetic parameters estimated using nonlinear regression are susceptible to noise in the tissue and plasma data, but the linear approach of PAT and the static parameter SUVmean are affected to a far lesser extent. The precision of Ki-PAT was 13.8%, which was significantly better than that observed for Ki-4k (Table 3). High correlations between absolute values of Ki-4k and Ki-PAT and changes in these parameters over time have been reported (6,7), indicating that either method may be used. However, if k4 is not negligible, then Ki will be underestimated using PAT.
Because of the complexity of scan acquisition and analysis protocols associated with dynamic scanning, clinical FDG PET studies are often quantified using the SUV index (14). Estimating SUV allows dynamic scanning to be dispensed with altogether, and instead, 1-frame protocols are acquired at a specific time after injection when tissue uptake has reached equilibrium, typically at 50–70 min (13). The accuracy of SUV as an estimate of bone metabolism has not been assessed. However, significant linear correlations between Ki-4k and Ki-PAT with SUV have been observed (6,8) in addition to good correlations in changes in these parameters in response to bisphosphonate therapy in patients with Paget's disease (8). The precision of SUVmean in this study was similar to that observed for Ki-4k and Ki-PAT (Table 3). However, SUVmean measured at baseline and 6 mo were not significantly correlated (Table 3), in contrast to the kinetic parameters and the biochemical markers. Further studies are required to determine whether estimates of SUV have the necessary accuracy to quantify regional bone metabolism.
This study had several limitations. Precision was estimated at only 1 skeletal site. However, the spine could be considered the ROI of choice for quantifying treatment response in patients with metabolic bone disease. Thirteen of the 16 subjects were on stable antiresorptive therapy (for at least 1 y before baseline), but changes in the rate of bone resorption and formation occur in the first 6 mo of treatment and are stable thereafter, as was confirmed by the stability of the biochemical markers and BMD over the 6-mo study (Table 1). The dose of 90 MBq of fluoride used in the current study is approximately a third of that used in clinical practice for a whole-body 18F-fluoride scan in the United Kingdom. Lower activities are associated with increasing variability (16), and enhanced precision of skeletal kinetic parameters may therefore be expected with higher 18F-fluoride activity and more robust statistics within the ROI. The moderately small number of subjects who participated in the study resulted in relatively large statistical errors in the precision estimates. However, it is ethically important to minimize both the effective dose associated with this technique and the number of study participants. Finally, an older-generation stand-alone PET camera was used in the current study rather than a PET/CT camera, meaning that transmission maps rather than CT data were used for attenuation correction. However, it has been demonstrated that the quantitative accuracy of CT attenuation correction is similar (30), and it therefore is not unreasonable to expect to observe comparable precision for 18F-fluoride PET scans acquired on PET/CT cameras.
CONCLUSION
This study provided data on the long-term precision of 18F-fluoride PET measurements at the lumbar spine and demonstrated that the precision was similar to that observed for biochemical markers. Knowledge of the precision of fluoride kinetic parameters is essential for the accurate interpretation of individual results in clinical studies and for ensuring research studies are properly powered to detect treatment-induced changes. Further work is required to assess the accuracy and sensitivity of the various analytic methods for quantifying regional bone metabolism.
Acknowledgments
The authors thank the staff at the PET Imaging Centre at the King's College London School of Medicine at St. Thomas' Hospital for excellent technical support. This study was supported in part by an unrestricted grant from Aventisa.
Footnotes
-
COPYRIGHT © 2008 by the Society of Nuclear Medicine, Inc.
References
- Received for publication September 6, 2007.
- Accepted for publication January 16, 2008.


Jump to section
Related Articles
Cited By...
- Is Response Assessment of Breast Cancer Bone Metastases Better with Measurement of 18F-Fluoride Metabolic Flux Than with Measurement of 18F-Fluoride PET/CT SUV?
- Semiquantitative Analysis of the Biodistribution of the Combined 18F-NaF and 18F-FDG Administration for PET/CT Imaging
- Bisphosphonate-Induced Osteonecrosis of the Jaw: Comparison of Disease Extent on Contrast-Enhanced MR Imaging, [18F] Fluoride PET/CT, and Conebeam CT imaging
- The Precision and Sensitivity of 18F-Fluoride PET for Measuring Regional Bone Metabolism: A Comparison of Quantification Methods
- Small-Animal PET/CT Assessment of Bone Microdamage in Ovariectomized Rats
- Molecular Mechanisms of Bone 18F-NaF Deposition
- Kinetic Analysis of 18F-Fluoride PET Images of Breast Cancer Bone Metastases
- Quantitative Radionuclide Studies of Bone