


Abstract
In this study, we evaluated the biodistribution of the 18F−/18F-FDG administration, compared with separate 18F-NaF and 18F-FDG administrations. We also estimated the interaction of 18F-NaF and 18F-FDG in the 18F−/18F-FDG administration by semiquantitative analysis. Methods: We retrospectively analyzed the data of 49 patients (39 men, 10 women; mean age ± SD, 59.3 ± 15.2 y) who underwent separate 18F-FDG PET/CT and 18F-NaF PET/CT scans as well as 18F−/18F-FDG PET/CT sequentially. The most common primary diagnosis was prostate cancer (n = 28), followed by sarcoma (n = 9) and breast cancer (n = 6). The mean standardized uptake values (SUVs) were recorded for 18 organs in all patients, and maximum SUV and mean SUV were recorded for all the identified malignant lesions. We also estimated the 18F−/18F-FDG uptake as the sum of 18F-FDG uptake and adjusted 18F-NaF uptake based on the ratio of 18F-NaF injected dose in 18F−/18F-FDG PET/CT. Lastly, we compared the results to explore the interaction of 18F-FDG and 18F-NaF uptake in the 18F−/18F-FDG scan. Results: The 18F−/18F-FDG uptake in the cerebral cortex, cerebellum, parotid grand, myocardium, and bowel mostly reflected the 18F-FDG uptake, whereas the uptake in the other analyzed structures was influenced by both the 18F-FDG and the 18F-NaF uptake. The 18F−/18F-FDG uptake in extraskeletal lesions showed no significant difference when compared with the uptake from the separate 18F-FDG scan. The 18F−/18F-FDG uptake in skeletal lesions reflected mostly the 18F-NaF uptake. The tumor-to-background ratio of 18F−/18F-FDG in extraskeletal lesions showed no significant difference when compared with that from 18F-FDG alone (P = 0.73). For skeletal lesions, the tumor-to-background ratio of 18F−/18F-FDG was lower than that from 18F-NaF alone (P < 0.001); however, this difference did not result in missed skeletal lesions on the 18F−/18F-FDG scan. Conclusion: The understanding of the biodistribution of radiopharmaceuticals and the lesion uptake of the 18F−/18F-FDG scan as well as the variations compared with the uptake on the separate 18F-FDG PET/CT and 18F-NaF PET/CT are valuable for more in-depth evaluation of the combined scanning technique.
PET/CT with 18F-FDG is a valuable tool for staging and monitoring response to therapy in various cancers (1). However, due to variable rates of glucose metabolism, not all cancer lesions are identified reliably (1). 18F-sodium fluoride (18F-NaF) is currently used for bone scintigraphy with integrated PET/CT scanners (2–7). The combined administration of 18F-NaF and 18F-FDG (18F−/18F-FDG) in a single PET/CT scan for cancer detection has been advocated for detecting both extraskeletal and skeletal lesions in a single visit (8,9), and the early prospective multicenter trial indicated promising results (10).
In this study, we performed a semiquantitative analysis to evaluate the biodistribution of the 18F−/18F-FDG administration, compared with the separate 18F-NaF and 18F-FDG administrations. We also investigated the relationship between uptake and several factors such as the dosage and the time from injection to imaging.
MATERIALS AND METHODS
Patients
The local Institutional Review Board and Cancer Center Scientific Review Committee approved the study. Written informed consent was obtained from all patients. Between September 2007 and December 2013, 79 consecutive participants with pathologically proven malignancy underwent 18F−/18F-FDG PET/CT and separate 18F-FDG PET/CT and 18F-NaF PET/CT. From these, we included only those with time from tracer injection to imaging within 30 min between 18F−/18F-FDG PET/CT and 18F-FDG PET/CT as well as between 18F−/18F-FDG PET/CT and 18F-NaF PET/CT. Forty-nine patients (men, 39; women, 10; age range, 19–84 y; mean age, 59.3 ± 15.2 y) fit the inclusion criteria for this analysis and were previously reported for feasibility of the scanning method (8). The primary diagnosis included prostate cancer (n = 28), sarcoma (n = 9), breast cancer (n = 6), colon cancer (n = 1), lung carcinoma (n = 1), bladder cancer (n = 1), gastrointestinal stromal tumor (n = 1), renal cell cancer (n = 1), and urothelial cancer (n = 1).
PET/CT Protocol
The patients were scanned on a Discovery LS, 600, or 690 scanner (GE Healthcare). There were only small (<10%) differences in standardized uptake value (SUV) measurements between scanners based on data from phantom studies. All 3 scans were acquired on the same scanner for all patients. Patients were asked to fast for 6 h before injection of 18F-FDG and 18F−/18F-FDG. No patient preparation was required for the 18F-NaF PET/CT scans. For the 18F−/18F-FDG PET/CT scans, the 2 radiotracers were delivered from the local cyclotron facilities in separate syringes and administered sequentially, without delay. For all PET/CT scans, total body (vertex to toes) PET/CT images were obtained in 2-dimensional mode for Discovery LS and 3-dimensional mode for Discovery 600 and 690, with the patients’ arms at their sides. The PET images were reconstructed with a standard iterative algorithm (ordered-subset expectation maximization, 2 iterative steps and 28 subsets for Discovery LS, 2 iterative steps and 32 subsets for Discovery 600, and 2 iterative steps and 24 subsets for Discovery 690).
Image Analysis
Images were the reformatted into axial, coronal, and sagittal views and reviewed by 2 board-certified nuclear medicine physicians using MIMvista software (MIMvista Corp.) to determine the uptake in normal tissues and lesions. A board-certified nuclear medicine physician with 8 y experience in PET/CT diagnosis placed regions of interest (ROIs) in the frontal lobe cortex, cerebellum, parotid grand, lung, myocardium, left atrium cavity (blood pool), liver, spleen, pancreas, kidney, bowel (cecum), trapezius muscle, gluteus maximus muscle, gluteal fat, third cervical vertebrae, ninth thoracic vertebrae, third lumbar vertebrae, and sacrum. Circular ROIs (diameter, 10–30 mm) were then drawn on transaxial PET images and carefully positioned over the central portion of each normal structure depicted on the PET/CT image. For the myocardium, a circular ROI with a 10-mm diameter was placed on the lateral wall of the left atrium, with the edge adjusted to be outside the edge placed for blood-pool ROI. For the blood pool, a circular ROI with a 20-mm diameter was placed centrally within the left atrium at the level of its widest diameter. An ROI with a diameter of 30 mm was placed on the right liver lobe, but it was changed to the left lobe in 2 cases with intensely 18F-FDG–avid metastases in the right hepatic lobe. If metastases were present at the measurement site, ROIs were placed in the opposite area if the structure was symmetric. For metastases seen in the third cervical vertebrae, ninth thoracic vertebrae, and third lumbar vertebrae, ROIs were placed in the adjacent vertebra.
For SUV measurements of malignant lesions, radiologic reports of the separate 18F-FDG PET/CT, 18F-NaF PET/CT, 99mTc-methylene diphosphonate bone scan, and contrast-enhanced CT as well as clinical follow-up were used to confirm the diagnosis. The CT portion of PET/CT was used for determining the characterization of bone lesions as osteoblastic or osteolytic (including mixed type). The PETedge tool of the MIMvista software was used for SUV measurements in malignant lesions. ROIs for organs were first drawn on 18F−/18F-FDG PET/CT scans with the reference to anatomic structure confirmed by the CT portion of the PET/CT image, and after that the exact same size and shape ROI was put on the 18F-FDG PET/CT and 18F-NaF PET/CT scans. The measurements for SUV in lesions were performed up to 6 lesions per scan in decreasing order of maximum SUV (SUVmax).
Data Analysis
For the calculation of SUV, imputed injection dose for 18F−/18F-FDG PET/CT was set as just the dose of 18F-FDG used in the 18F−/18F-FDG PET/CT scan. First, we compared the 18F−/18F-FDG uptake with the 18F-FDG uptake from 18F-FDG PET/CT images, to estimate the influence of 18F-NaF on various organs. If there was no significant difference in the SUV between 18F−/18F-FDG uptake and 18F-FDG uptake, we estimated the region to be mainly the result of the 18F-FDG uptake. In contrast, if the significant differences in the SUV measurement between 18F−/18F-FDG uptake and 18F-FDG uptake were confirmed, we estimated the region as being influenced by both 18F-FDG and 18F-NaF uptake. Next we adjusted the SUV (mean SUV [SUVmean] or SUVmax) of 18F-NaF for each region based on the ratio of 18F-NaF injected dose in 18F−/18F-FDG PET/CT as follows: After this, we created estimates of
  uptake value by adding the
  uptake value (
 or
or  ) to adjusted
  uptake value (
 or
or  ) as follows:
 Finally, we compared the estimated uptake value with the uptake of actual 18F−/18F-FDG PET/CT.
Statistical Analysis
The data regarding time after injection, injection dose of PET tracers, and SUV are presented as mean ± SD. The Mann–Whitney test was used to compare the difference of injection dose and the scanning start time after PET tracer injection. Pearson correlation coefficient analysis was used for PET uptake and time after injection and among PET uptake including estimated uptake value of 18F−/18F-FDG PET/CT. The Wilcoxon signed-rank test was performed between 18F−/18F-FDG PET/CT, 18F-FDG PET/CT, 18F-NaF PET/CT, and estimated 18F−/18F-FDG PET/CT data to assess the statistical significance of differences between the SUV measurements. All statistical analyses were done with Stata 11 (Stata). Two-tailed P values of less than 0.05 were considered significant.
RESULTS
18F-FDG and 18F-NaF doses used in 18F−/18F-FDG PET/CT were statistically lower than the doses used in 18F-FDG PET/CT (P = 0.0001) and 18F-NaF PET/CT (P = 0.0003) (Table 1). The time from injection to imaging of 18F−/18F-FDG PET/CT images was not statistically different from those of 18F-FDG (P = 0.54) and 18F-NaF (P = 0.52) (Table 1). The difference in time of starting PET/CT was not significant between 18F−/18F-FDG PET/CT and 18F-FDG PET/CT (P = 0.55) and between 18F−/18F-FDG PET/CT and 18F-NaF PET/CT (P = 0.53).
Details of 3 Types of PET Scans
No significant correlation was noted between uptake and the time from injection to imaging (Table 2). There were no significant difference of SUVmean between 18F−/18F-FDG and 18F-FDG uptake for the cerebral cortex (P = 0.32), cerebellum (P = 0.51), parotid grand (P = 0.77), myocardium (P = 0.94), and bowel (P = 0.30) (Table 3). Therefore, the 18F−/18F-FDG PET/CT uptake in these organs was estimated to be mainly related to the 18F-FDG uptake. In contrast, the other analyzed organs were estimated to be influenced either by 18F-FDG and 18F-NaF uptake or by only 18F-NaF uptake.
Radiopharmaceutical Uptake (SUVmean) for Studied Organs, Based on Time from Injection to Imaging
SUVmean Measurements from PET Scans
No significant differences were noted between actual 18F−/18F-FDG uptake and estimated 18F−/18F-FDG uptake in analyzed organs except the parotid grand related to 18F-FDG (P < 0.003) and kidney (P < 0.02) (Table 4). Moreover, the correlation between actual 18F−/18F-FDG uptake and estimated 18F−/18F-FDG uptake was higher than the correlation between actual 18F−/18F-FDG uptake and 18F-FDG uptake. The representative image and the SUV of lesions are shown in Figure 1.
SUVmean of 18F−/18F-FDG in Studied Organ and Differences from Estimated 18F−/18F-FDG Values
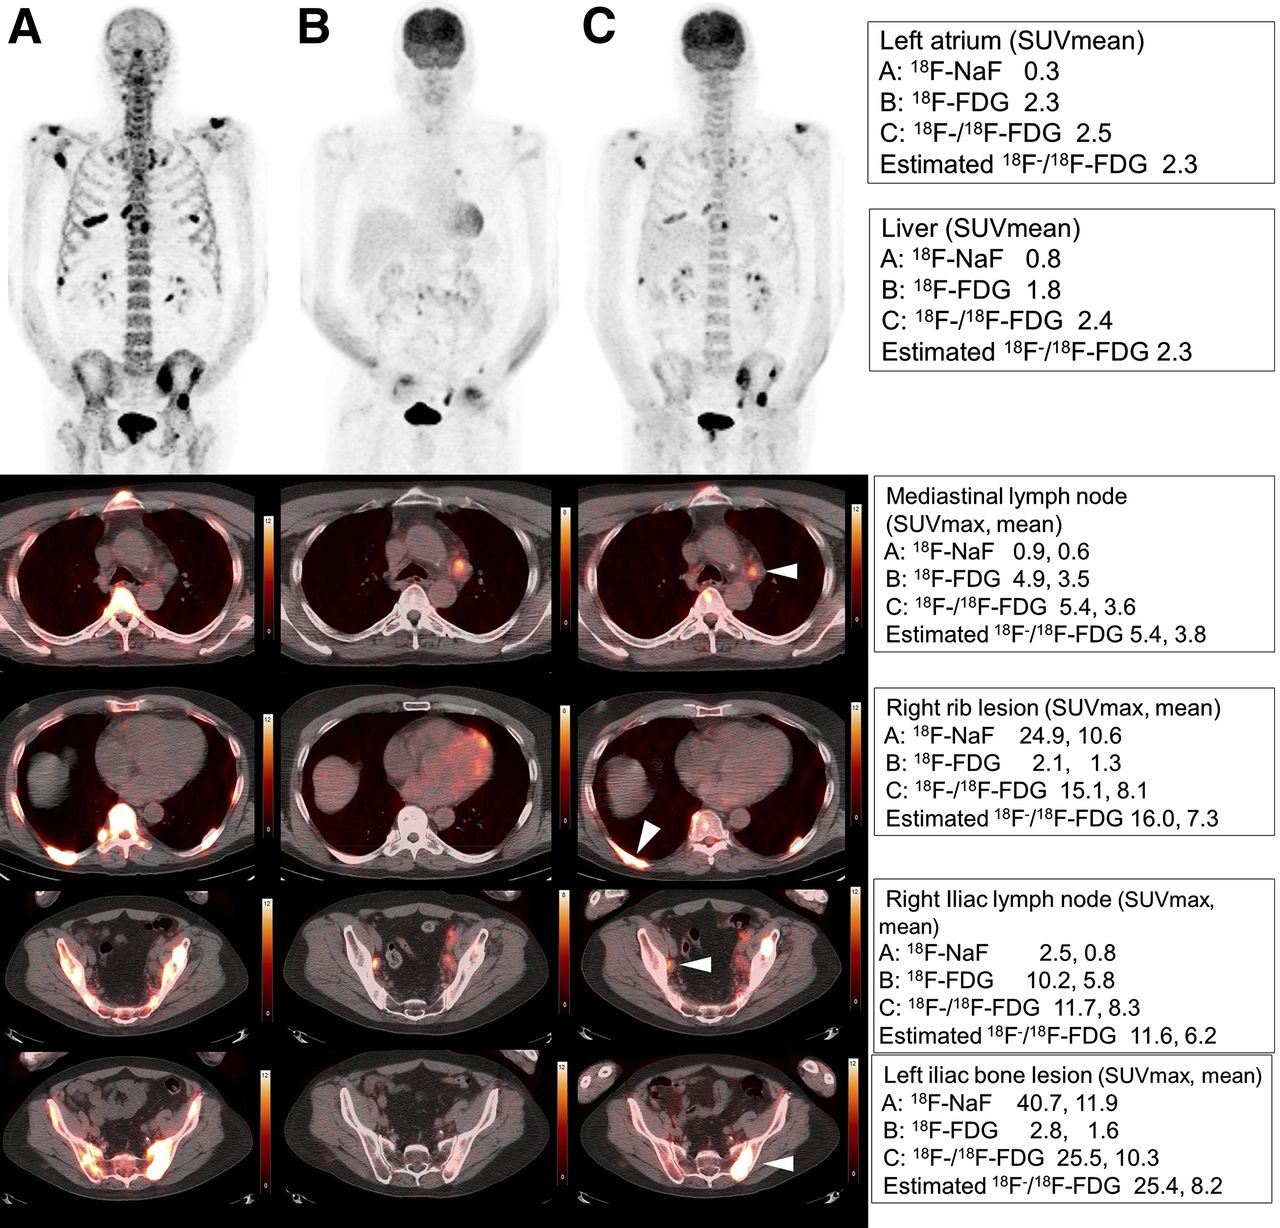
A 65-y-old man with metastatic prostate cancer. (A) 18F-NaF. (B) 18F-FDG. (C) 18F−/18F-FDG. SUVmax or SUVmean of left atrium, liver, mediastinal lymph node, right rib lesion, left iliac lymph node, and left iliac bone lesion were shown for 18F-NaF, 18F-FDG, and estimated 18F−/18F-FDG, respectively.
The actual 18F−/18F-FDG uptake in extraskeletal lesions was higher than the 18F-FDG uptake, but this difference has no significance (P = 0.30). High correlation was confirmed between 18F−/18F-FDG uptake and 18F-FDG uptake. Therefore, the influence of 18F-NaF uptake in 18F−/18F-FDG uptake was estimated to be small (Table 5). In extraskeletal lesions, the T/B ratio from 18F−/18F-FDG was not significantly different from that of 18F-FDG (P = 0.73) (Table 6). The SUVmean in skeletal lesions, regardless of the primary cancer type and the characteristic of the lesion (osteoblastic or osteolytic), was highly influenced by 18F-NaF uptake, estimated from the quite large difference of uptake between 18F−/18F-FDG and 18F-FDG (Table 5). Regardless of the primary lesion and characteristic of lesion, T/B ratios of 18F−/18F-FDG for skeletal lesions were statistically lower than the T/B ratio of 18F-NaF (P < 0.001) (Table 6). However, this difference did not change the diagnostic ability of 18F−/18F-FDG PET/CT for the detection of bone lesions, as previously reported (9).
SUVmean and SUVmax Measured from PET Scans and Estimated 18F−/18F-FDG Uptake in Lesions
T/B Ratios from PET Scans and Estimated 18F−/18F-FDG Measurements
DISCUSSION
18F-FDG PET/CT interpretation has relied predominantly on the nuclear medicine physician’s experience and knowledge, but using semiquantitative measurement has an advantage to add consistency among interpreters. Our 18F-FDG biodistribution analysis was consistent with previous results (11–14), and our 18F-NaF uptake data are similar to those from previous reports analyzing the 18F-NaF uptake in normal bone (15,16).
The 18F-NaF PET/CT image showed intense uptake in the skeleton, indicating that 18F−/18F-FDG uptake in the bony structures was mainly a reflection of 18F-NaF uptake. Compared with bone uptake, the other organs had much lower 18F-NaF uptake, as expected. 18F−/18F-FDG uptake in the blood pool was significantly higher than 18F-FDG uptake, possibly reflecting additional 18F-NaF present in the blood pool. However, these uptake values are within a small range, which is unlikely to influence the visual interpretation.
Our study also looked at 18F−/18F-FDG uptake in the lung, pancreas, muscle, and fat, indicating an influence of 18F-NaF uptake on both the 18F-FDG and the 18F-NaF uptake. We estimated 18F−/18F-FDG uptake as the sum of uptake values and adjusted the 18F-NaF uptake value based on the injection dose of 18F-FDG and 18F-NaF. In all the organs with uptake influenced by both the 18F-FDG and the 18F-NaF uptake, the estimated 18F−/18F-FDG uptake showed no significant difference with the actual 18F−/18F-FDG uptake measurements. This indicates that 18F-FDG and 18F-NaF did not have synergistic or offset effect on the 18F−/18F-FDG PET/CT within the scan time range evaluated in this study.
Osteoblastic lesions generally showed low 18F-FDG uptake; in contrast, osteolytic lesions tend to show high 18F-FDG uptake (17,18). 18F-NaF PET/CT has the opposite pattern of uptake (19); therefore, 18F-FDG and 18F-NaF PET have drawbacks and advantages for the evaluation of bone lesions and the combination of the 2 provides an advantageous approach for the evaluation of cancer (20,21). In addition, in the era of PET/CT, the information from the CT component has additional value in terms of increasing the specificity of the examination (22). The combined administration of 18F−/18F-FDG in a single PET/CT can detect both extraskeletal and skeletal lesions in a single scan, indicating the potential for 1-stop-shop examination for cancer staging (9,10).
A limitation of this study was the selection bias toward patients with known cancers. Although there were no significant difference of SUV in most organs in this study, variations in injected dosage, time from injection to imaging, and lack of direct measurements such as arterial sampling and dynamic imaging were additional limitations in this assessment. Scans conducted at different times after injection might result in significantly different average SUVs of malignant lesion. The optimal ratios of 18F-NaF to 18F-FDG in 18F−/18F-FDG PET/CT scan have been an issue for this combined method. According to a preclinical study, the optimal ratio of 18F-NaF to 18F-FDG was 1–5 for the contrast resolution (23). Although further clinical studies are required to confirm these assessments, our results and methodology in this study may contribute to this work.
CONCLUSION
The understanding of the biodistribution of radiopharmaceuticals and the lesion uptake of the 18F−/18F-FDG scan, as well as the variations, compared with the uptake on the separate 18F-FDG PET/CT and 18F-NaF PET/CT are valuable for more in-depth evaluation of the combined scanning technique.
DISCLOSURE
The costs of publication of this article were defrayed in part by the payment of page charges. Therefore, and solely to indicate this fact, this article is hereby marked “advertisement” in accordance with 18 USC section 1734. No potential conflict of interest relevant to this article was reported.
Acknowledgments
We thank our research coordinator Euodia Jonathan; Jarrett Rosenberg, PhD, for statistical support; Frederick Chin, PhD; the staff at the Lucas Cyclotron; and the technologists in the Division of Nuclear Medicine and Molecular Imaging. We extend special thanks to all our patients and their families.
Footnotes
Published online Apr. 3, 2015.
- © 2015 by the Society of Nuclear Medicine and Molecular Imaging, Inc.
REFERENCES
- Received for publication January 6, 2015.
- Accepted for publication March 12, 2015.


Jump to section
Related Articles
Cited By...
- Bone-Targeted Imaging and Radionuclide Therapy in Prostate Cancer
- Imaging Bone Metastases in Breast Cancer: Staging and Response Assessment
- Prospective Comparison of 99mTc-MDP Scintigraphy, Combined 18F-NaF and 18F-FDG PET/CT, and Whole-Body MRI in Patients with Breast and Prostate Cancer
- 18F-Fluoride PET in the Assessment of Malignant Bone Disease