


Abstract
Semiquantitative standard uptake values (SUVs) are used for tumor diagnosis and response monitoring. However, the accuracy of the SUV and the accuracy of relative change during treatment are not well documented. Therefore, an experimental and simulation study was performed to determine the effects of noise, image resolution, and region-of-interest (ROI) definition on the accuracy of SUVs. Methods: Experiments and simulations are based on thorax phantoms with tumors of 10-, 15-, 20-, and 30-mm diameter and background ratios (TBRs) of 2, 4, and 8. For the simulation study, sinograms were generated by forward projection of the phantoms. For each phantom, 50 sinograms were generated at 3 noise levels. All sinograms were reconstructed using ordered-subset expectation maximization (OSEM) with 2 iterations and 16 subsets, with or without a 6-mm gaussian filter. For each tumor, the maximum pixel value and the average of a 50%, a 70%, and an adaptive isocontour threshold ROI were derived as well as with an ROI of 15 × 15 mm. The accuracy of SUVs was assessed using the average of 50 ROI values. Treatment response was simulated by varying the tumor size or the TBR. Results: For all situations, a strong correlation was found between maximum and isocontour-based ROI values resulting in similar dependencies on image resolution and noise of all studied SUV measures. A strong variation with tumor size of ≥50% was found for all SUV values. For nonsmoothed data with high noise levels this variation was primarily due to noise, whereas for smoothed data with low noise levels partial-volume effects were most important. In general, SUVs showed under- and overestimations of ≥50% and depended on all parameters studied. However, SUV ratios, used for response monitoring, were only slightly dependent of ROI definition but were still affected by noise and resolution. Conclusion: The poor accuracy of the SUV under various conditions may hamper its use for diagnosis, especially in multicenter trials. SUV ratios used to measure response to treatment, however, are less dependent on noise, image resolution, and ROI definition. Therefore, the SUV might be more suitable for response-monitoring purposes.
In nuclear medicine, PET with 18F-FDG plays an important role. Several studies have shown its usefulness for staging and for measuring tumor treatment response (1–8). Semiquantitative analysis of 18F-FDG uptake using standard uptake values (SUVs) may allow for a more precise diagnosis than visual assessment and the relative change in SUV has been used as a measure of treatment response (5,6,9,10).
The first step in determining the SUV is to derive the activity concentration (AC) in the tumor. Usually, the AC is obtained by placing a region of interest (ROI) over the tumor either visually (11), automatically using a threshold value (12–16), or using a fixed size (10). Unfortunately, various ROI methods are in use, making it difficult to compare different studies. Consequently, results obtained in one institution may not apply to results from other institutions. Other factors, such as reconstruction algorithm and filter, scanner sensitivity and scan duration, sinogram noise, and partial-volume effects, can also affect the accuracy of the measured AC (17–25).
The purpose of this study was to evaluate the effects of noise, image resolution, and ROI definition on the accuracy of measured SUVs. To this end, both simulation and experimental studies were performed, allowing us to separately investigate the effects of tumor size, tumor-to-background ratio (TBR), noise, image resolution, and ROI definitions on the accuracy of the measured AC. Furthermore, the effects on the accuracy of the observed relative changes in SUV were also investigated.
MATERIALS AND METHODS
First, a phantom study was performed to verify the results obtained with the simulation studies. Next, 2 simulation studies were performed. In the first study, a range of tumor characteristics and scanning or reconstruction conditions were simulated. The second study was performed to determine the relation between noise and bias of the maximum pixel value within a tumor.
Phantom Study
An anthropomorphic thorax phantom (Data Spectrum) containing 2 lungs and a liver insert was used. The large background compartment (soft tissue) was filled with an 18F-FDG solution of 5 kBq/mL. Spheres, representing tumors of 8, 12, and 30 mm, were filled with an 18F-FDG solution of 20 kBq/mL (TBR = 4) and positioned in the mediastinum region of the phantom. Twenty-five 2-dimensional (2D) emission scans, each of 900 kilocounts, corresponding to the average number of counts observed in 5-min patient scans, were acquired using an ECAT HR+ scanner (CTI/Siemens) (26,27). By performing acquisitions terminated on the number of acquired counts, statistically equivalent sinograms were obtained, allowing for reproducibility assessment. A 5-min transmission scan was acquired for attenuation correction. Data were reconstructed using ordered-subset expectation maximization (OSEM) with 2 iterations and 16 subsets (18). Gaussion filters of 0- and 6-mm full width at half maximum (FWHM) were used to match the image resolutions used in the simulations.
Simulation Study I: SUV Accuracy and Relative Change
A mathematic phantom was derived from a 2D dynamic 18F-FDG PET scan of a patient. The patient data were summed from 15 to 45 min, and the resulting sinogram was reconstructed using OSEM with 2 iterations and 16 subsets and postsmoothed using a 6-mm FWHM gaussian filter. Subsequently, pixel values were scaled to an AC of ∼5 kBq/mL, corresponding to the average soft-tissue AC in patient studies. In this mathematic phantom, tumors were simulated with spheres. Tumor sizes of 10-, 15-, 20-, and 30-mm diameter were used to cover the lower part of the clinically relevant range, as determination of the SUV is most challenging for small tumors. Tumors were located in the breast and lung. TBRs of 2, 4, and 8 (10, 20, and 40 kBq/mL) were applied. The size of the mathematic phantom corresponds to that of a patient of about 80 kg.
Next, noise-free sinograms were generated by forward projection of the image. These sinograms represented the number of true coincidences. Random and scattered coincidences were added to obtain prompts. Randoms were assumed to be distributed uniformly over the sinogram. Scattered coincidences were derived from forward projecting the difference between a scatter-corrected and a noncorrected image. Poisson noise was added to all sinograms. True coincidence sinograms were generated by subtracting the noisy random and scatter sinograms from the noisy prompts sinograms. Three noise levels were simulated corresponding to 2D data obtained for 3–5, 7–10, and 30–40 min or 0.75E+7, 1.5E+7, and 6.0E+7 noise equivalent counts (NEC) (28), respectively. For each combination of tumor size, TBR, and noise level, 50 noisy sinograms were generated to evaluate reproducibility and bias of the SUVs.
All sinograms were reconstructed using OSEM with 2 iterations and 16 subsets (ECAT version 7.2; CTI/Siemens). Image matrix sizes of 128 × 128 or 256 × 256, corresponding to pixel sizes of 5.12 × 5.12 and 2.56 × 2.56 mm, were used. Reconstructed images were postsmoothed using a gaussian filter such that image resolutions equaled 5- and 8-mm FWHM.
Finally, the phantom was adjusted by 25% to simulate patient weights of 60 and 100 kg, respectively. The number of acquired counts was adjusted using an empirically derived relation between patient weight and the counts-per-minute emission scan.
Simulation Study II: Noise and Bias
To assess the relations between SUV, tumor size, and noise, a simulation was performed using a uniform phantom containing an AC of 5 kBq/mL. Various noise levels, obtained by adding Poisson noise to the simulated sinograms, were applied, resulting in coefficients of variation (COVs) of ∼0%, 10%, 20%, 35%, and 50%. For each noise level, 100 simulations were performed. Spheric 3-dimensional (3D) ROIs of 11, 15, 21, 32, 39, and 50 mm in diameter were projected onto these images, and the maximum pixel value within each ROI was derived. The average maximum pixel value and its SE for each ROI size over the 100 simulations per noise level were calculated. These average values were normalized to true AC (5 kBq/mL).
Data Analysis
The same ROI methods were used for the phantom and the simulation study:
3D isocontour at 50% of maximum pixel value within tumor (ROI50);
3D isocontour at 70% of maximum pixel value (ROI70);
3D isocontour half way between background and maximum pixel value (ROI0.5(Max+BG));
Maximum pixel value only;
15 × 15 mm square ROI centered on the location of maximum pixel value (ROI15×15).
These ROIs cover the various types of ROIs that are in regular use (12–15,29). Manual definition of ROIs (30) was not attempted, because it was impossible (∼21,600 ROIs) for the present study. Moreover, other studies have shown that automatic definition of the ROI improves the interobserver reproducibility and accuracy of the measured AC (14). ROI0.5(Max+BG) was chosen because this ROI theoretically corresponds most closely to the actual tumor size. Furthermore, definition of ROI50 is not always possible for small tumors with low uptake, where ROI50 is lower than the background AC. ROI0.5(Max+BG) avoids this problem. ROI15×15 was included as a representative of a fixed-sized ROI (10).
Fifty AC values for the simulation study data and 25 for the phantom data were obtained for each combination of ROI, tumor size, TBR, tumor location, noise level, reconstruction matrix, and resolution. The accuracy of the observed AC was obtained from the average value over 50 simulated or 25 measured data. The recovery coefficient is defined here as the ratio between the observed AC and the true simulated AC. Note that the recovery coefficient may be larger than 1.0, indicating an overestimation of the actual AC.
The accuracy of measured relative changes, simulating treatment response, was investigated using the same simulation. Two situations were considered: (a) tumors of 10- and 30-mm diameter with a decrease in uptake, but no variation in size; and (b) tumors with TBR = 2 or 8 with a decrease in tumor size, but not in 18F-FDG uptake.
Definition of “Defaults”
An extensive amount of data was generated by the simulations and phantom studies. Therefore, unless stated otherwise, results presented here are limited to a default situation:
TBR = 4;
Patient weight of 80 kg;
Noise level corresponding to 5- to 7-min 2D scans or 1.5E+7 NEC;
OSEM reconstructions with matrix size = 128 × 128 and 6-mm FWHM gaussian smoothing.
RESULTS
Phantom Study
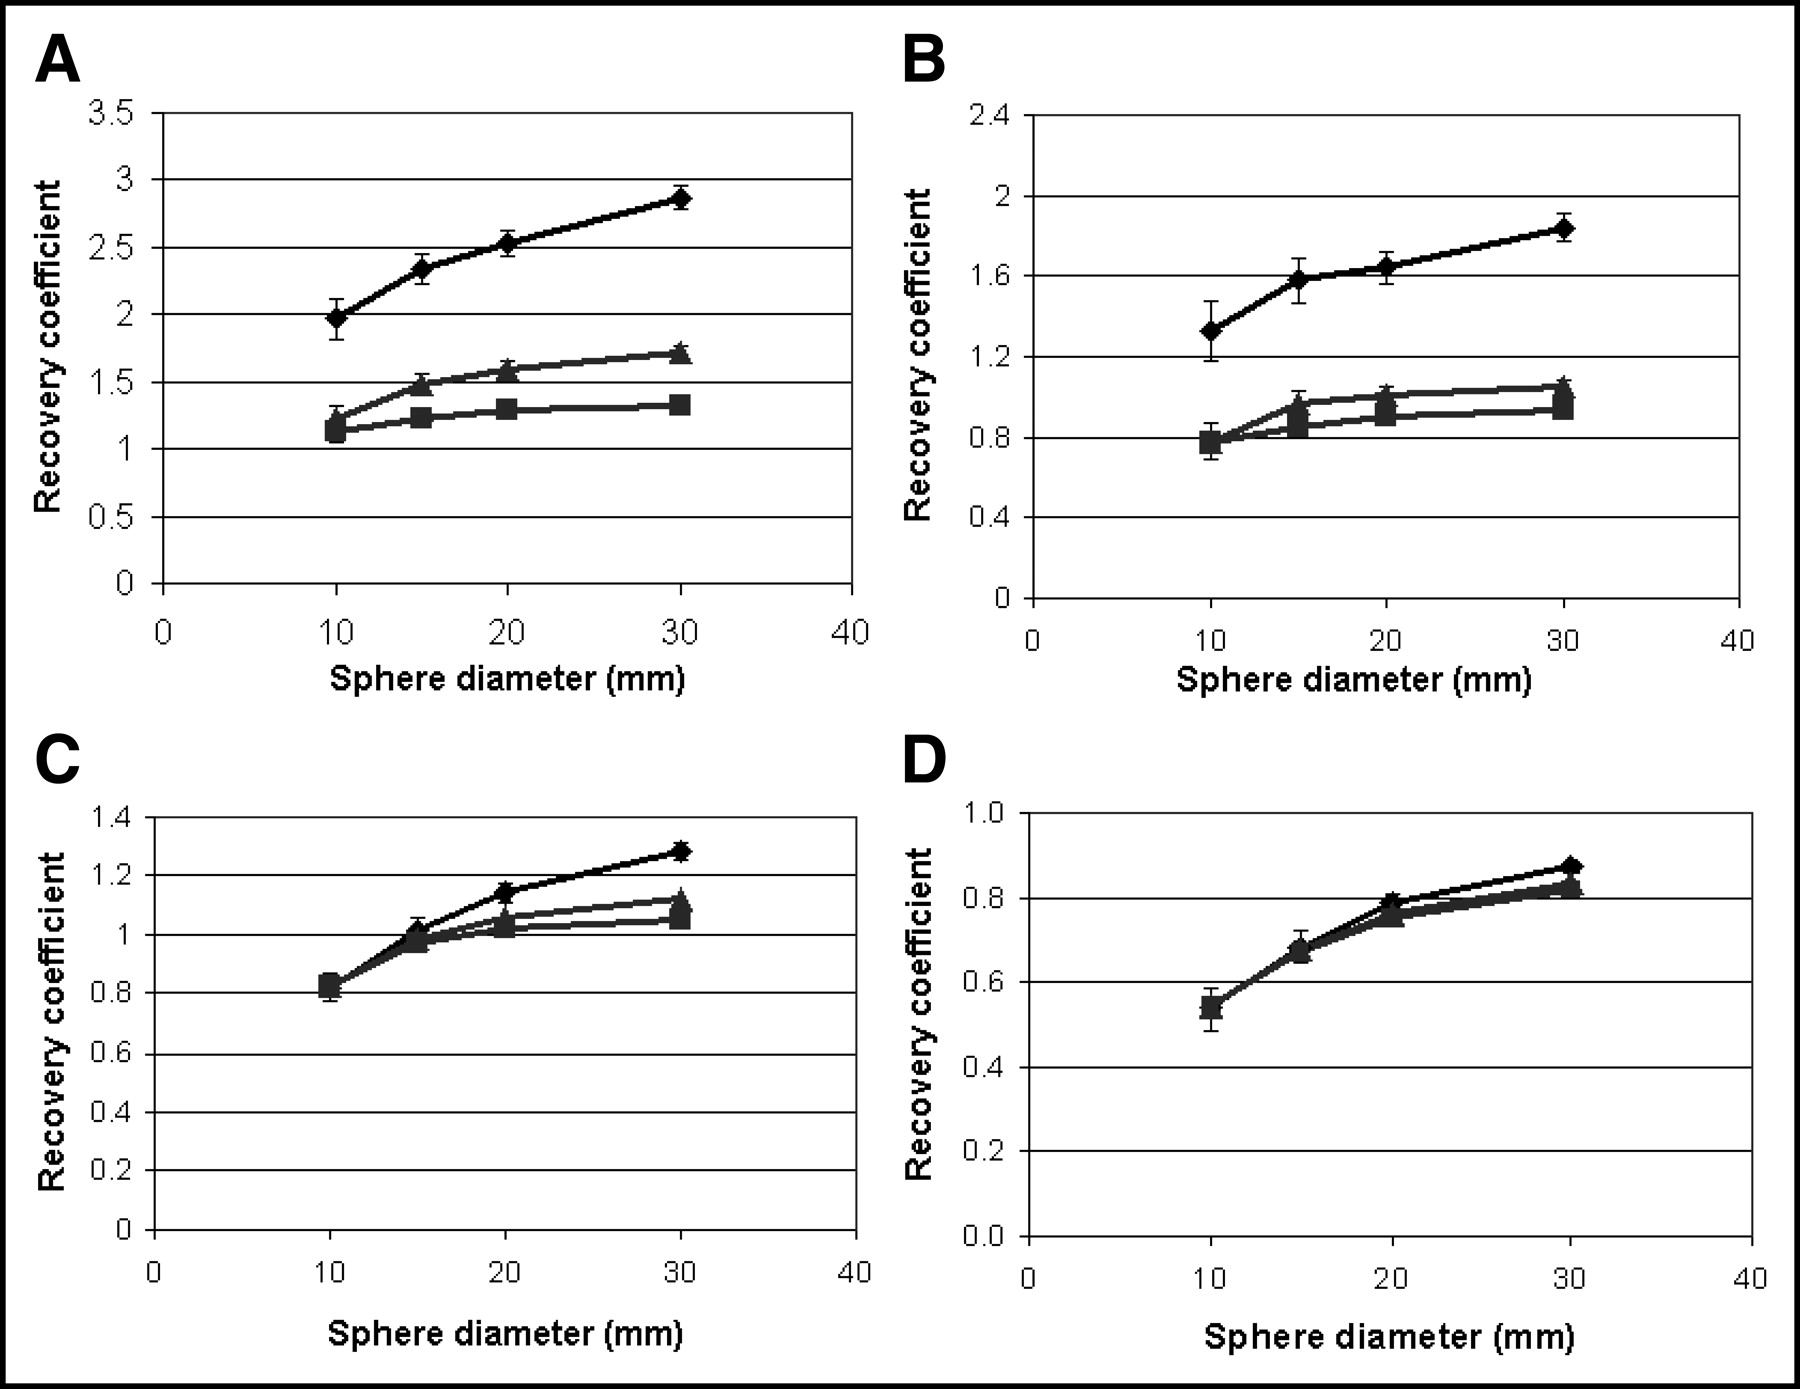
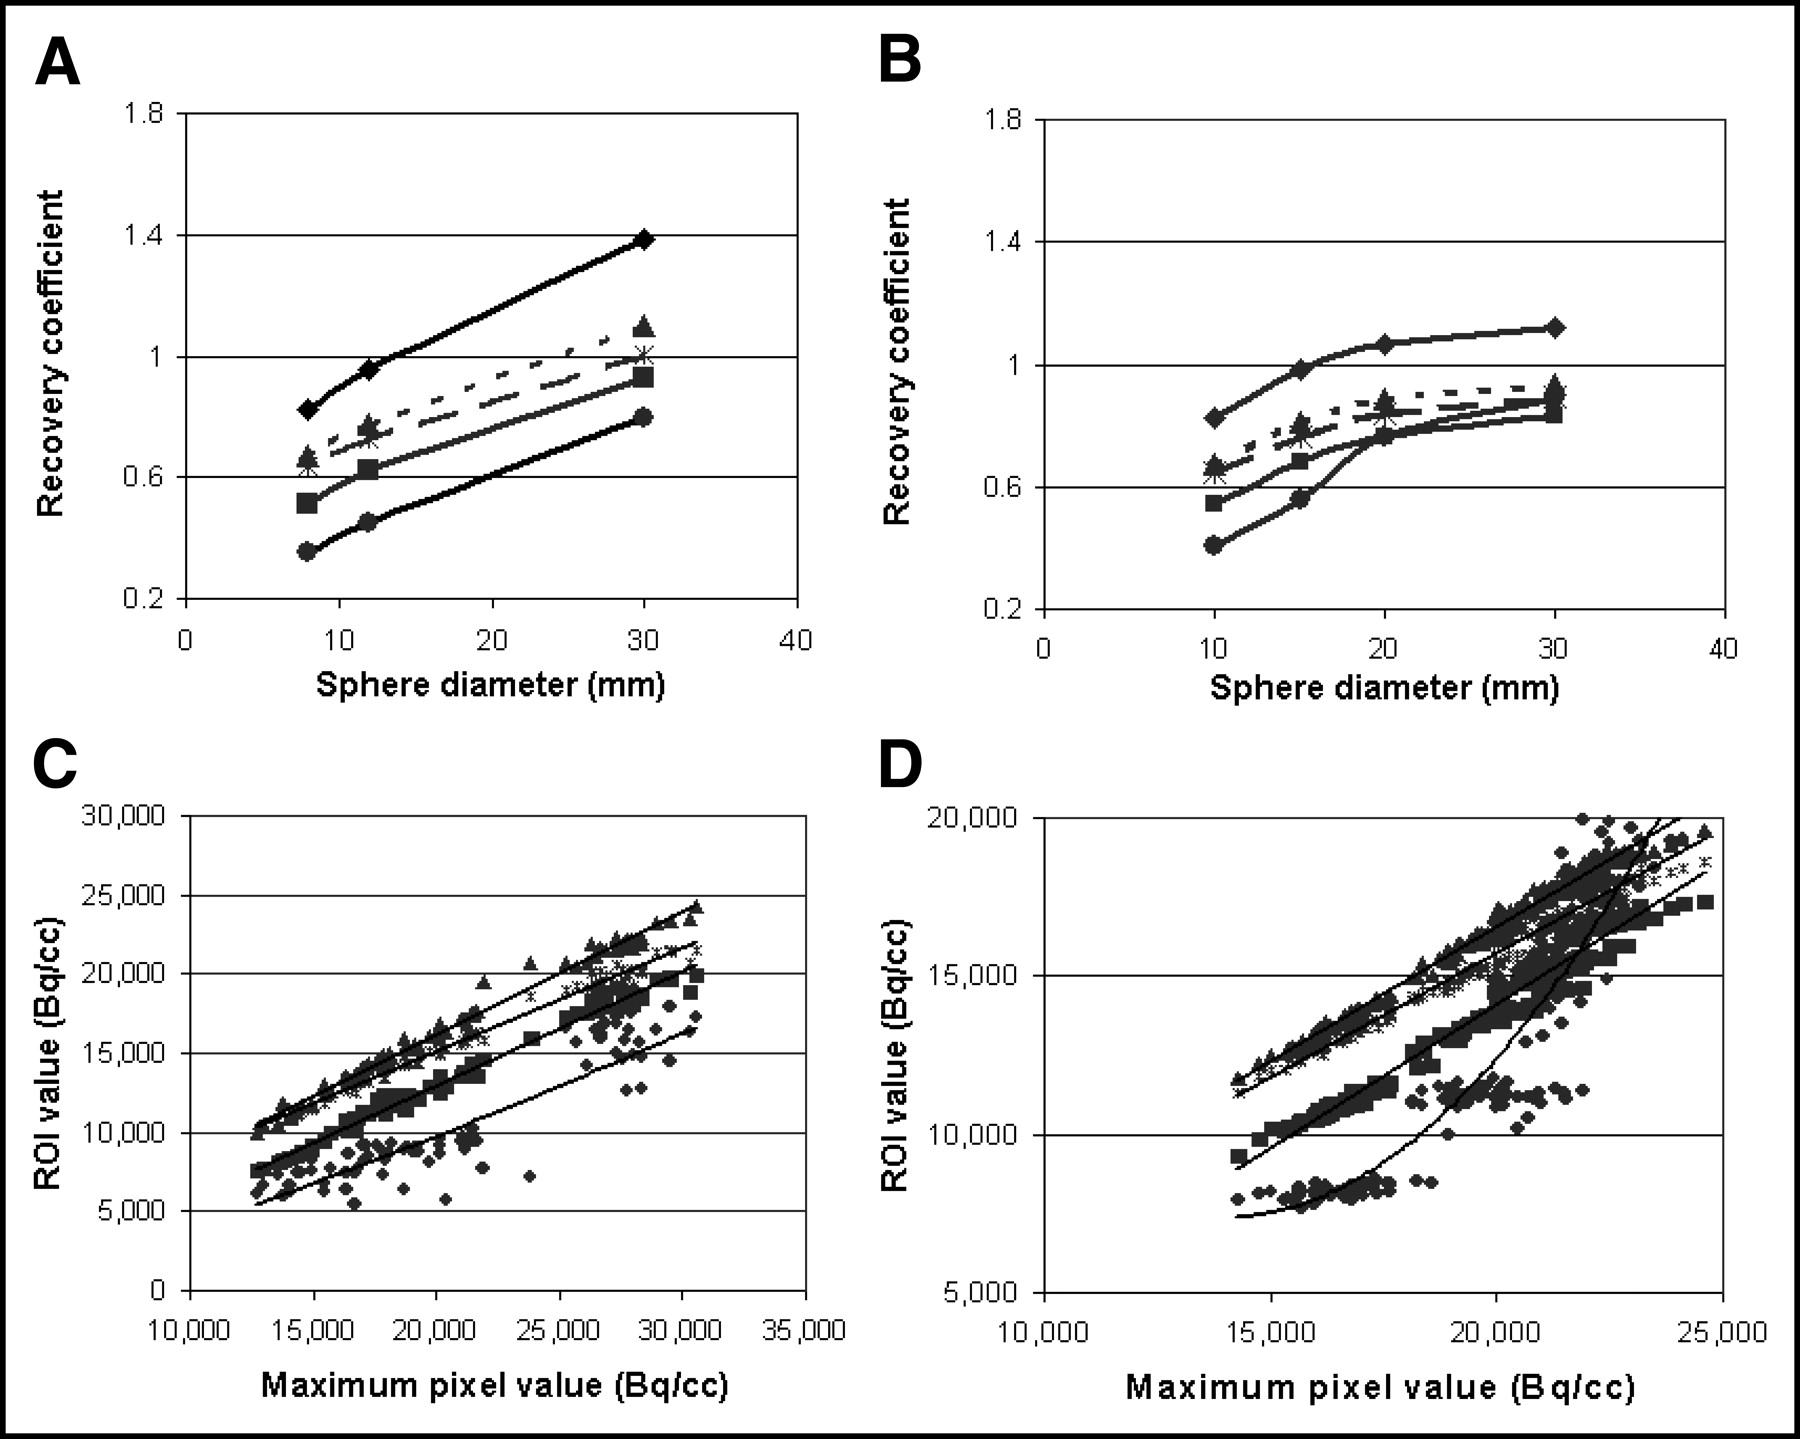
Figure 1A shows the recovery coefficient as a function of tumor size using different ROIs. In Figure 1B, corresponding data are shown for the simulation study. Recovery coefficients increase with tumor size for all ROI methods. Use of the maximum pixel value did not reduce the variation of measured AC with tumor size. Recovery coefficients obtained with ROI0.5(Max+BG) were almost equal to ROI50 data for large tumors and to ROI70 data for small tumors.

Recovery coefficients as function of sphere size for phantom data (A) and simulation data (B) and ROI values as function of maximum pixel value for phantom data (C) and simulated data (D). ♦ (A and B only) = maximum pixel value; ▴ = ROI70; ★ = ROI0.5(BG+MAX); ▪ = ROI50; • = ROI15×15.
In Figures 1C and 1D, the AC measured with threshold and 15 × 15 mm ROIs is plotted against the maximum pixel value for each of the 25 measurements and 50 simulations for all tumor sizes. A strong correlation among various measures of AC can be seen. Second, reproducibilities are similar for the maximum pixel value and all mean values based on threshold-based isocontour ROIs (data are almost located on a straight line). Note that use ROI15×15 resulted in the largest underestimations of AC due to the relatively small tumor sizes applied in this study. Furthermore, ROI15×15 showed the poorest correlation with maximum pixel value. For small spheres, this ROI included too many background pixels and, in the remainder of this study, it will only be used for the assessment of the accuracy of relative change. In general, consistent variations of SUV with the sphere size and ROI method were found between phantom and simulation studies, and the rest of this article focuses on simulation data only.
Simulation Study I: SUV Accuracy
Results obtained for breast tumors were almost identical to lung tumor data. For lung tumors, recovery coefficients were slightly lower due to a larger contrast with background activity. Therefore, results are presented for simulated breast tumors only.
Figures 2A–2D show recovery coefficients for data obtained with various noise levels and different image resolutions. For clarity, data based on maximum pixel value and ROI50 are presented, as intermediate results were obtained for other thresholds. Figure 2A shows that use of maximum pixel values resulted in large overestimations of the AC, which increased with higher noise levels. A similar variation with noise levels was found for ROI50 values (Fig. 2B), but these were more in agreement with the actual AC. For smoothed data (Figs. 2C and 2D), differences in recovery coefficients between various noise levels were much smaller, due to the noise-suppressing effect of smoothing. Substantial variations of recovery coefficient with tumor size were found for both smoothed and nonsmoothed data.
Recovery coefficients as function of sphere size for various noise levels. ♦ = low NEC; ▴ = medium NEC; ▪ = high NEC. (A and B) No smoothing of images. (C and D) Smoothing of images. A and C represent maximum pixel value; B and D represent ROI50. Error bars equal 1 SD.
Figures 3A–3D demonstrate the effect of isocontour values on the recovery coefficient and its variation with tumor size for TBR equal to 2 and 8 and for 2 different image resolutions. For TBR = 2, ROI50M−BG agreed most with ROI70 data; for TBR = 8, the best agreement with ROI50 was found. Furthermore, for smoothed data, ROI50 could not be defined for the smallest 2 tumors of 10 and 15 mm in the case of TBR = 2, because it included the entire phantom.
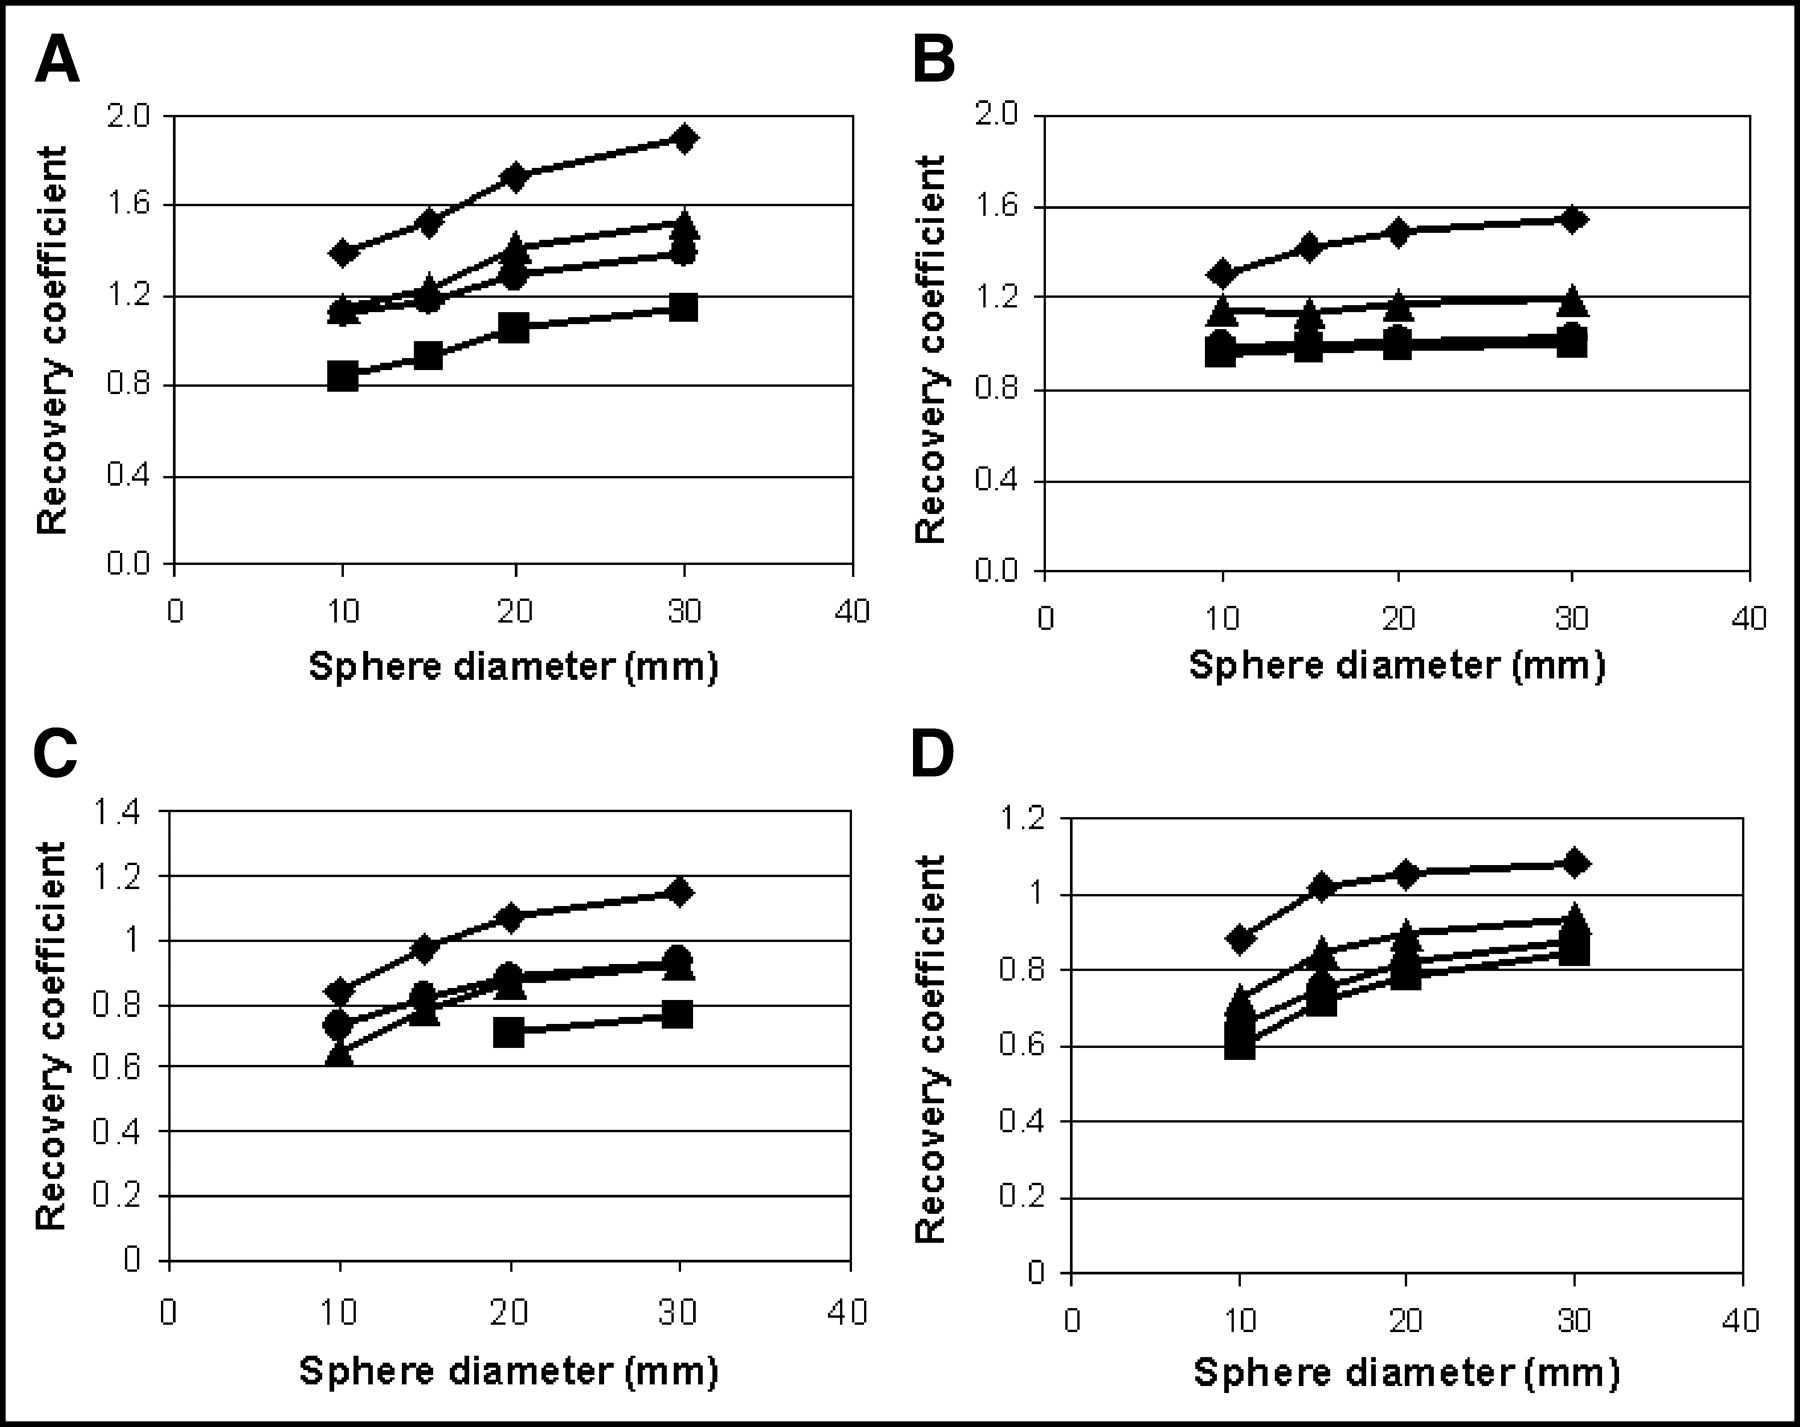
Recovery coefficients for various ROIs. ♦ = maximum pixel value; ▴ = ROI70; • = ROI0.5(BG+MAX); ▪ = ROI50. A and C represent data for TBR = 2; B and D represent data for TBR = 8. (A and B) Nonsmoothed data. (C and D) Smoothed data. SEs varied from ∼9% to ∼4% and from ∼5% to ∼2% for 10- to 30-mm spheres for all ROI methods for nonsmoothed (A and B) and smoothed data (C and D), respectively.
Image matrix (pixel size) affects both noise and image resolution. Data presented in Table 1 indicate that the AC obtained with maximum pixel values and ROI50 strongly depends on image matrix size and width of the smoothing kernel. For data with an image resolution of 8-mm FWHM, the effect of pixel size is smaller than for those with a resolution of 5-mm FWHM.
Effects of Image Resolution and Matrix Size on Recovery Coefficient as Function of Sphere Size
The effects of patient weight are given in Table 2. Up to ∼20% higher and ∼10% lower ACs were found at a 25% decrease or increase of patient weight. For smoothed data, differences are <5%.
Effects of Image Resolution and Patient Weight on Recovery Coefficient as Function of Sphere Size
Simulation I: Relative Change or Response Monitoring
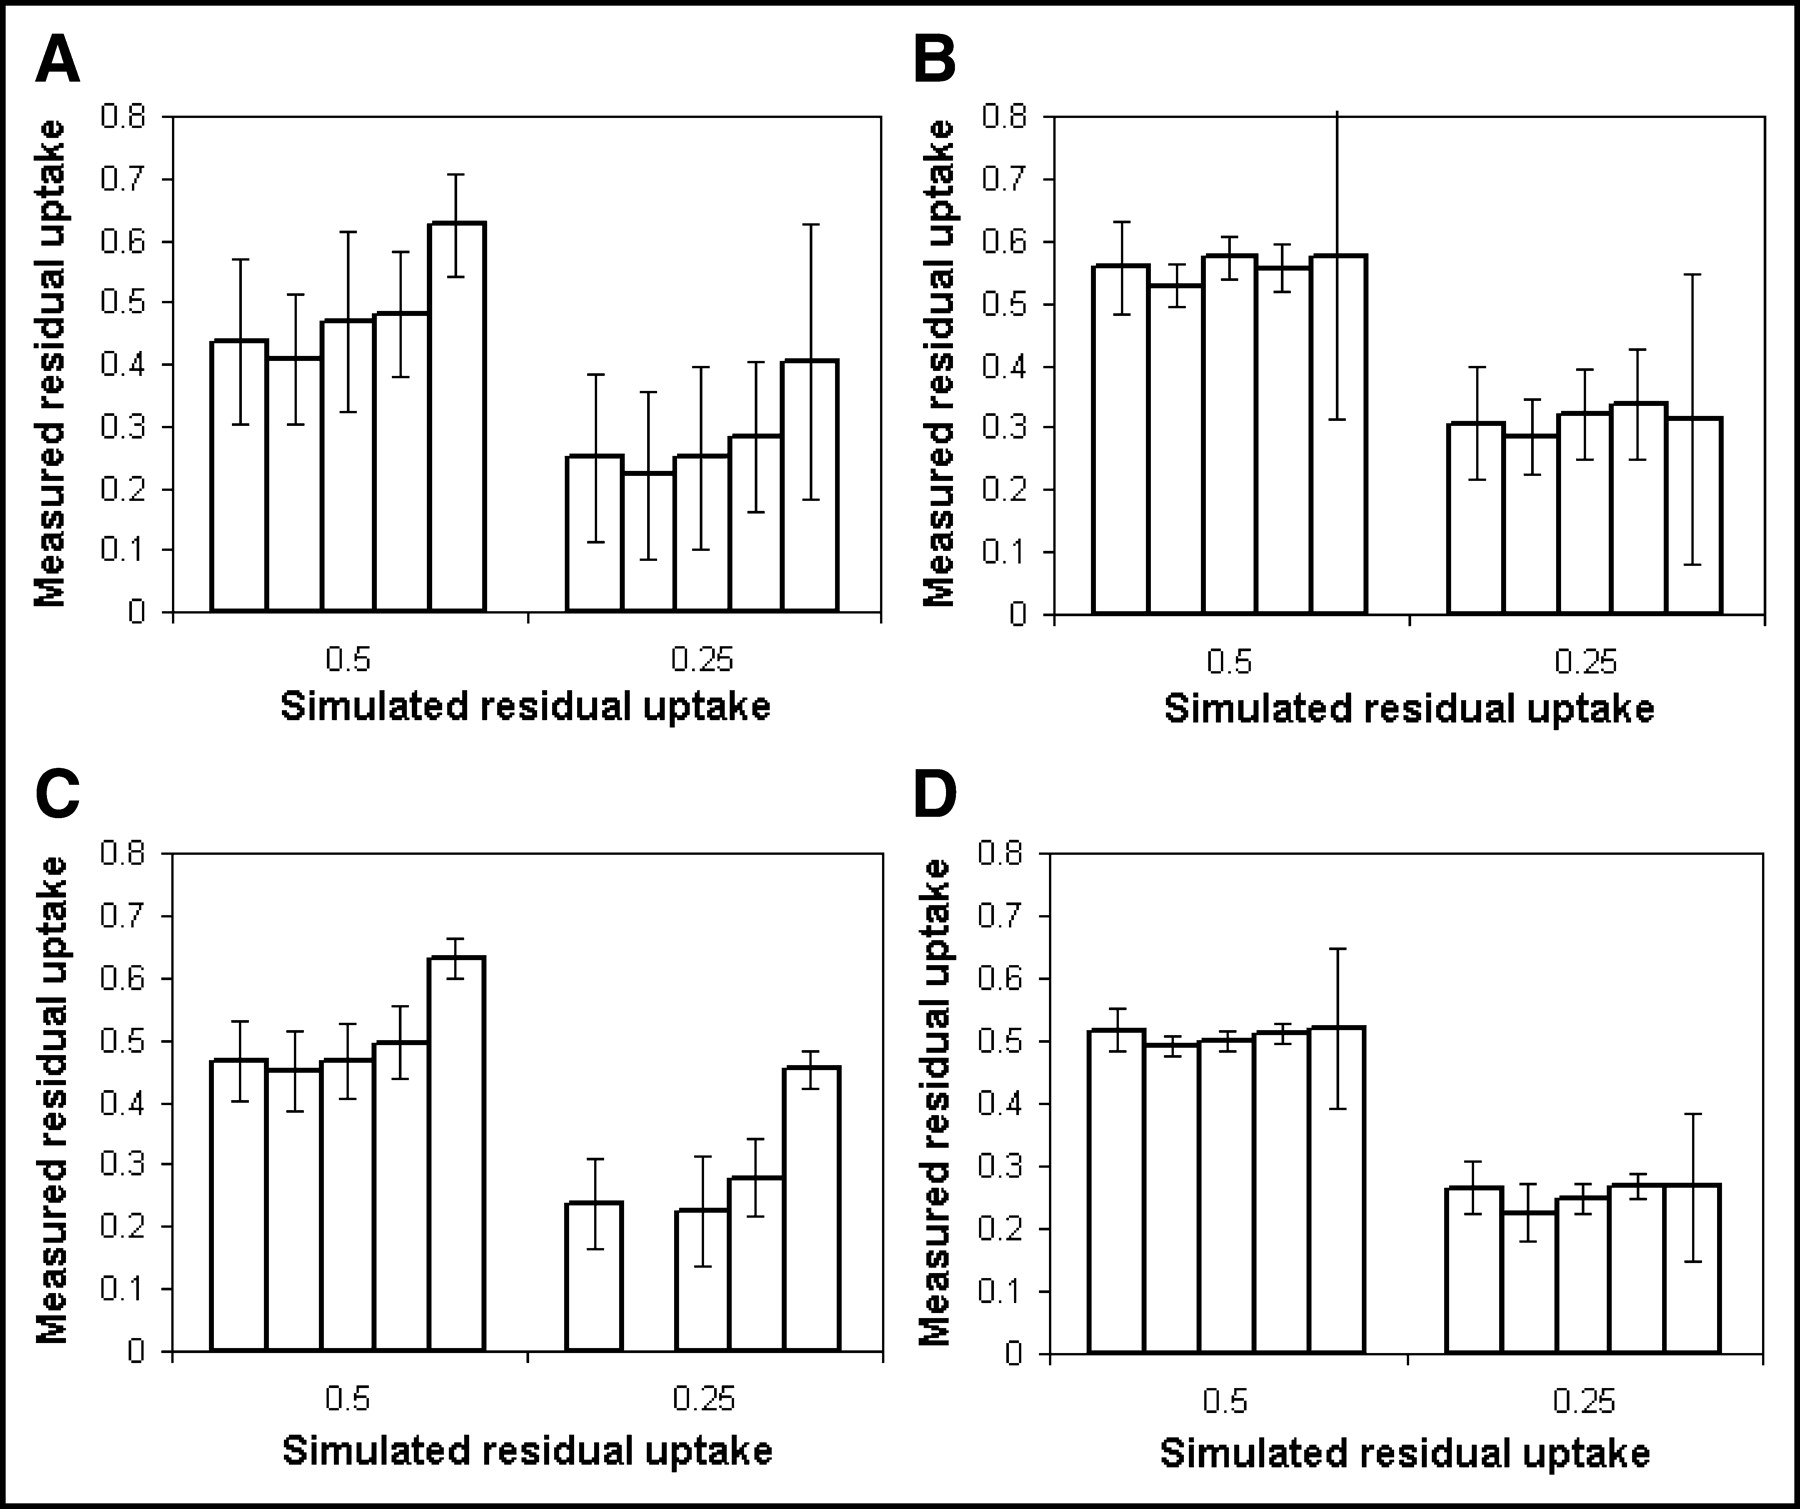
Relative changes of SUV as a function of the type of ROI are presented in Figure 4A for a 10-mm-diameter tumor and in Figure 4B for a 30-mm-diameter tumor, both for 5-mm FWHM image resolution data. Note that responses of 50% and 25% are defined here as residual uptakes—that is, as 50% and 75% decreases in 18F-FDG uptake compared with the initial concentration of 40 kBq/mL. Figures 4C and 4D show the same data obtained with an image resolution of 8-mm FWHM. Most measured responses were similar and independent of image resolution. However, in the case of 8-mm FWHM image resolution, a response could not be obtained using ROI50 for a SUV decrease to 25%, because this ROI included the entire patient. ROI15×15 provided the poorest estimate of SUV response for the smaller tumor sizes. Error bars in Figures 4 illustrate the effects of ROI type on the reproducibility (1 SD) of the measured response. Similar reproducibilities among most ROI types were observed, except for ROI15×15.

Measured residual uptake using various ROIs for simulated tumors showing a decrease in uptake only. (A and B) Nonsmoothed data. (C) Smoothed data. A and C give response of tumors with constant tumor size of 10-mm diameter; B and D show response of tumors with constant tumor size of 30 mm. Residual uptake was measured using maximum pixel value, ROI50, ROI70, ROI0.5(BG+MAX), and ROI15×15 as shown from left to right in each set of 5 bars. Error bars represent 1 SD. Missing bars in this figure correspond to missing data due to impossible ROI definition—that is, ROI enclosed entire patient.
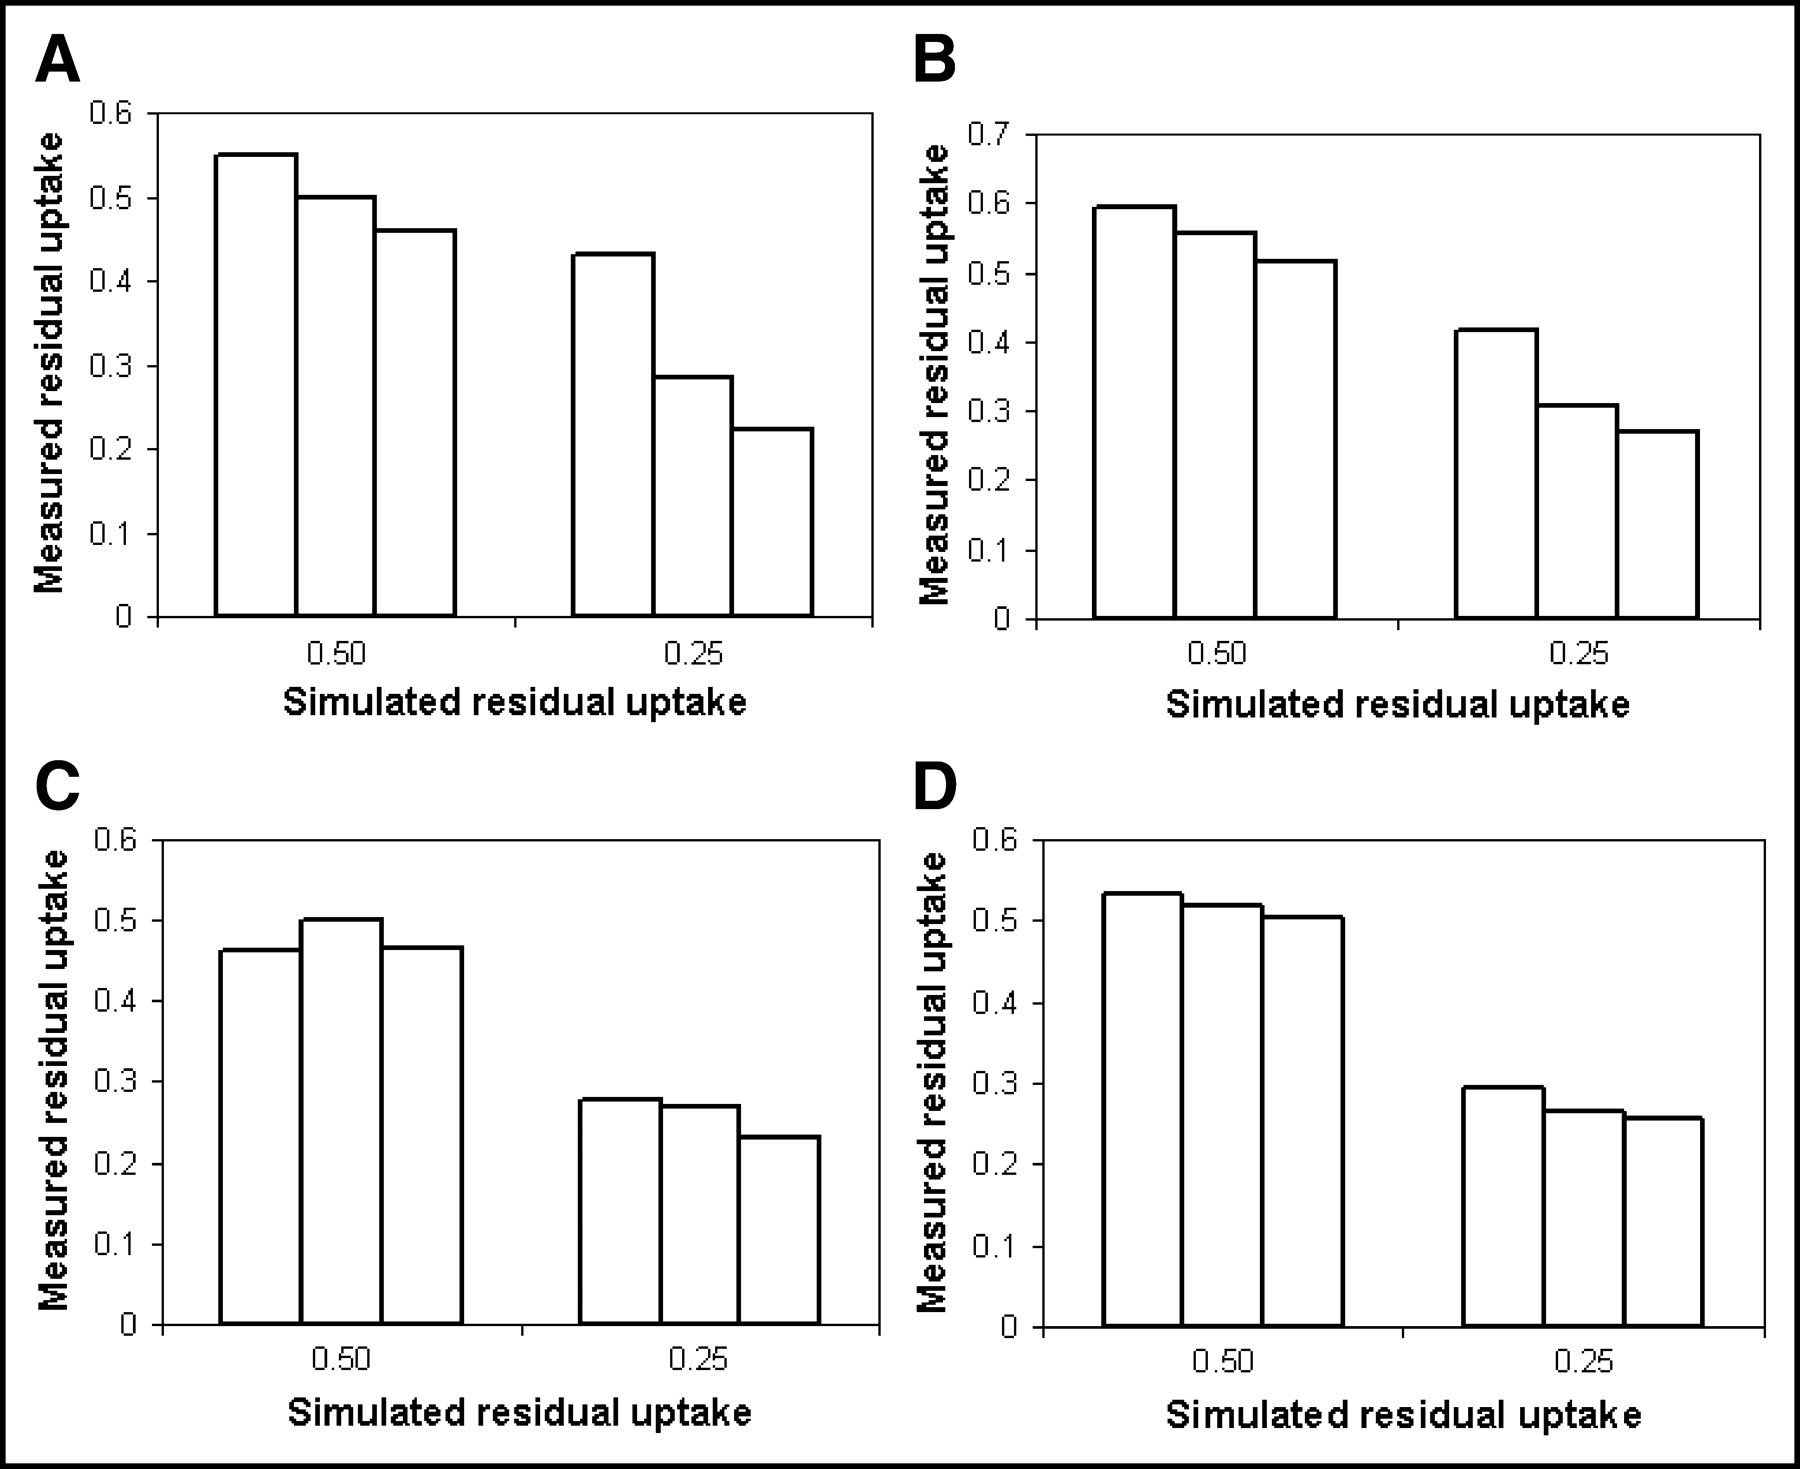
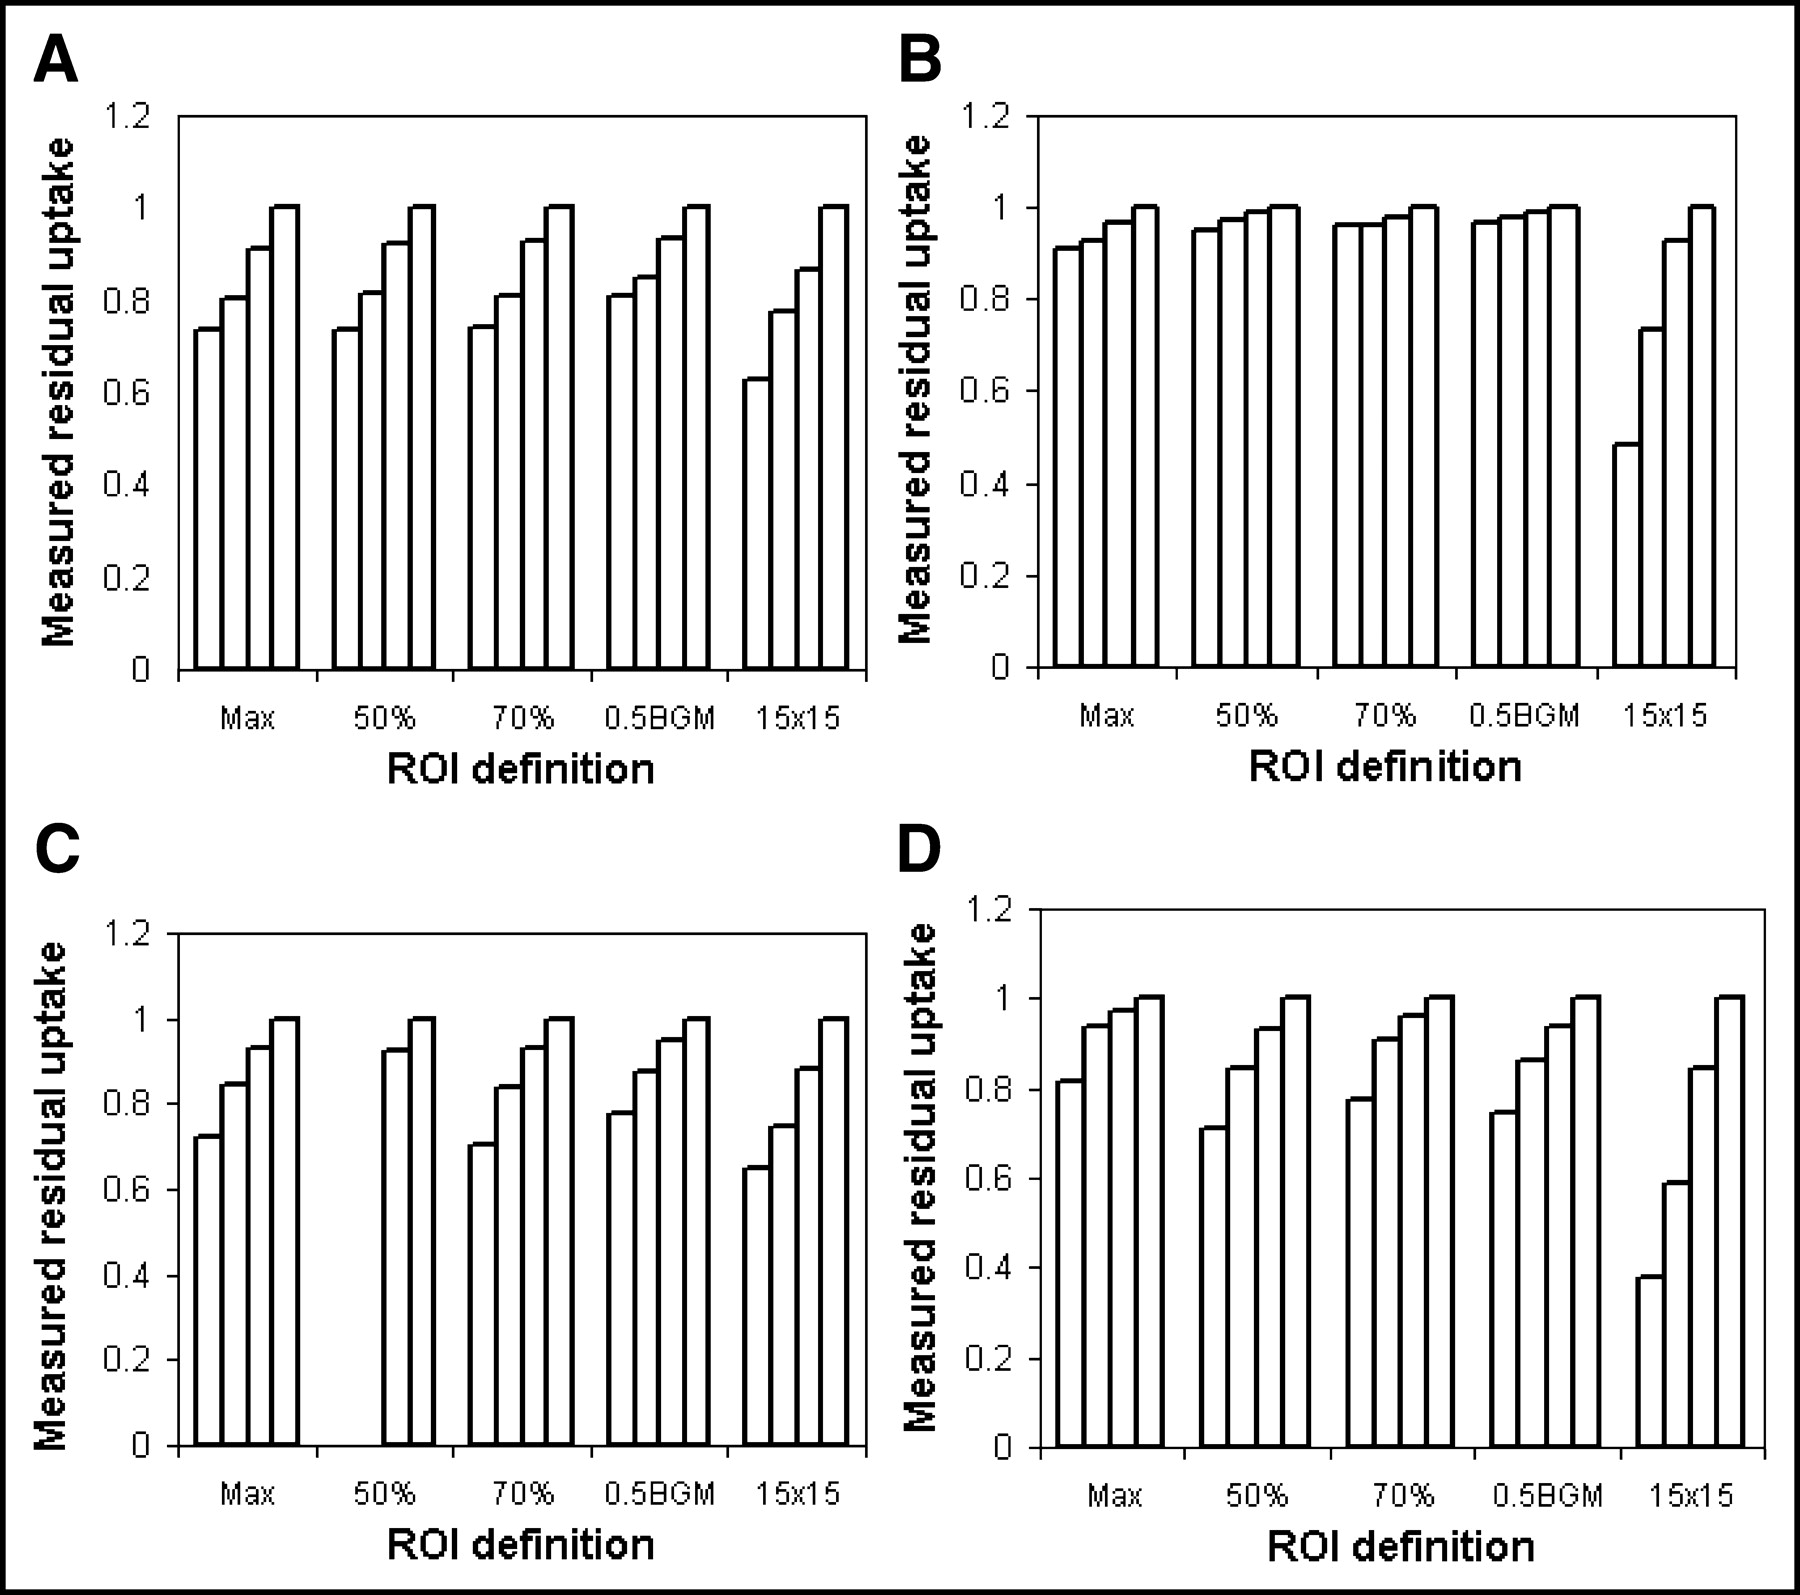
When only tumor size changed, an artifactual SUV response could be expected due to partial-volume effects. The latter is shown in Figures 5A–D. For all ROIs, similar erroneous responses were measured, which depended on the TBR, tumor size, and image resolution. Errors bars have been omitted for clarity, but reproducibilities show a dependence on ROI type similar to that presented in Figure 4.

Measured residual uptake using various ROIs keeping tumor uptake constant. Max = maximum pixel value; 50% = ROI50; 70% = ROI70; 0.5BGM = ROI0.5(BG+MAX); 15×15 = ROI15×15. (A and B) No smoothing of image. (C and D) Smoothing of image. A and C represent tumor data with TBR = 2; B and D represent tumor data with TBR = 8. Reduction of diameter to 10, 15, and 20 mm and not at all (it stays 30 mm) is shown from left to right in each set of 4 bars. Missing bars in this figure correspond to missing data due to impossible ROI definition—that is, ROI enclosed entire patient.
Figures 6A–6D show the effect of noise on the measured responses using maximum pixel values. Similar results were obtained for all other ROIs.
Effects of sinogram statistics on measured residual uptake for nonsmoothed data (A and B) and smoothed data (C and D), assuming constant tumor size of 10 mm (A and C) and 30 mm (B and D). Low, medium, and high NEC data are shown from left to right in each set of 3 bars.
Simulation II: Noise and Bias
In Figure 7A the recovery coefficient, defined here as the ratio of the average maximum pixel value over 100 simulations and the uniform AC value, is presented as a function of the ROI size for various noise levels. Increasing bias with the noise level and the ROI size was found. This indicates an increased probability to observe higher maxima with an increasing amount of pixels. In Figure 7B, the data for a background noise level of 35% are shown. Errors bars illustrate the variation of reproducibility (1 SD) with ROI size.
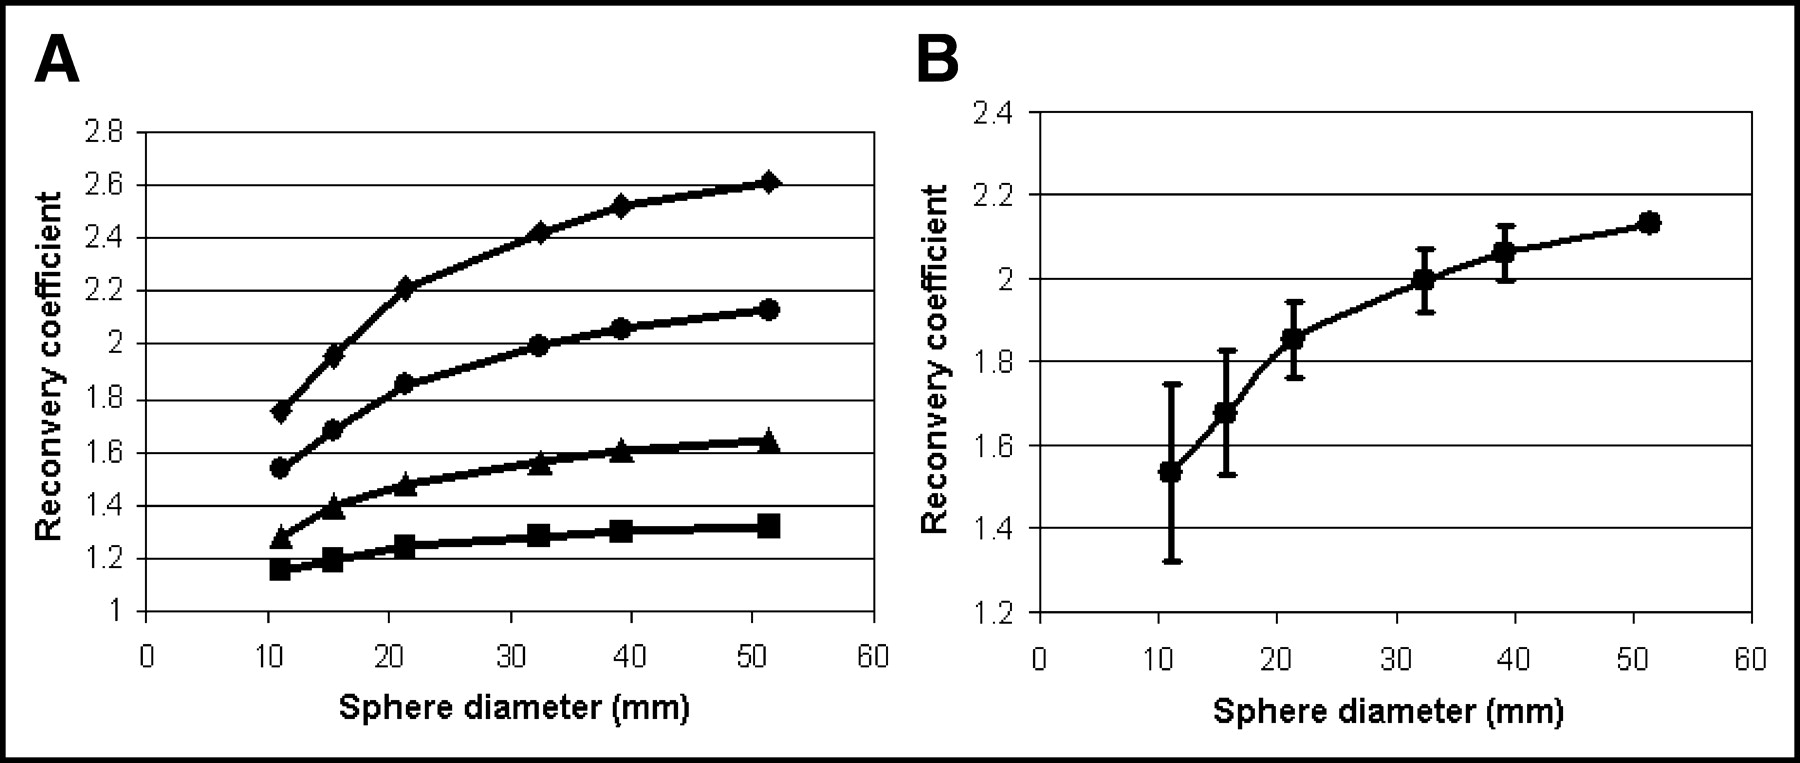
(A) Recovery coefficients determined using maximum pixel value within ROI as function of ROI size for various noise levels. ▪ = COV of 10%; ▴ = COV of 20%; • = COV of 35%; ♦ = COV of 50%. (B) Recovery coefficients based on maximum pixel value as function of ROI size for noise level = 35%. Error bars now illustrate variation of reproducibility (1 SD) as function of ROI size.
DISCUSSION
Applicability and Limitations of Simulations
Using simulation and phantom studies it is possible to obtain data under well-defined and clinically relevant conditions. However, some limitations apply: (a) tumors were represented using 3D spheres, which is a simplification; (b) the AC within a tumor was constant, thereby excluding effects of tumor heterogeneity. It can be argued, however, that results obtained for homogeneous spheric tumors are “ideal” and that heterogeneous nonspheric tumors will result in additional “noise” on top of the present results. However, clinical evaluation of ROI and reconstruction methods is still required, which is part of ongoing research.
In addition, the simulation focused on tumors located inthe thorax. When studies are performed at other body regions, somewhat different recovery coefficients can be expected due to differences in noise level resulting from differences in attenuation losses, random and scatter contribution. However, the variation of the SUV with resolution, noise, and ROI method will be similar, because noise, resolution, and ROI method are the underlying causes of the observed variations.
Accuracy of SUV
The observed recovery coefficients showed similar variation with sphere size under various conditions for all ROIs evaluated. There is, however, a difference for smoothed and unsmoothed data. In Table 3, values for the COV of background pixels are given for both smoothed and nonsmoothed data for each noise level. It can be deduced that image noise varies more with sinogram statistics for nonsmoothed data than for smoothed data. The relationship between image noise and sinogram statistics is consistent with those observed by Boellaard et al. (18). The results presented in Figure 2 indicate that the maximum pixel value increases both with ROI or tumor size and with noise level. Equivalently, maximum pixel values within an object increase with image noise level and with increasing object size. Similar results were observed by Falen et al. (21), who found SUV increases up to 70% with a higher number of iterations. Increasing the number of iterations not only improves convergence but also increases image noise. Therefore, images with higher noise show more positive bias for both the maximum pixel and the ROI value within a sphere (Fig. 7), and this bias increases with sphere size. This explains the large variation of maximum pixel value with object size for nonsmoothed data. Note that the variation of the maximum pixel value for nonsmoothed data is similar to that for smoothed data, indicating that partial-volume effects have only a minor contribution to the observed dependence on sphere size. Smoothing the data reduces effects of image noise but introduces a larger partial-volume effect. Consequently, variations of the maximum pixel value with sphere or tumor size are substantial for both smoothed and nonsmoothed images, but the underlying mechanisms are different. Because all isocontour-based ROI methods use the maximum pixel value as a reference, similar results were found using these ROIs (Figs. 1C and 1D).
COV of Pixel Values in Homogeneous Background of Simulated Phantom as Function of Sinogram Statistics and Image Resolution
The effects of the ROI method on the accuracy of recovery coefficients are trivial. ROI70 and ROI50 values are about 15% and 30% lower than the maximum pixel value. ROI0.5(Max+BG) values show intermediate results, but its value was in general close to the ROI50 values for tumors with a high TBR and closer to ROI70 for a low TBR. Smoothing the data led to an overall reduction of all measures. ROI50 seemed to be most accurate for high image resolution (noisy) data, whereas the maximum pixel value was more accurate for smoothed (low noise) data. ROI15×15 data provided the worst results among all ROIs tested, because the data included too many background pixels. It is therefore not a good candidate ROI for determining the average AC in small tumors (<20 mm).
The Nyquist principle requires the pixel size to be at least 2 times smaller than image resolution. For the simulated images with a resolution of 5-mm FWHM, a matrix size of 128 × 128 or a pixel size of 5 × 5 × 2.5 mm does not fulfill this criterion and will reduce image resolution (Table 1). Reducing the pixel size to 2.5 × 2.5 mm does no longer violate the Nyquist principle and will therefore not degrade image resolution. As expected, for smoothed data, with an image resolution of 8-mm FWHM, the effect of matrix or pixel size was much smaller.
Finally, patient weight has an effect on the accuracy of the measured AC. Variation in weight causes variation in sinogram counts or noise (Table 2), which causes bias. When data are sufficiently smoothed, the effects of noise are minimized at the cost of an increased partial-volume effect. A useful strategy to overcome this problem might be to adjust the dose to patient weight.
Response Monitoring
On average, the measured response was almost independent of the ROI method when the tumor size was kept constant. The good agreement of the measured response among all ROIs can be understood from the data presented in Figures 1C and 1D, which illustrate the strong correlation of ROI values over all noisy realizations. Therefore, the reproducibility and accuracy of the AC of the maximum pixel value in fact determines the reproducibility and accuracy of the AC measured with an isocontour ROI. Consequently, similar responses were measured with all isocontour-based ROIs. A slightly lower accuracy and very poor reproducibility were observed for ROI15×15 data because this region is too large for the small tumor sizes investigated in this study.
The measured response for tumors that showed a large variation in size strongly depended on tumor size, which is a logical consequence of the data presented in Figures 1A and 1B and in Figures 7A and 7B. Smoothing the data reduced, but did not remove, the differences among the ROIs. As mentioned previously, both noise-induced bias for nonsmoothed data and partial-volume effects for smoothed data are the underlying causes of the observed effects.
The (almost) independence of the measured response on noise, resolution, and ROI method is explained by the fact that most factors cancel out when calculating SUV ratios, such as bias due to noise; absolute quantification due to the applied ROI method; patient weight (= noise); image resolution. When the tumor size does not vary much, partial-volume effects will also cancel out (at least partially). However, more accurate results can be expected when accurate partial-volume corrections can be applied. Note, however, that smoothing improves the reproducibility of the observed responses.
Considerations for Use of SUV in Clinical Practice
From the present study it can be concluded that the SUV obtained under specific conditions may not be compared directly with those obtained, reconstructed, or analyzed under other conditions (31). Consistency of data acquisition and analysis protocols is therefore required. This can easily be adhered to within one institution, explaining the successful use of the SUV in differentiating benign from malignant tumors. However, SUV measures will probably vary strongly among institutions. Therefore, SUV threshold values used to differentiate between malignant and benign lesions should not be taken from the literature and used without validating the appropriateness. Moreover, another important observation is made by Thie et al. (32), who found that SUVs show a lognormal rather than a gaussian distribution, which will require a new review of applied SUV thresholds. Finally, standardization of imaging and analysis protocols is required for multicenter studies. Standardization is required, for example, for acquisition mode; average NEC (combination of scanner sensitivity and scan durations); reconstruction method and image resolution; interval between 18F-FDG administration and scanning; partial-volume corrections; head or feet at first bed position; ROI method; emptying of bladder; SUV calculation method. Any remaining differences may be determined and corrected for by including a standardized phantom experiment—for example, using anthropomorphic phantoms (Data Spectrum).
Another application of the SUV is to measure the treatment response of a tumor (5,6,8,10). Assuming consistent data processing for multiple scans of 1 patient, the measured response might be less dependent on noise, image resolution, and ROI definition (Figs. 4–6). Minimizing noise levels by smoothing reduces bias and seems to have a minimal effect on the accuracy of the measured response without the need for partial-volume correction algorithms. Some partial-volume effects were observed, however, when the tumor volume changed drastically. This can only be solved by the introduction of partial-volume correction methods. These variations in tumor size, however, were most likely an extreme situation in relation to changes seen in clinical practice. Because of the relative independence of the SUV response with respect to several study parameters, multicenter response-monitoring studies should be feasible.
CONCLUSION
A phantom and simulation study was performed to determine the effect of noise, image resolution, and ROI definition on the accuracy of the SUV. The SUV depended strongly on all studied parameters, and it can only be used for diagnostic purposes when data acquisition and processing are performed in a standardized way. This might be a problem for multicenter studies. The SUV ratios used to measure the treatment response depended less on noise and image resolution and are therefore more suitable for multicenter trials.
Acknowledgments
Christian Michell and Tim Hamilton (CTI PET Systems, Knoxville, TN) are acknowledged for sharing part of the reconstruction source codes, from which the simulation software was derived.
Footnotes
Received Nov. 24, 2003; revision accepted Feb. 5, 2004.
For correspondence contact: Ronald Boellaard, PhD, PET Center, VU University Medical Center, De Boelelaan 1117, 1081 HV Amsterdam, The Netherlands.
E-mail: r.boellaard{at}vumc.nl
REFERENCES
In this issue


Jump to section
Related Articles
Cited By...
- Total metabolic tumor volume on 18F-FDG PET/CT is a game-changer for patients with metastatic lung cancer treated with immunotherapy
- Long Versus Short Axial Field of View Immuno-PET/CT: Semiquantitative Evaluation for 89Zr-Trastuzumab
- A Pilot Study of 68Ga-PSMA11 and 68Ga-RM2 PET/MRI for Biopsy Guidance in Patients with Suspected Prostate Cancer
- The Impact of Semiautomatic Segmentation Methods on Metabolic Tumor Volume, Intensity, and Dissemination Radiomics in 18F-FDG PET Scans of Patients with Classical Hodgkin Lymphoma
- Use of 64Cu-DOTA-Trastuzumab PET to Predict Response and Outcome of Patients Receiving Trastuzumab Emtansine for Metastatic Breast Cancer: A Pilot Study
- Measurement of PET Quantitative Bias In Vivo
- FAPI-74 PET/CT Using Either 18F-AlF or Cold-Kit 68Ga Labeling: Biodistribution, Radiation Dosimetry, and Tumor Delineation in Lung Cancer Patients
- Assessing PET Parameters in Oncologic 18F-FDG Studies
- Revisiting Weight-Normalized SUV and Lean-Body-Mass-Normalized SUV in PET Studies
- Time to Prepare for Risk Adaptation in Lymphoma by Standardizing Measurement of Metabolic Tumor Burden
- Use of a Qualification Phantom for PET Brain Imaging in a Multicenter Consortium: A Collaboration Between the Pediatric Brain Tumor Consortium and the SNMMI Clinical Trials Network
- Prognostic Value of Standardized Uptake Ratio in Patients with Trimodality Treatment of Locally Advanced Esophageal Carcinoma
- Prognostic Value of the Metabolic and Volumetric Parameters of 11C-Methionine Positron-Emission Tomography for Gliomas: A Systematic Review and Meta-Analysis
- Amyloid-PET burden and regional distribution in cerebral amyloid angiopathy: a systematic review and meta-analysis of biomarker performance
- Tumor Uptake of 64Cu-DOTA-Trastuzumab in Patients with Metastatic Breast Cancer
- PET/MRI for Oncologic Brain Imaging: A Comparison of Standard MR-Based Attenuation Corrections with a Model-Based Approach for the Siemens mMR PET/MR System
- Repeatability of SUV in Oncologic 18F-FDG PET
- Accuracy and Precision of Partial-Volume Correction in Oncological PET/CT Studies
- Repeatability of Quantitative Whole-Body 18F-FDG PET/CT Uptake Measures as Function of Uptake Interval and Lesion Selection in Non-Small Cell Lung Cancer Patients
- Use of PERCIST for Prediction of Progression-Free and Overall Survival After Radioembolization for Liver Metastases from Pancreatic Cancer
- Determining the Minimal Required Radioactivity of 18F-FDG for Reliable Semiquantification in PET/CT Imaging: A Phantom Study
- Influence of Statistical Fluctuation on Reproducibility and Accuracy of SUVmax and SUVpeak: A Phantom Study
- Prognostic Value of Pretherapeutic Tumor-to-Blood Standardized Uptake Ratio in Patients with Esophageal Carcinoma
- Repeatability of 18F-FDG PET/CT in Advanced Non-Small Cell Lung Cancer: Prospective Assessment in 2 Multicenter Trials
- Safety of a Scout Dose Preceding Hepatic Radioembolization with 166Ho Microspheres
- 18F-FDG or 3'-Deoxy-3'-18F-Fluorothymidine to Detect Transformation of Follicular Lymphoma
- Assessment of Estrogen Receptor Expression in Epithelial Ovarian Cancer Patients Using 16{alpha}-18F-Fluoro-17{beta}-Estradiol PET/CT
- Reply to J.-S. Ryu et al and A.T. Berman et al
- Multicenter Harmonization of 89Zr PET/CT Performance
- Validation of Several SUV-Based Parameters Derived from 18F-FDG PET for Prediction of Survival After SIRT of Hepatic Metastases from Colorectal Cancer
- Subcentimeter Tumor Lesion Delineation for High-Resolution 18F-FDG PET Images: Optimizing Correction for Partial-Volume Effects
- Exploratory Clinical Trial of (4S)-4-(3-[18F]fluoropropyl)-L-glutamate for Imaging xC- Transporter Using Positron Emission Tomography in Patients with Non-Small Cell Lung or Breast Cancer
- Prognostic significance of SUV on PET/CT in patients with localisedoesophagogastric junction cancer receiving neoadjuvant chemotherapy/chemoradiation:a systematic review and meta-analysis
- Prognostic PET 18F-FDG Uptake Imaging Features Are Associated with Major Oncogenomic Alterations in Patients with Resected Non-Small Cell Lung Cancer
- Noise Considerations for PET Quantification Using Maximum and Peak Standardized Uptake Value
- Repeatability of 18F-FDG Uptake Measurements in Tumors: A Metaanalysis
- 18F-FDG Metabolic Tumor Volume and Total Glycolytic Activity of Oral Cavity and Oropharyngeal Squamous Cell Cancer: Adding Value to Clinical Staging
- Kinetic Analysis of 18F-FLT PET in Lung Tumors
- Impact of the Definition of Peak Standardized Uptake Value on Quantification of Treatment Response
- Mutatis Mutandis: Harmonize the Standard!
- Need for Standardization of 18F-FDG PET/CT for Treatment Response Assessments
- Quantitative Analysis of Response to Treatment with Erlotinib in Advanced Non-Small Cell Lung Cancer Using 18F-FDG and 3'-Deoxy-3'-18F-Fluorothymidine PET
- Conventional 3D staging PET/CT in CT simulation for lung cancer: impact of rigid and deformable target volume alignments for radiotherapy treatment planning
- Effects of Image Characteristics on Performance of Tumor Delineation Methods: A Test-Retest Assessment
- The Role of PET and PET/CT in Managing the Care of Lymphoma Patients
- Incidental Focal 18F-FDG Uptake in the Pituitary Gland: Clinical Significance and Differential Diagnostic Criteria
- Detection and Characterization of Tumor Changes in 18F-FDG PET Patient Monitoring Using Parametric Imaging
- Impact of Dynamic 18F-FDG PET on the Early Prediction of Therapy Outcome in Patients with High-Risk Soft-Tissue Sarcomas After Neoadjuvant Chemotherapy: A Feasibility Study
- Prognostic Implication of Dual-Phase PET in Adenocarcinoma of the Lung
- Comparative Assessment of Methods for Estimating Tumor Volume and Standardized Uptake Value in 18F-FDG PET
- From RECIST to PERCIST: Evolving Considerations for PET Response Criteria in Solid Tumors
- Standards for PET Image Acquisition and Quantitative Data Analysis
- Prognostic Value of Interim 18F-FDG PET in Patients with Diffuse Large B-Cell Lymphoma: SUV-Based Assessment at 4 Cycles of Chemotherapy
- Treatment Monitoring by 18F-FDG PET/CT in Patients with Sarcomas: Interobserver Variability of Quantitative Parameters in Treatment-Induced Changes in Histopathologically Responding and Nonresponding Tumors
- Early 18F-FDG PET for Prediction of Prognosis in Patients with Diffuse Large B-Cell Lymphoma: SUV-Based Assessment Versus Visual Analysis
- Partial-Volume Effect in PET Tumor Imaging
- Partial-Volume Correction in PET: Validation of an Iterative Postreconstruction Method with Phantom and Patient Data
- Consensus Recommendations for the Use of 18F-FDG PET as an Indicator of Therapeutic Response in Patients in National Cancer Institute Trials
- Accuracy of PET for Diagnosis of Solid Pulmonary Lesions with 18F-FDG Uptake Below the Standardized Uptake Value of 2.5
- PET Evaluation of Lung Cancer
- In Vivo Evaluation and Dosimetry of 123I-2-Iodo-D-Phenylalanine, a New Potential Tumor-Specific Tracer for SPECT, in an R1M Rhabdomyosarcoma Athymic Mouse Model
- Prognostic Relevance of Response Evaluation Using [18F]-2-Fluoro-2-Deoxy-D-Glucose Positron Emission Tomography in Patients With Locally Advanced Non-Small-Cell Lung Cancer
- PET for response assessment in oncology: radiotherapy and chemotherapy
- Detection and Staging of Preinvasive Lesions and Occult Lung Cancer in the Central Airways with 18F-Fluorodeoxyglucose Positron Emission Tomography: A Pilot Study
- Use of PET for Monitoring Cancer Therapy and for Predicting Outcome
- Understanding the Standardized Uptake Value, Its Methods, and Implications for Usage