


Abstract
The purpose of this study was to assess the prognostic value of early 18F-FDG PET using standardized uptake value (SUV) compared with visual analysis in patients with diffuse large B-cell lymphoma (DLBCL). Methods: Ninety-two patients with newly diagnosed DLBCL underwent 18F-FDG PET prospectively before and after 2 cycles of chemotherapy (at midtherapy). Maximum SUV (SUVmax) and mean SUV (SUVmean) normalized to body weight and body surface area, as well as tumor-to-normal ratios, were computed on the most intense uptake areas. The SUVs, tumor-to-normal ratios, and their changes over time were compared with visual analysis for predicting event-free survival (EFS) and overall survival, using receiver-operating-characteristic (ROC) analysis. Survival curves were estimated with Kaplan–Meier analysis and compared using the log-rank test. Results: With visual analysis, the accuracy of early PET to predict EFS was 65.2%. The 2-y estimate for EFS was 51% (95% confidence interval [CI], 34%–68%) in the PET-positive group compared with 79% (95% CI, 68%–90%) in the PET-negative group (P = 0.009). An optimal cutoff value of 65.7% SUVmax reduction from baseline to midtherapy obtained from ROC analysis yielded an accuracy of 76.1% to predict EFS. The 2-y estimate for EFS was 21% (95% CI, 0%–42%) in patients with SUVmax reduction ≤ 65.7% compared with 79% (95% CI, 69%–88%) in those with reduction > 65.7% (P < 0.0001). Fourteen patients considered as positive on visual analysis could have been reclassified as good responders. Conclusion: SUV-based assessment of therapeutic response during first-line chemotherapy improves the prognostic value of early 18F-FDG PET compared with visual analysis in DLBCL.
PET with 18F-FDG is a well-recognized diagnostic tool used for staging and monitoring response to therapy in most lymphomas (1–10). The superiority of PET over CT to identify active disease after therapy completion (11–13) has recently led to revision of response criteria, allowing elimination of the complete remission/unconfirmed category (14). However, specific criteria for midtherapy PET interpretation have not been defined yet. In non-Hodgkin's lymphoma, 18F-FDG uptake was found to decrease as early as 1 d after the initiation of chemotherapy (15). Several recent studies have also demonstrated that early assessment of response during the first treatment cycles is important to appreciate chemosensitivity and may potentially guide further risk-adapted therapeutic strategies in aggressive lymphoma (4,6,7).
Assessment of early response relies most often on visual analysis, which is subjective to the dichotomous interpretation of an observer or a panel of observers. In contrast to staging studies, where qualitative assessment of 18F-FDG uptake is usually sufficient, treatment monitoring may require objective quantification of 18F-FDG uptake changes. Standardized uptake value (SUV) is currently a popular semiquantitative, easy-to-calculate and noninvasive index of 18F-FDG metabolic rate (16,17). However, sufficient confidence in the technical aspects of SUV calculation is not established yet, and clinical evidence of whether SUV is superior to visual analysis for outcome prediction is still lacking (18,19). Furthermore, a clear cutoff for an adequate SUV reduction during treatment remains to be defined (20).
The purpose of our study was to assess the prognostic value of early 18F-FDG PET during first-line chemotherapy, using SUV semiquantification and comparison with visual analysis, in a homogeneous series of patients with diffuse large B-cell lymphoma (DLBCL).
MATERIALS AND METHODS
Patients
Between January 2000 and December 2005, a multicenter study involving 4 Departments of Hematology of the Assistance Publique-Hôpitaux de Paris (AP-HP) was conducted prospectively on 110 patients with newly diagnosed and histologically proven aggressive non-Hodgkin's lymphoma to assess the prognostic value of early 18F-FDG PET after 2 cycles of chemotherapy. The study was approved by the AP-HP review board, and all patients gave informed written consent. Early PET results did not influence the scheduled first-line therapeutic strategy. Results based on visual analysis involving the initial 90 patients have recently been published (7). Among the 110 patients, 104 had DLBCL (6 T-cell) but complete attenuation-corrected PET raw data were not available in 12 (scans done at other institutions). Therefore, 92 homogeneous DLBCL patients were included in the current study. Patient characteristics and chemotherapy regimens are summarized in Table 1. The database was closed in May 2006, with a median follow-up of 42 mo among survivors.
Patient Characteristics and Chemotherapy Regimens
18F-FDG PET
Patients underwent PET before initiation (PET1) and after 2 cycles (PET2) of chemotherapy, with a median interval of 14 d after the second cycle (range, 8–37 d). Patients fasted for 6 h, and PET was performed after having controlled the blood glucose level, which was targeted ≤ 7 mM. Before February 2004, the first 81 patients were scanned on a dedicated C-PET camera (ADAC). They were injected with 2 MBq/kg 18F-FDG and sat at rest for 83 ± 22 min before imaging. The acquisition consisted of 5–7 overlapping bed shifts, to cover a volume from the upper thigh to the skull base (25-cm field of view). For each bed position, a 6-min emission scan was acquired in a 3-dimensional (3D) coincidence mode, followed by a 1-min transmission scan (137Cs source). Images (144 × 144 matrix; voxel size, 4 × 4 × 4 mm3) were reconstructed using an iterative ordered-subsets expectation maximization (OSEM) algorithm with attenuation correction. The last 11 patients were scanned on a Gemini PET/CT system (Philips). They were injected with 5 MBq/kg 18F-FDG and rested for 69 ± 9 min before imaging. The acquisition featured a low-dose transmission CT scan (100 kV; 40 mAs; slice thickness, 5 mm), followed by the emission scan in 9–11 overlapping bed shifts (18-cm field of view), each for 3-min duration. Images (144 × 144 matrix; voxel size, 4 × 4 × 4 mm3) were reconstructed with a 3D row-action maximum-likelihood algorithm (RAMLA). All patients also underwent a concurrent diagnostic CT scan of the chest, abdomen, and pelvis before, during midtherapy, and after treatment completion and then every 6 mo for follow-up based on the criteria of Cheson et al. (21).
Visual Analysis of 18F-FDG Uptake
PET images were analyzed by a consensus of 2 experienced observers who were unaware of clinical, radiologic, and follow-up data. All foci were scored for their extent and intensity using a 3-point scale (1 = low, 2 = moderate, 3 = high) (3,7). The extent was scored within each lymphatic area, organ, or skeletal region, depending on the number of nodes or volume involved; the intensity was scored compared with surrounding tissues after upper thresholding of the data to have the liver activity around 30% of the gray scale. Then, PET2 was scored as positive or negative in comparison with PET1. Negative was defined as having either no residual abnormal uptake or having a unique residual site (with an extent score of 1) associated with an intensity score of 1, whereas all other previously hypermetabolic sites had disappeared. Positive was defined as having at least 1 residual site (with an extent score of 1) associated with an intensity score of 2, or as having ≥2 residual sites with any extent and intensity scores.
SUV-Based Assessment of 18F-FDG Uptake
For each PET dataset, the tumor (T) with the most intense 18F-FDG uptake among all foci was carefully identified, relying on a graded color-scaled parametric analysis (Fig. 1). From the activity profile crossing the hottest point, an isocontour threshold was determined halfway between the background and the maximal pixel value (22) and was automatically propagated on adjacent slices to encompass the entire tumor volume. Maximal and mean counts-per-pixel were computed within the volumetric region of interest (ROI). If present, a central cold area was included. In addition, 2 large ROIs were manually drawn over gluteal muscle regions (Fig. 1), from which the counts-per-pixel were averaged to define the normal background (N).
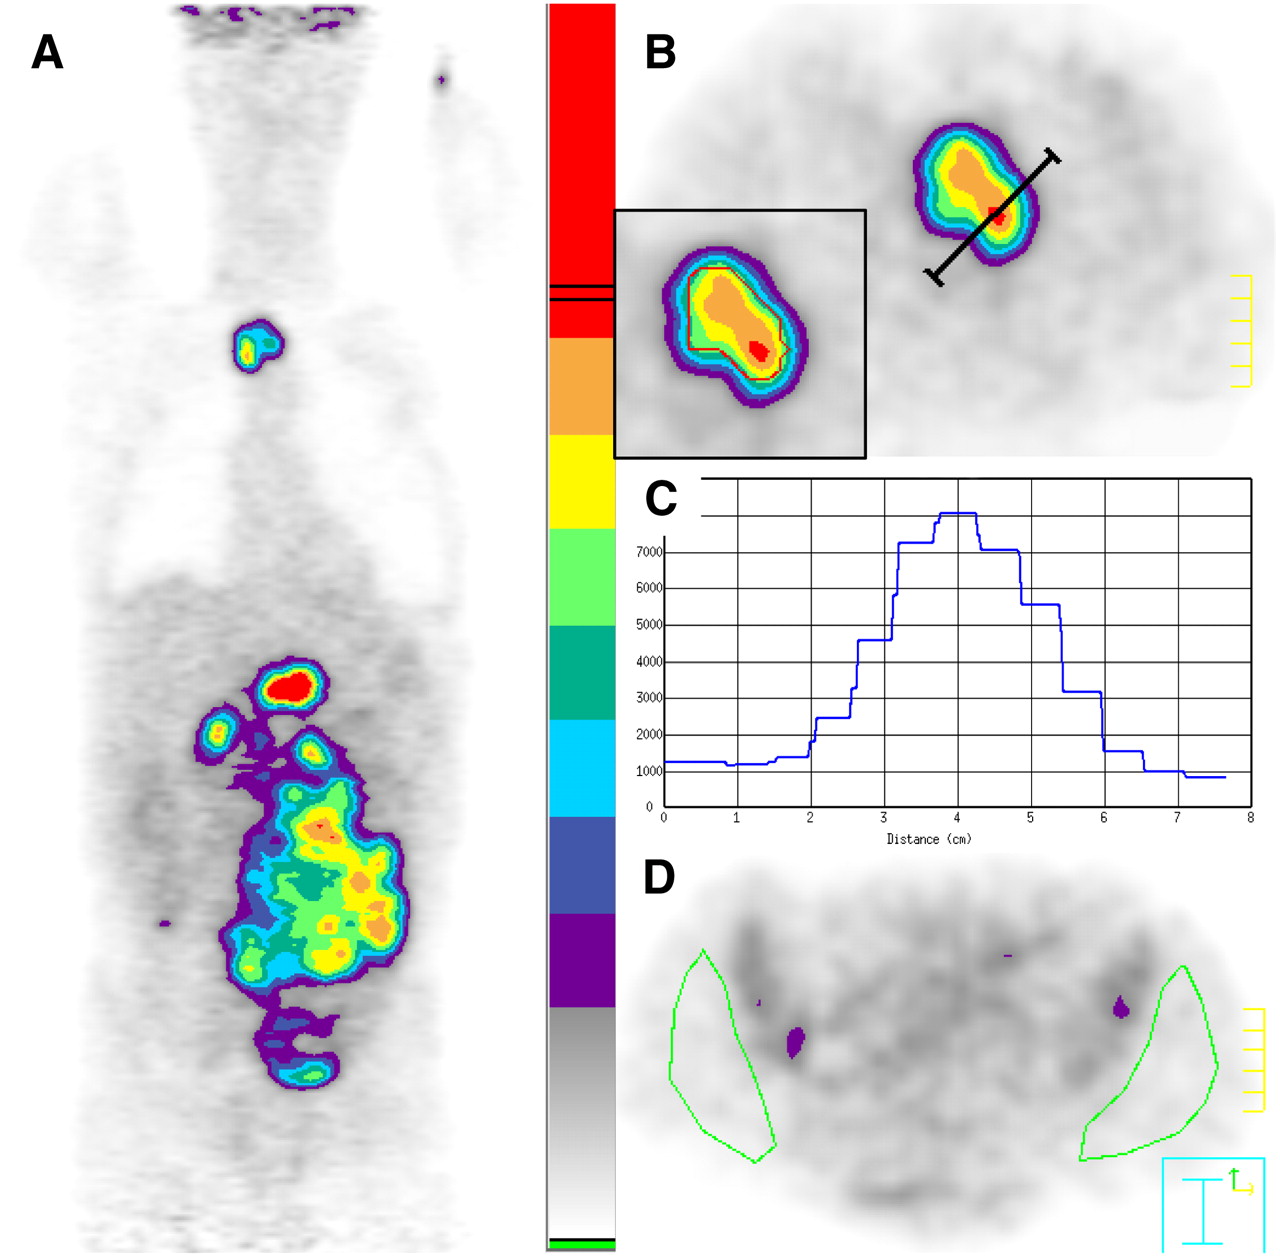
Selection of ROIs in 57-y-old patient before chemotherapy. (A) Graded color-scaled parametric analysis applied in reconstructed coronal PET image shows most active tumor in upper abdomen. (B) Transverse PET image with a higher scale reveals celiac tumor (T) with activity profile crossing the hottest point (red spot). (C) Corresponding activity profile in counts-per-pixel. Isocontours are drawn with lower autocontour threshold of 4,500 counts-per-pixel (red isocontour at inset in B). (D) Normal background tissue (N): 2 large ROIs are manually selected on gluteal muscles, avoiding iliac bone marrow activity.
To assess metabolic changes during chemotherapy, the hottest tumor in any region or organ on PET2 was used for comparison and as the indicator for disease status, even though its location differed from the initial hottest tumor on PET1. In cases in which all lesions had disappeared, ROIs were manually drawn in the same area on PET2 as that on PET1, with careful slice-to-slice comparison and by making sure that the ROI size was restricted to the baseline tumor. In addition, we also investigated 18F-FDG uptake changes on PET2 within the initial hottest tumor site on PET1, even though PET2 demonstrated hottest foci on other locations.
SUVs were calculated from the counts-per-pixel and normalized to body weight (BW) and body surface area, defined as BSA (m2) = 0.007184 weight (kg)0.425 × height (cm)0.725 (23,24), using the following formulas: Eq. 1
Eq. 1 Eq. 2where *activity was decay-corrected from the delay between injection and image acquisition. In addition, the tumor-to-normal uptake ratio (T/N ratio) for each PET image was computed as follows (Eq. 3):
 Eq. 3
Eq. 3
Statistical Analysis
To evaluate the prognostic value of early PET, event-free survival (EFS) and overall survival (OS) were chosen as endpoints. EFS was defined as the date of enrollment to first evidence of progression, relapse, or death from any cause. Data were censored if the patients were alive and free of progression or relapse at last follow-up. OS was defined as the date of enrollment to death from any cause. Data were censored if the patients were alive at last follow-up. Receiver-operating-characteristic (ROC) analysis was performed to determine an optimal cutoff value of uptake on PET2 or an optimal cutoff value of uptake reduction from PET1 to PET2 in predicting EFS—event versus no event—and OS—dead versus alive. Differences in SUVs between groups were analyzed with an unpaired Student t test, and significance was obtained when the 2-sided P value was < 0.05. Survival according to visual analysis and SUV-based assessment of early PET was depicted using the Kaplan–Meier plots and compared using the log-rank test.
RESULTS
Patient Outcome
During a median follow-up period of 42 mo after inclusion, 60 patients had no event (EFS = 65.2%), whereas the remaining 32 patients progressed or died, with a median delay of 6.7 mo; in addition, 71 patients survived (OS = 77.2%), whereas the remaining 21 patients died, with a median delay of 9.1 mo.
Visual Analysis of Survival
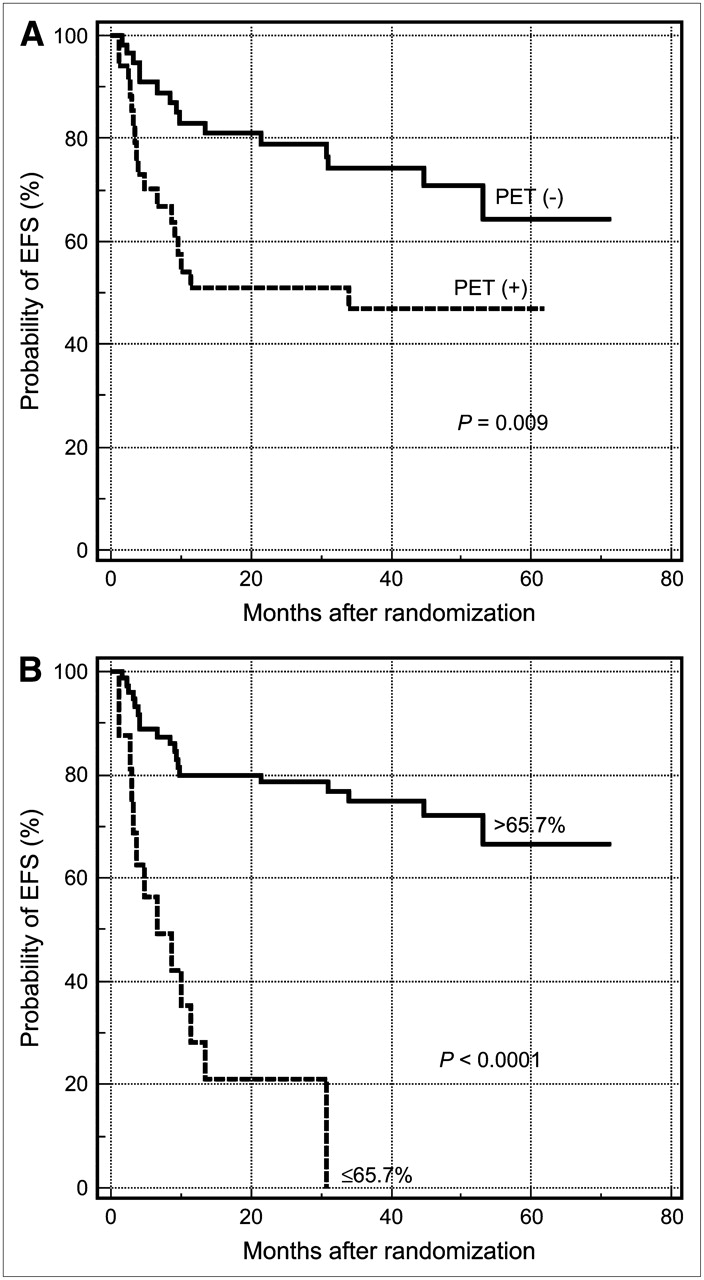
All patients demonstrated intense foci of uptake on PET1, as expected from DLBCL. At midtherapy, PET2 was interpreted as positive in 34 patients and negative in 58 patients. The 2-y estimate for EFS was 51% (95% confidence interval [CI], 34%–68%) in PET2-positive patients compared with 79% (95% CI, 68%–90%) in PET2-negative patients (P = 0.009; Fig. 2A). Positive and negative predictive values (PPVs and NPVs, respectively), as well as accuracies in predicting EFS and OS (65.2% and 68.5%, respectively) are listed in Table 2. Of the 34 PET2-positive patients, 17 remained free of an event at last follow-up.

Kaplan–Meier plots for estimation of probability of EFS according to PET status at midtherapy. (A) Survival curves based on visual analysis. (B) Survival curves based on percentages of SUVBWmax reduction.
Outcome Prediction by Means of Visual Analysis and SUVs in 92 Patients
SUV-Based Assessment of Survival
There was no statistical difference between the SUVs computed from the C-PET system and those obtained from the Gemini PET/CT, on both PET1 and PET2 (P = 0.6 and 0.3, respectively). At baseline, SUVBWmax averaged 13.2 ± 4.8, whereas at midtherapy SUVBWmax decreased to 3.4 ± 2.7, corresponding to a mean reduction of 71.7%. Among the 34 PET2-positive patients, the hottest tumor remained in the same site as PET1 in 50%, whereas the location changed in 50%, either because the tumor responded better to therapy than other locations (n = 15) or, in the case of progression, because another location demonstrated higher uptake (n = 2). SUVBWmax reduction averaged 55.4% in PET2-positive patients versus 81.2% in PET2-negative patients (P < 0.0001). All SUVBW, SUVBSA values and T/N ratios are displayed in Table 3.
Mean SUVBW, SUVBSA, and T/N Ratio
With ROC analysis, an optimal cutoff value of SUVBWmax of 5.0 at PET2 could predict EFS with higher PPV, NPV, and accuracy (75.0%) than visual analysis (Table 2). SUVBSAmax performed even better for predicting outcome, with an accuracy reaching 88.0% for OS. At midtherapy, most patients showed SUVBWmax ≤ 5.0, and these patients (n = 79) tended to have lower baseline SUVBWmax (12.8 ± 4.7) than those (n = 13) with SUVBWmax > 5.0 (15.4 ± 5.0; P = 0.073). Furthermore, SUVBWmax at PET1 failed to demonstrate a significant predictive value for EFS (area under ROC curve = 0.525, P = 0.7).
The percentage of SUVBWmax reduction from PET1 to PET2 averaged 60.7% ± 32.6% in the 32 patients whose disease progressed or who died versus 77.5% ± 12.4% in the 60 patients who remained free of disease (P < 0.0006). ROC analysis yielded an optimal cutoff value of 65.7% SUVBWmax reduction at midtherapy for predicting EFS. The overall accuracy increased to 76.1% (Table 2). In patients with SUVBWmax reduction ≤ 65.7% (n = 16), the 2-y estimate for EFS was only 21% (95% CI, 0%–42%) compared with 79% (95% CI, 69%–88%) in those with SUVBWmax reduction > 65.7% (n = 76) (P < 0.0001; Fig. 2B). Results obtained from both the reduction of SUVBWmean and T/N ratio showed slightly poorer accuracies and PPVs—that is, more false-positive scans. SUVmax reduction, whether normalized to BW or BSA, also gave slightly better PPVs and accuracies for OS (Table 2).
When considering the 18F-FDG uptake change with regard to the most active focus on the baseline scan only, ROC analysis led to an 83.3% PPV, 72.5% NPV, and 73.9% accuracy for EFS. The optimal cutoff value was 65.7%.
DISCUSSION
In the present study, we emphasize, in a homogeneous series of 92 patients with DLBCL, that SUV-based assessment of glucose metabolic changes after 2 treatment cycles improves the prognostic value of early 18F-FDG PET, compared with visual analysis, with a median follow-up of 42 mo.
A negative interim scan based on visual analysis during first-line chemotherapy has proven to be an independent indicator of favorable outcome among patients with low-risk or high-risk disease based on the International Prognostic Index (7). Moreover, a more recent study showed that a significant survival difference exists between patient groups on the basis of early PET results but not on the gene-expression profiles (25). However, visual analysis of PET may be improved because some PET-positive patients still have a good outcome (7,26,27). If response on interim 18F-FDG PET is to be used to guide second-line risk-adapted therapeutic strategies in the future, efforts should be made to decrease the false-positive scans so that patients are not overtreated—that is, to improve the PPV of PET (27). In the present series, 17 of 34 patients with residual 18F-FDG uptake, considered visually positive on PET2, remained free of an event. The same issue was also raised in a recent study with advanced-stage Hodgkin's disease (28). Such patients could have already shown significant reduction of 18F-FDG uptake after first-line chemotherapy but still presented with an increased activity compared with the surrounding normal tissue by visual analysis.
To be able to quantify the 18F-FDG metabolic rate instead of interpreting images only as positive or negative, Römer et al. demonstrated in 11 lymphoma patients that Patlak analysis of 18F-FDG kinetics may provide superior information in therapy monitoring (1). However, quantification of glucose metabolic rate, which requires dynamic imaging on a restricted field of view and measurement of the arterial input function, is generally regarded as too complex in routine practice (23,24). Moreover, it may not be suitable in DLBCL when the most active lesion indicating tumor viability can be outside the field of view (18–25 cm). In Hodgkin's lymphoma, Hutchings et al. demonstrated that SUV analysis of interim PET may help in patient stratification (29). Our study also shows that an easy-to-calculate semiquantitative index, such as the SUVmax, is adapted to assess early response and predict long-term outcome. The PPV of early PET for EFS can be improved from 50% with visual analysis to 81.3% when using SUVBWmax reduction of 65.7% from PET1 to PET2 as a cutoff value. Fourteen patients could have been considered good responders in this case without altering NPV (at the expense of 4 more false-negative scans), among whom 11 were in complete remission at the end of first-line therapy and remain free of an event at the last follow-up (Fig. 3). The overall accuracy for EFS prediction based on SUVBWmax reduction compared with visual analysis is 76.1% versus 65.2%, with even higher performance in predicting OS, as shown in Table 2. More importantly, Kaplan–Meier analysis demonstrates much higher statistical significance between EFS curves using the SUV approach.

A 25-y-old woman with bulky mediastinal uptake on PET1 (A, anterior view), who was interpreted as positive visually on PET2 (B, left anterior oblique view). Two residual foci were diagnosed (arrows), scored as extent = 1, intensity = 1 for retrosternal site and extent = 2, intensity = 1 for left hilar site. However, SUVBWmax reduction was measured at 80.7%—that is, above the cutoff value of 65.7%, indicating good early response. Patient remained in complete remission after 36 mo of follow-up.
One of the reasons why the usefulness of SUV in clinical application remained controversial is that being a simplified semiquantitative method, SUV is prone to many sources of variability from one institution to another. In our series, SUVBWmax in the most intense lesion at baseline averaged 13.2 ± 4.8, which compares well with the value of 17.2 ± 9.7 reported by Schöder et al. in 63 patients with aggressive lymphoma (43 new cases of disease) (30). Our SUVs are relatively lower but appear more homogeneous with regard to the lower SD. Variability in SUV measurement can stem from many factors, including the imaging delay after 18F-FDG injection, the partial-volume effect, and the applied normalization scheme (17,22,31).
With regard to the imaging delay, we generally performed image acquisition >60 min after injection, which is considered the time required for the 18F-FDG uptake to reach a plateau (16). Although the time interval varied slightly between the C-PET and Gemini acquisitions for logistics reasons inherent to a multicenter study, no scan was performed earlier than 48 min.
The partial-volume effect is related primarily to the limited spatial resolution of PET (32) and results in an underestimation of 18F-FDG uptake in small lesions. Previous studies have shown that SUV measurement is more reliable for an object with a diameter at least 2.5-fold the PET intrinsic spatial resolution (31,32). For the same reason, SUVmax is regarded as better than SUVmean as a metabolic index, especially in small lesions (31). In our study, SUVmax, normalized either to BW or to BSA, demonstrated PPVs and accuracies for outcome prediction that were superior to those of SUVmean and T/N ratio, and we recommend the use of SUVmax. The method of ROI definition may also have an impact on the partial-volume effect: ROIs obtained from the PET activity profiles, as it was done in our study, correspond most closely to the actual tumor size (22). Moreover, we have investigated the differences in SUVs between PET-based and CT-based ROI definitions on coregistered PET/CT images of a simple phantom (a series of syringes of increasing diameters ranging from 0.4 to 2.5 cm, filled with a homogenated 18F-FDG solution) and showed that CT-based ROIs would not improve SUV measurements (33).
As to the correction scheme, SUV normalized to BW for many tissues was found to have a strong positive correlation with weight (34,35) because 18F-FDG uptake is lower in fat than in other tissues and, consequently, SUVs tend to be overestimated in heavier patients (24). Because body weight often changes during treatment, BSA normalization was proposed. In our study, SUVBSAmax values on PET2 alone showed a better PPV than SUVBWmax for EFS and OS prediction; however, when considering the percentage of SUV reduction, SUVBSAmax and SUVBWmax gave identical values and accuracies for EFS and OS prediction.
For all of the reasons discussed, it seems difficult to rely on one single SUV at a given time point to appreciate the therapeutic response and to predict outcome. Indeed, because a cutoff value for an absolute SUV can vary greatly between different institutions (here, SUVBWmax of 5.0 on PET2), the measurement of an interscan SUV reduction within the same institution is probably a better and more reproducible approach (here, a 65.7% SUVBWmax reduction). This is confirmed by the higher accuracy obtained for EFS from ROC analysis with the second analysis, for 18F-FDG uptake change, over the first one.
One could regret that most patients were scanned on the C-PET and few on the Gemini, which could introduce quantification bias. This limitation is due to the prospective nature of our study, with subsequent evolution of the technology. Even though the calibration factors could vary slightly between scanners related to different attenuation correction methods or reconstruction algorithms, univariate analysis has proven that SUVs obtained from these 2 systems showed no statistical difference. Most important, each patient had his or her 2 PET scans on the same machine; therefore, the potential systemic bias could have been eliminated by computing the SUVBWmax differences. Another limitation of our study is the use of a post hoc response criterion for SUV-based analysis (obtained from the same patient population), instead of a predefined response criterion, as we did for visual analysis.
It must be pointed out that in our study, when a lesion different from the baseline tumor showed the most intense activity on PET2, which happened in 17 patients (18% of 92), we used its SUV as the index of 18F-FDG uptake at midtherapy. When only the change of SUVBWmax within the initial tumor was considered in the analysis, more false-negative scans were noted in predicting EFS. Indeed, in this case the overall accuracy was slightly inferior (73.9% instead of 76.1%).
CONCLUSION
Our findings indicate the potential of improving the prognostic value of early 18F-FDG PET by using SUV-based rather than visual analysis in DLBCL. The optimal cutoff value for SUVBWmax reduction from baseline to midtherapy is 65.7% for predicting EFS. This cutoff value, however, may require refinement under circumstances of different treatment regimens and in other histologic types of lymphomas (27), and we look forward for its application in other study groups. Potential implications for patient care will be to provide a more reproducible assessment of early PET studies and, eventually, to guide risk-adapted therapies.
Acknowledgments
We are indebted to the entire team of the AP-HP PET Center at Tenon Hospital, Paris, for their help with C-PET imaging. Particular thanks go to Marie-Joséphine Waryn and Sébastien Mrozowicz for their collaborations in the phantom study, Julien-Aymeric Simonnet for his review of statistical analysis, and Marie-Claude Bassene and Antoine Allain for their help with database management. This study was supported by the Délégation à la Recherche Clinique de l'Assistance Publique-Hôpitaux de Paris (PHRC-AOM00152) and the Société Française de Radiologie.
Footnotes
-
COPYRIGHT © 2007 by the Society of Nuclear Medicine, Inc.
References
- Received for publication March 3, 2007.
- Accepted for publication May 31, 2007.


Jump to section
Related Articles
Cited By...
- Validation of the {Delta}SUVmax for Interim PET Interpretation in Diffuse Large B-Cell Lymphoma on the Basis of the GAINED Clinical Trial
- Application of the Lugano Classification for Initial Evaluation, Staging, and Response Assessment of Hodgkin and Non-Hodgkin Lymphoma: The PRoLoG Consensus Initiative (Part 2--Technical)
- Validation of Convolutional Neural Networks for Fast Determination of Whole-Body Metabolic Tumor Burden in Pediatric Lymphoma
- Follicular Lymphoma Treated with First-Line Immunochemotherapy: A Review of PET/CT in Patients Who Did Not Achieve a Complete Metabolic Response in the GALLIUM Study
- Interim PET in Diffuse Large B-Cell Lymphoma
- Statistical Considerations in the Evaluation of Continuous Biomarkers
- Interim PET Evaluation in Diffuse Large B-Cell Lymphoma Using Published Recommendations: Comparison of the Deauville 5-Point Scale and the {Delta}SUVmax Method
- Derivation and utility of an A{beta}-PET pathology accumulation index to estimate A{beta} load
- Quantitative Assessment of Interim PET/CT Could Have More Prognostic Relevance than Visual Assessment for Predicting Clinical Outcome of Extranodal Diffuse Large B Cell Lymphoma
- Combined Visual and Semiquantitative Evaluation Improves Outcome Prediction by Early Midtreatment 18F-FDG PET in Diffuse Large B-Cell Lymphoma
- Validation of the Semiautomatic Quantification of 18F-Fluoride PET/CT Whole-Body Skeletal Tumor Burden
- Interim PET Analysis in First-Line Therapy of Multiple Myeloma: Prognostic Value of {Delta}SUVmax in the FDG-Avid Patients of the IMAJEM Study
- Predictive Value of PET Response Combined with Baseline Metabolic Tumor Volume in Peripheral T-Cell Lymphoma Patients
- FDG-PET-driven consolidation strategy in diffuse large B-cell lymphoma: final results of a randomized phase 2 study
- Interim PET-driven strategy in de novo diffuse large B-cell lymphoma: do we trust the driver?
- Repeatability of SUV in Oncologic 18F-FDG PET
- Early treatment intensification with R-ICE and 90Y-ibritumomab tiuxetan (Zevalin)-BEAM stem cell transplantation in patients with high-risk diffuse large B-cell lymphoma patients and positive interim PET after 4 cycles of R-CHOP-14
- Response Assessment Criteria and Their Applications in Lymphoma: Part 2
- Response Assessment Criteria and Their Applications in Lymphoma: Part 1
- Role of Imaging in the Staging and Response Assessment of Lymphoma: Consensus of the International Conference on Malignant Lymphomas Imaging Working Group
- Midtreatment 18F-FDG PET/CT Scan for Early Response Assessment of SMILE Therapy in Natural Killer/T-Cell Lymphoma: A Prospective Study from a Single Center
- Correlation between FDG/PET, histology, characteristics, and survival in 332 patients with chronic lymphoid leukemia
- Interim 18F-FDG PET SUVmax Reduction Is Superior to Visual Analysis in Predicting Outcome Early in Hodgkin Lymphoma Patients
- Early PET/CT Scan Is More Effective Than RECIST in Predicting Outcome of Patients with Liver Metastases from Colorectal Cancer Treated with Preoperative Chemotherapy Plus Bevacizumab
- Prognostic Value of Interim and Posttherapy 18F-FDG PET/CT in Patients with Mature T-Cell and Natural Killer Cell Lymphomas
- Imaging Follicular Lymphoma Using Positron Emission Tomography With [18F]Fluorodeoxyglucose: To What Purpose?
- Interim PET-CT in the management of diffuse large B-cell lymphoma
- Noise Considerations for PET Quantification Using Maximum and Peak Standardized Uptake Value
- Interim 18-FDG-PET/CT failed to predict the outcome in diffuse large B-cell lymphoma patients treated at the diagnosis with rituximab-CHOP
- Interim [18F]Fluorodeoxyglucose Positron Emission Tomography Scan in Diffuse Large B-Cell Lymphoma Treated With Anthracycline-Based Chemotherapy Plus Rituximab
- SUVmax reduction improves early prognosis value of interim positron emission tomography scans in diffuse large B-cell lymphoma
- Role of Functional Imaging in the Management of Lymphoma
- 18F-FDG PET/CT for Early Response Assessment in Diffuse Large B-Cell Lymphoma: Poor Predictive Value of International Harmonization Project Interpretation
- How I treat elderly patients with diffuse large B-cell lymphoma
- Can the Interim Fluorodeoxyglucose-Positron Emission Tomography Standardized Uptake Value Be Used to Determine the Need for Residual Mass Biopsy After Dose-Dense Immunochemotherapy for Advanced Diffuse Large B-Cell Lymphoma?
- Improvement of Early 18F-FDG PET Interpretation in Diffuse Large B-Cell Lymphoma: Importance of the Reference Background
- Reply to A. Huttmann et al
- Pitfalls of Interim Positron Emission Tomography Scanning in Diffuse Large B-Cell Lymphoma
- Interim positron emission tomography scans in diffuse large B-cell lymphoma: an independent expert nuclear medicine evaluation of the Eastern Cooperative Oncology Group E3404 study
- 18F-FDG Avidity in Lymphoma Readdressed: A Study of 766 Patients
- Expert Opinions on Positron Emission Tomography and Computed Tomography Imaging in Lymphoma
- Repeatability of 18F-FDG PET in a Multicenter Phase I Study of Patients with Advanced Gastrointestinal Malignancies
- Development and Application of a Real-Time On-Line Blinded Independent Central Review of Interim Pet Scans to Determine Treatment Allocation in Lymphoma Trials
- From RECIST to PERCIST: Evolving Considerations for PET Response Criteria in Solid Tumors
- Prognostic Value of Interim 18F-FDG PET in Patients with Diffuse Large B-Cell Lymphoma: SUV-Based Assessment at 4 Cycles of Chemotherapy
- 18F-FDG PET and PET/CT in the Evaluation of Cancer Treatment Response
- 18F-FDG PET/CT for Monitoring the Response of Lymphoma to Radioimmunotherapy
- Treatment Monitoring by 18F-FDG PET/CT in Patients with Sarcomas: Interobserver Variability of Quantitative Parameters in Treatment-Induced Changes in Histopathologically Responding and Nonresponding Tumors
- 18F-FDG PET in Non-Hodgkin's Lymphoma: Qualitative or Quantitative?