


Abstract
We retrospectively evaluated 18F-FDG PET/CT for monitoring the response of non-Hodgkin's lymphoma to radioimmunotherapy. Methods: A total of 33 clinical patients received 131I-tositumomab (n = 23) or 90Y-ibritumomab tiuxetan (n = 10) and underwent 18F-FDG PET/CT scans before radioimmunotherapy and at 12 wk after radioimmunotherapy. A third scan was performed on 13 patients at 24 wk after radioimmunotherapy, 12 of whom did not receive interval therapy. Tumor metabolic activity was assessed before and after radioimmunotherapy visually and quantitatively by lean maximum standardized uptake value (SUVlean max). Response was assessed by the International Workshop Criteria (IWC) and Revised IWC, which includes 18F-FDG PET (IWC-PET). Results: Mean SUVlean max decreased from baseline in 244 target lesions 12 wk after radioimmunotherapy (from 6.51 ± 4.05 to 3.94 ± 4.41; P < 0.01), regardless of response at 12 wk after radioimmunotherapy (P ≤ 0.02). After radioimmunotherapy, SUVlean max was lower for responders than for nonresponders (P ≤ 0.01). Median percentage change in SUVlean max of target lesions per patient was −51% (−95% to 97%). No significant difference in decline in SUVlean max between patients who received 131I-tositumomab and those who received 90Y-ibritumomab tiuxetan was demonstrated (−31% ± 51% vs. −47% ± 46%; P = 0.38). Patients with greater than a 52% decline in SUVlean max tended toward longer survival (P = 0.09) than those with lesser declines. The 12-wk overall response rate to radioimmunotherapy based on IWC was 42% (14/33); complete response rate was 15% (5/33). Eleven of 12 patients with progression at 12 wk had new disease sites, and in 4 patients, new disease sites were the only sites of progression. Of 108 lesions evaluated at 12 and 24 wk after radioimmunotherapy, 49 resolved at 12 wk and remained resolved at 24 wk, 17 gradually declined in SUV over 24 wk, and 37 initially decreased at 12 wk but increased at 24 wk. PET showed disease progression at 24 wk in 10 of 13 patients; 7 patients had new lesions and 1 was reclassified from partial response to complete response. Conclusion: In non-Hodgkin's lymphoma, 18F-FDG uptake in tumors typically drops significantly after radioimmunotherapy. A continued decline in tumor SUVlean max between 12 and 24 wk without additional therapy can occur, suggesting a need for delayed-response assessment. In patients who progress after radioimmunotherapy, new sites of disease commonly develop, rather than recurrence or progression at previous disease sites. Large declines in 18F-FDG uptake tend to be seen in those with the longest progression-free survival.
PET with 18F-FDG has emerged as a primary noninvasive imaging modality for disease staging, restaging, and monitoring response of lymphoma to chemotherapy and external-beam radiotherapy. Multiple studies have shown that 18F-FDG PET is superior to anatomic imaging for detecting active disease after therapy and that posttherapy 18F-FDG PET scans are highly predictive of progression-free survival (PFS) and overall survival (OS), with a positive scan being a strong negative prognostic factor (1–3). Standard anatomic response criteria in non-Hodgkin's lymphoma (NHL) and Hodgkin's lymphoma are being augmented with combined metabolic/anatomic criteria (4–6).
The initial studies evaluating 18F-FDG PET for monitoring the response of lymphoma were primarily obtained after the administration of cytotoxic agents or external-beam radiotherapy, the mainstays of lymphoma therapy for decades. The optimal time to obtain a posttherapy PET is not completely resolved, but a minimum of 10 d after chemotherapy has been recommended, to avoid false-negative and -positive scan findings due to early treatment effects of stunning (7) and inflammation (8). Longer and more variable times after external-beam radiation have been suggested (9).
Currently, many therapeutic regimens for B-cell lymphomas include the chimeric anti-CD20 monoclonal antibody rituximab (Rituxan; Genentech), in combination with chemotherapy or alone. Radiolabeled anti-CD20 monoclonal antibodies, 90Y-ibritumomab tiuxetan and 131I-tositumomab, are also available for treatment of refractory or relapsed low-grade, follicular, or transformed B-cell NHL as part of the Zevalin (Cell Therapeutics, Inc.) and Bexxar (GlaxoSmithKline) therapeutic regimens, respectively. In clinical trials investigating 90Y-ibritumomab tiuxetan and 131I-tositumomab in patients with recurrent NHL, overall response rates have ranged from 60% to 83%, with complete response rates of 15%−52% (10–14). Substantially higher response rates were reported for previously untreated NHL treated with 131I-tositumomab (15).
Limited data exist for monitoring the response of NHL to radioimmunotherapy with 18F-FDG PET (16–18). In 1 study, tumor metabolic activity 1–2 mo after the administration of 131I-tositumomab declined the most in complete responders, and 18F-FDG PET results appeared to be correlated with patients' ultimate best anatomic response to radioimmunotherapy (17). Metabolic activity declined gradually in some responders, in contrast to chemotherapy-induced changes in glucose metabolism, which can occur rapidly (19).
90Y-ibritumomab tiuxetan and 131I-tositumomab are used at our institution, and we previously reported our initial clinical radioimmunotherapy experience (20). We frequently evaluated response to therapy with 18F-FDG PET/CT. The purpose of this study was to retrospectively evaluate our experience using 18F-FDG PET/CT for monitoring the response of NHL to radioimmunotherapy.
MATERIALS AND METHODS
Permission to conduct this retrospective study was obtained from the Johns Hopkins Institutional Review Board under an expedited review. The requirement for informed consent was waived.
Patients and Therapy
A total of 33 patients were treated as part of routine clinical practice with radioimmunotherapy for refractory or relapsed B-cell NHL between 2002 and 2007 and identified as undergoing pre- and posttherapy 18F-FDG PET/CT scans. Of these 33 patients, 24 were included in the study population of the report on our initial clinical radioimmunotherapy experience (20). Patient characteristics are presented in Table 1.
Patient Characteristics
Twenty-three patients received 131I-tositumomab, and 10 received 90Y-ibritumomab tiuxetan. A total of 23 patients received full-dose radioimmunotherapy (n = 15, 75 cGy of 131I-tositumomab, or n = 8, 14.8 MBq of 90Y-ibritumomab tiuxetan per kilogram [0.4 mCi/kg]), and 10 patients received an attenuated dose of radioimmunotherapy because of baseline platelet counts less than 150,000 cells/mm3 or a history of myeloablative marrow transplant (n = 8, <75 cGy of 131I-tositumomab, or n = 2, 11.1 MBq of 90Y-ibritumomab tiuxetan per kilogram [0.3 mCi/kg]).
18F-FDG PET/CT Scans
All patients underwent a baseline 18F-FDG PET/CT scan before the start of radioimmunotherapy and at 12 wk after radioimmunotherapy to assess response for clinical purposes. Thirteen patients underwent a third PET/CT scan at 24 wk after radioimmunotherapy to further assess response. No patient received additional antilymphoma therapy between radioimmunotherapy administration and 12 wk after the radioimmunotherapy 18F-FDG PET/CT scan, although 1 patient underwent stem cell transplantation between the 12 and 24 wk scans.
18F-FDG PET/CT scans were performed using standard clinical protocols. Patients fasted for a minimum of 4 h and had blood glucose levels less than 200 mg/dL before intravenous injection of a weight-based amount of 18F-FDG (8.14 MBq/kg [0.22 mCi/kg]). Oral, but not intravenous, contrast material was administered for the CT portion of the study.
After an approximately 60-min tracer uptake phase, a combined PET/CT scan (Discovery LS or ST; GE Healthcare) was obtained from the mid-skull level to the mid-femur level. Whole-body CT was performed first, with 4-, 16-, or 64-slice multidetector helical scanners. CT parameters were specific for the particular scanner but are summarized as follows for the Discovery ST and LS: kVp of 120–140; weight-based amperage of 20–250 mA; CT rotation of 0.5 and 0.8 s, respectively; pitch of 0.984:1 and 1.5:1, respectively; and reconstructed slice thickness of 3.75 and 5 mm, respectively. Emission data were acquired in 2-dimensional mode for 5 min per bed position. PET images were reconstructed using the ordered-subset expectation maximization algorithm (2 iterations, 21 or 28 subsets), a 5.45- or 5.14-mm gaussian postfilter with a 128 × 128 matrix, and CT attenuation correction.
Image Analysis and Response Assessment
All 18F-FDG PET/CT scans (n = 79) were reviewed by 1 nuclear medicine physician with PET/CT fellowship training and American Board of Nuclear Medicine certification.
On baseline 18F-FDG PET/CT scans, we chose as target lesions up to 10 tumors (per patient) with the most visually intense 18F-FDG uptake, larger than 1 cm, and representative of all involved organs. The single-pixel maximum standardized uptake value adjusted for lean body mass (SUVlean max) and maximal 2-dimensional size of each target lesion were determined.
After radioimmunotherapy, the maximal 2-dimensional size of each baseline target lesion was determined. Visual and semiquantitative assessments of metabolic tumor response were performed. The single-pixel SUVlean max was determined in all target lesions and in the location of treated tumor (background SUVlean max) if tumor metabolic activity had completely resolved by visual inspection. The percentage change in tumor size and SUVlean max between baseline and postradioimmunotherapy scans was calculated. Change in size and 18F-FDG uptake in nontarget lesions and the presence and 18F-FDG uptake of new lesions were also recorded and considered for the overall response assessment.
Response to radioimmunotherapy at 12 wk after therapy was classified on the basis of the International Workshop Criteria (IWC) (21) and Revised IWC, which includes 18F-FDG PET (IWC-PET) (5). Twelve-week responses to radioimmunotherapy were correlated with OS and PFS, if available. OS was defined as time from radioimmunotherapy until death from any cause or time of last censor (March 2008). PFS was defined as time from radioimmunotherapy until date of objective progression by CT or PET/CT.
Statistical Analysis
Means were compared between 2 groups using 2-tailed paired and unpaired t tests. ANOVA and post hoc Tukey tests were used for comparing means between 3 or more groups. OS and PFS were estimated using Kaplan–Meier curves and log-rank (Mantel–Cox) tests. Relationships between percentage change in SUVlean max and CT size were evaluated with Pearson correlation coefficients. P values less than 0.05 were considered statistically significant. Statistical analyses were performed with StatView (SAS Institute), Systat 12 (Systat Software), and JROCFIT (www.jrocfit.org).
RESULTS
Overall Response at 12 Wk After Radioimmunotherapy
The overall response rate to radioimmunotherapy 12 wk after therapy based on IWC was 42% (14/33), and the complete-response (CR) rate was 15% (5/33). Fifteen percent (5/33) of the patients had an alteration of 12-wk response classification from IWC using IWC-PET (Table 2).
Discordant Response Assessments by IWC vs. IWC-PET
18F-FDG PET/CT Lesion Analyses 12 Wk After Radioimmunotherapy
No significant differences were found in several patient and technical parameters known to affect SUV, including blood glucose levels and 18F-FDG uptake time, between the baseline and 12-wk postradioimmunotherapy scans (data not shown). Patients' lean body mass was significantly less on the 12-wk postradioimmunotherapy scan than on the baseline scan (57.2 ± 9.2 kg vs. 56.7 ± 8.8 kg; P = 0.03). In the 13 patients with baseline, 12-, and 24-wk postradioimmunotherapy scans, no significant differences were found in the above parameters between the scans.
A total of 244 target lesions were identified and evaluated. The median number of target lesions per patient was 8 (range, 2–10). The results of semiquantitative analyses of 18F-FDG uptake before and after radioimmunotherapy are presented in Table 3. SUVlean max declined significantly versus baseline in target lesions 12 wk after therapy regardless of response. Baseline SUVlean max of target lesions was not predictive of 12-wk response. This was also true for the lesion with the highest SUVlean max and for the lesions with the highest 3 SUVs (data not shown). After therapy, SUVlean max of target lesions was lower in patients with a CR or partial response (PR) than in those with stable disease (SD) or progressive disease (PD).
Semiquantitative Assessment of Metabolic Tumor Response in Target Lesions
The largest dimension of target lesions was smaller after therapy, compared with baseline (18 ± 17 mm vs. 28 ± 20 mm; P < 0.001). Baseline size did not predict response to therapy.
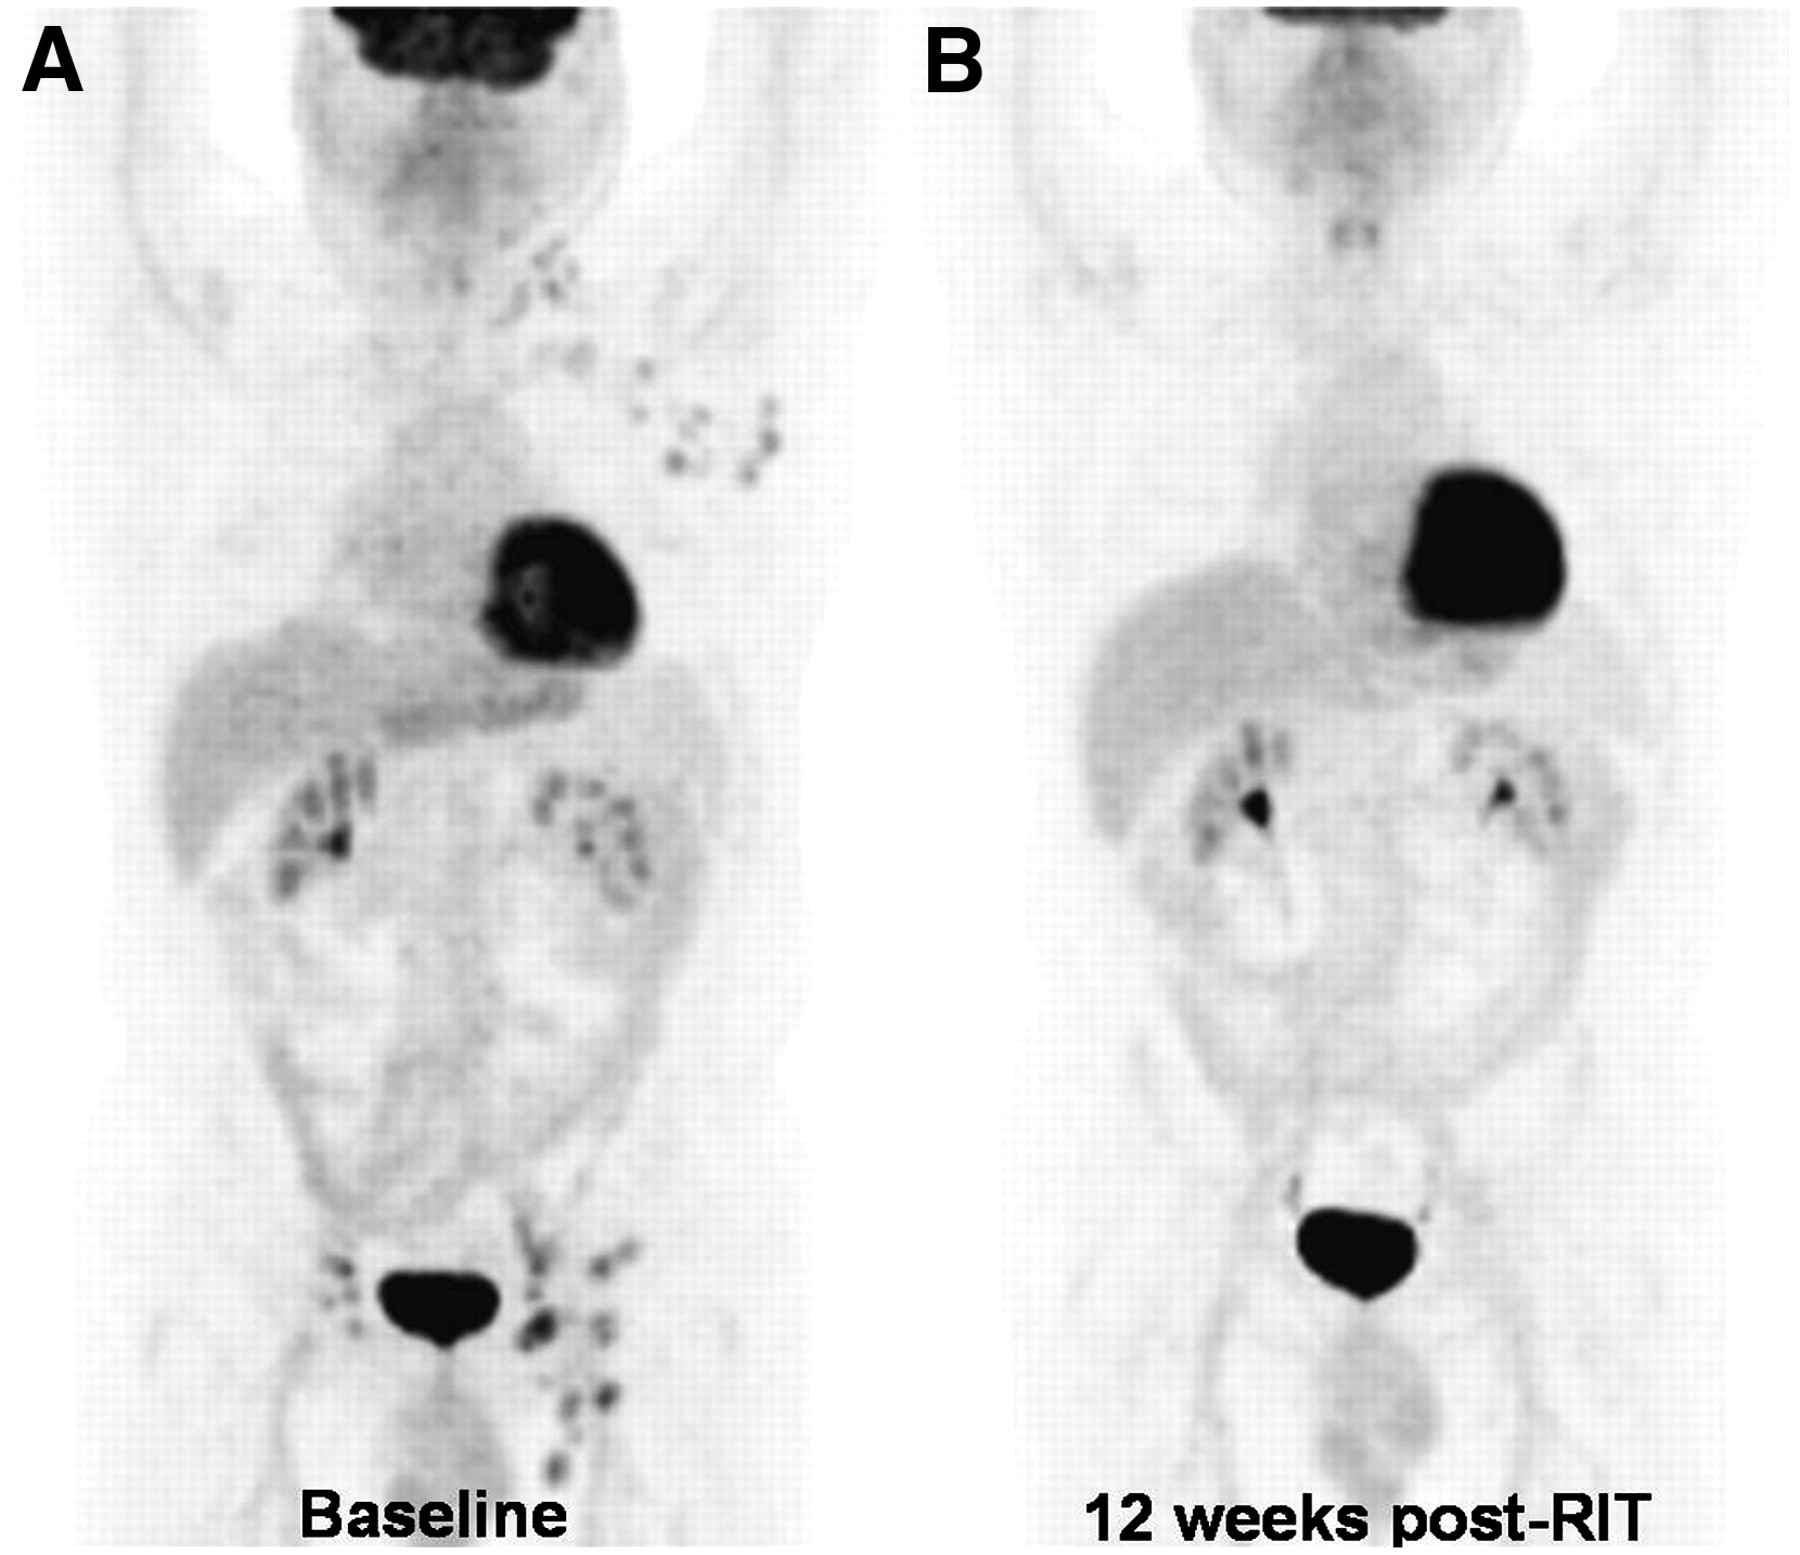
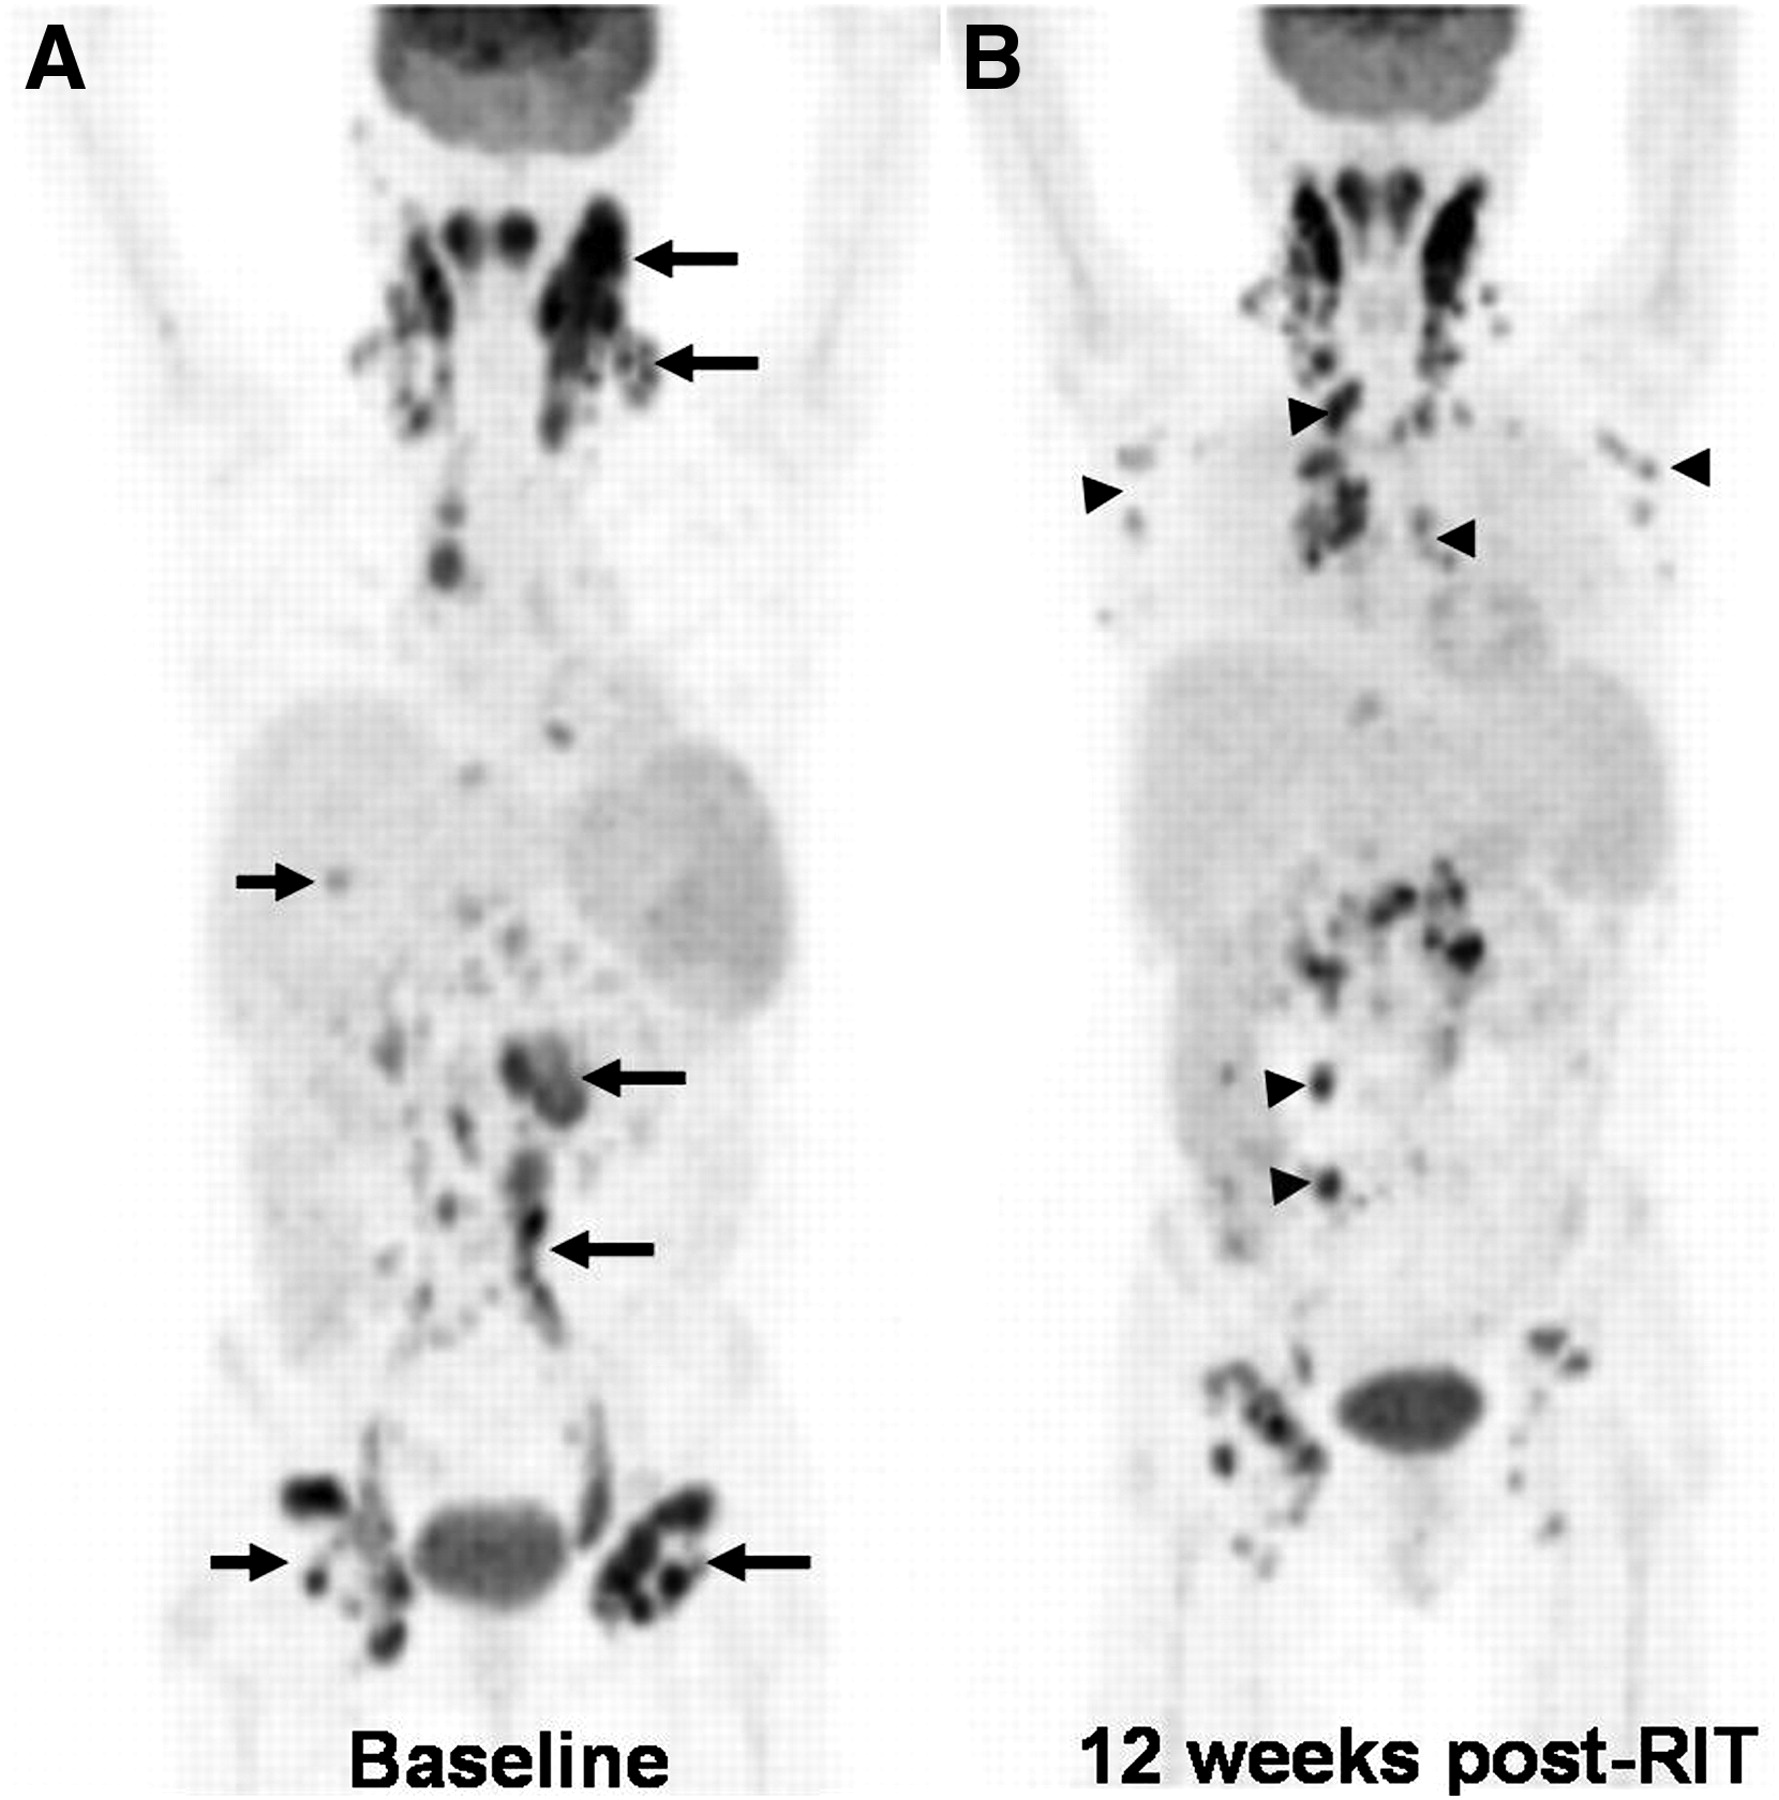
Eighteen patients had a decrease in SUVlean max of all their target lesions (homogeneous response; Fig. 1); 15 patients had a heterogeneous response in which some lesions had a decrease in SUVlean max after therapy, whereas some increased (Fig. 2). Baseline SUVlean max did not predict a homogeneous (6.68 ± 4.00) versus heterogeneous (6.32 ± 4.12) response at 12 wk after therapy (P = 0.48).

Homogeneous response to radioimmunotherapy. A 67-y-old man with grade 2, follicular NHL presented with progressive disease after rituximab and chemotherapy. Baseline 18F-FDG PET scan (A) revealed 18F-FDG–avid adenopathy in left neck, left axilla, and bilateral inguinal regions, which suggested active NHL. Patient received 65-cGy total-body radiation dose of 131I-tositumomab. 18F-FDG PET scan at 12 wk after therapy (B) revealed complete resolution of abnormal metabolic activity, and he remained in complete remission for 15.5 mo after radioimmunotherapy.

Heterogeneous response to radioimmunotherapy. A 58-y-old woman with grade 3, follicular NHL status after first-line chemotherapy, rituximab alone, and salvage chemotherapy presented with progressive NHL. Baseline 18F-FDG PET scan (A) revealed 18F-FDG–avid adenopathy in mediastinum, bilateral tonsillar, cervical, paraaortic, and inguinal regions (arrows), indicating active NHL. Spleen was also enlarged, with moderately increased 18F-FDG activity suggestive of lymphomatous involvement. Patient received 65-cGy total-body radiation dose of 131I-tositumomab. 18F-FDG PET scan at 12 wk after therapy (B) revealed decreased 18F-FDG activity in some target lesions (A, arrows), but others increased and new lesions developed (B, arrowheads).
For target lesions, there was a significant correlation between percentage change in SUVlean max and largest tumor diameter (r = 0.62, P < 0.001) and maximal 2-dimensional size (r = 0.48, P < 0.001). The mean percentage changes in SUVlean max (−34% ± 62%) and largest tumor diameter (−36% ± 40%; P = 0.66) or maximal 2-dimensional size (−41% ± 85%; P = 0.28) between the baseline and postradioimmunotherapy scans were not significantly different. Similar findings were observed when only the lesion with the most 18F-FDG activity was considered (data not shown).
The median percentage change in SUVlean max of target lesions per patient was −51% (range, −95% to 97%). The median percentage change in SUVlean max of target lesions for the 5 patients with a CR/CR unconfirmed (CRu) by IWC was −75% (−58% to −95%), and with a CR by IWC-PET it was −78% (−65% to −95%).
Comparisons between patients who received 131I-tositumomab versus 90Y-ibritumomab tiuxetan are presented in Table 4. No significant differences were observed between the radioimmunotherapy agents for baseline or postradioimmunotherapy SUVlean max, posttherapy sum of the products of the largest dimensions (SPD), or percentage declines in SUVlean max and SPD. Target lesions in the patients who received 90Y-ibritumomab tiuxetan tended to be larger at baseline (Table 4).
131I-Tositumomab vs. 90Y-Ibritumomab Tiuxetan
No significant differences were found in percentage change in SUVlean max between pre- and postradioimmunotherapy scans for patients with low-grade follicular NHL (−32% ± 55%) versus non–low-grade follicular NHL (−41% ± 42%; P = 0.62) or aggressive NHL (−53% ± 24%; P = 0.26). The same was true for percentage changes in maximal 2-dimensional size (low-grade follicular NHL, −44% ± 46%; non–low-grade follicular NHL, −49% ± 35%; aggressive NHL, −55% ± 29%; P = 0.50).
Eleven of 33 total patients and of 12 with PD at 12 wk had new lesions identified on the 12-wk postradioimmunotherapy PET/CT scan. Four were classified as PD because of the presence of only new lesions, whereas 7 progressed at both old and new sites. Baseline SUVlean max was not different between patients with and without new lesions (7.00 ± 4.15 vs. 6.19 ± 3.97; P = 0.13). Percentage change in 18F-FDG activity of target lesions was significantly less for patients with new lesions versus those without new lesions (−6% ± 56% vs. −50% ± 39%; P = 0.01), as was percentage change in tumor size (−15% ± 50% vs. −62% ± 25%; P < 0.01).
Long-Term Follow-up and Survival
Median follow-up time was 18.7 mo (range, 2.6–45.2 mo). One of the 5 patients who achieved a CR at 12 wk after radioimmunotherapy remains in remission at the time this article is being prepared, 40 mo after therapy. Three progressed at 6.2, 7.3, and 14 mo after radioimmunotherapy. One died without interval follow-up. One of the 9 patients who achieved a PR at the 12-wk postradioimmunotherapy scan showed continued improvement on the 24-wk scan, without interval therapy, and remains in CR 28 mo after radioimmunotherapy. Two other patients with PRs at 12 wk received additional therapy and are alive and in remission at 11 and 45 mo after radioimmunotherapy. All patients with SD at 12 wk after radioimmunotherapy subsequently progressed.
There was significantly longer OS for responders versus nonresponders determined by IWC (P = 0.05) and IWC-PET (P = 0.03) at 12 wk after radioimmunotherapy (Fig. 3A). Figure 3B shows that OS was not significantly longer for patients who achieved a CR on IWC-PET versus those who did not (P = 0.48).

OS vs. 12-wk response. (A) Response (CR/PR) at 12 wk after radioimmunotherapy is associated with significantly longer OS, compared with no response (SD/PD), by both IWC and IWC-PET. (B) OS was not significantly longer for patients with CR by IWC-PET vs. no CR. PFS tended to be longer for CR group.
Seventeen patients who did not progress at 12 wk after radioimmunotherapy (CR, PR, or SD) had data available to determine PFS. One patient was removed from this analysis because he received a stem cell transplant soon after radioimmunotherapy for consolidation therapy without disease progression. The other 16 received no additional therapy before their diagnosis of PD. The mean PFS was significantly longer for patients who achieved a CR/CRu (27.4 ± 15.7 mo) than for those who achieved a PR (7.7 ± 3.9 mo; P < 0.01) and SD (5.5 ± 2.1 mo; P < 0.01) by IWC. The mean PFS was longer, with a better response documented by the IWC-PET, and tended to be longer for those with a CR than for those without a CR (0.06).
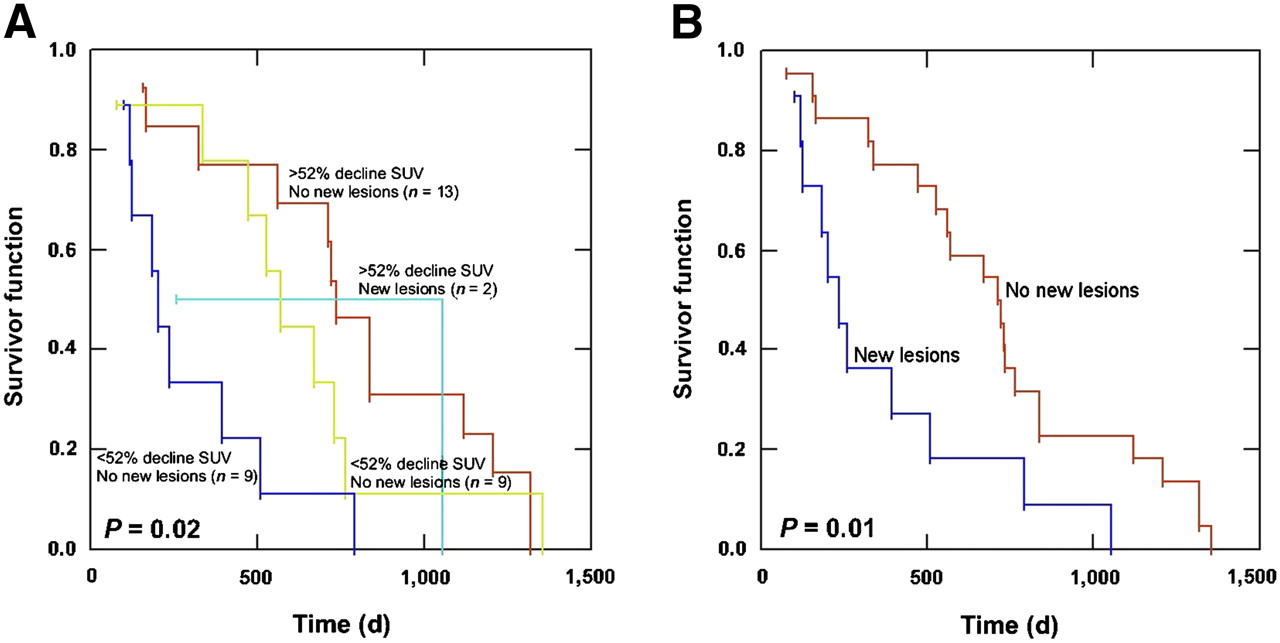
Figure 4 shows the Kaplan–Meier estimate of OS when patients were grouped according to percentage change in SUVlean max and the presence or absence of new lesions at 12 wk after radioimmunotherapy. Receiver-operator-curve analysis demonstrated that a decline in SUVlean max of 52% was optimal to differentiate metabolic responders from nonresponders at 12 wk after radioimmunotherapy (data not shown). The standard of reference was a 12-wk response by IWC. A trend to better OS (P = 0.09) was seen for patients with a decline in SUVlean max greater than 52% versus those with a decline less than 52%. Patients without the presence of new lesions at 12 wk had better OS than did those with new lesions, regardless of whether percentage change of SUV was considered.

OS vs. percentage change in SUVlean max and new lesions. (A) OS is longer for patients with decline in SUVlean max greater than 52% and no new lesions (n = 13) than for those with decline in SUVlean max less than 52% and new lesions (n = 9). In patients without new lesions at 12 wk after radioimmunotherapy, there was no significant difference in OS based on percentage change in SUVlean max greater or less than 52% (P = 0.89). (B) OS was better for patients without new lesions on 12-wk PET scan than for those with new lesions (P = 0.01).
18F-FDG PET/CT Scans 24 Wk After Radioimmunotherapy
Thirteen of 33 patients underwent an additional 18F-FDG PET/CT scan at 24 wk after radioimmunotherapy. Two patients had a continued decline in SUV of target lesions at 24 wk—1 with CR and 1 with mild residual activity at 24 wk that was eventually determined to represent inflammation (Fig. 5)—and remained in remission at 32 and 40 mo after radioimmunotherapy. One patient had SD, and 10 progressed. In 7 of the 10 patients with progression, new sites of disease developed, and in 4 these were the only areas of disease. The 3 patients without progression at 24 wk tended to have longer OS than did the 10 with progression (P = 0.06).

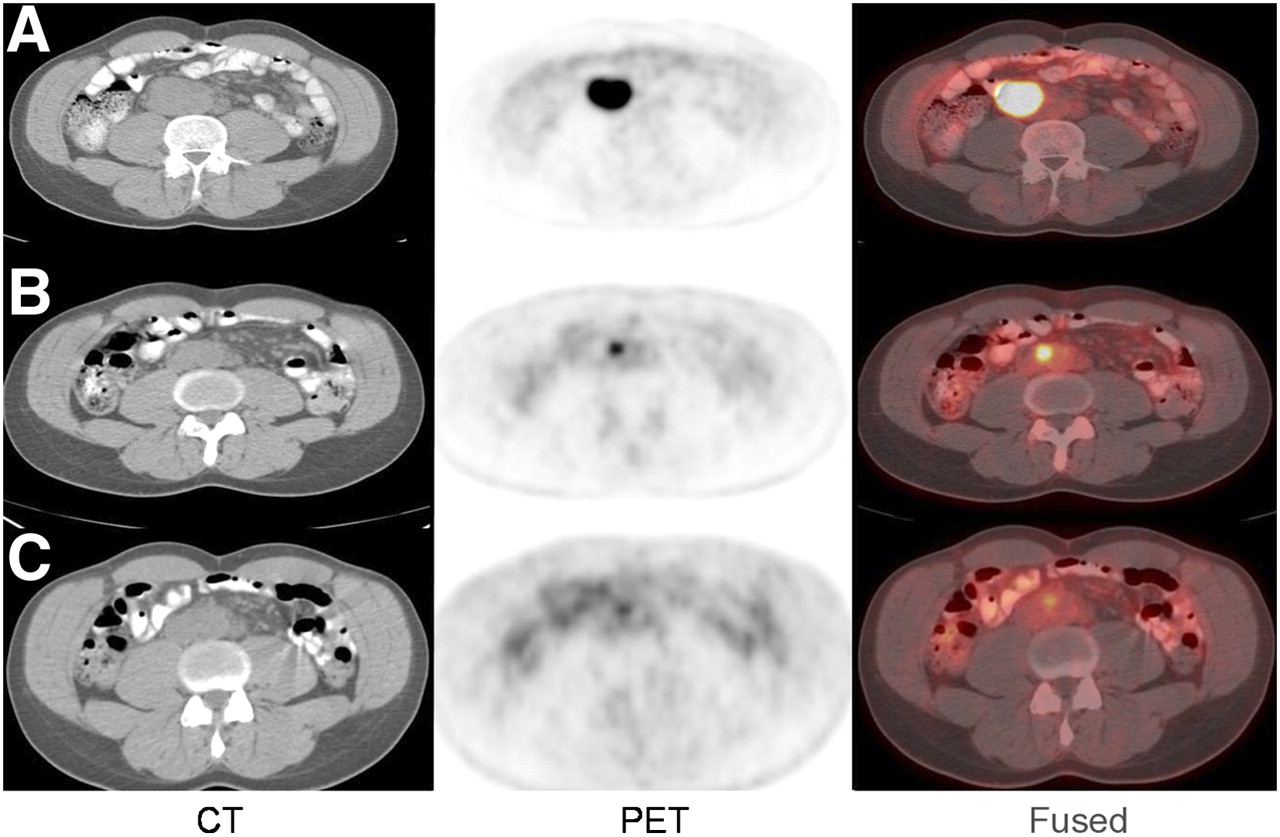
Gradual decline in metabolic activity after radioimmunotherapy. A 41-y-old man with low-grade follicular NHL status after R-CHOP and ICE chemotherapy and myeloablative allotransplant presented with enlarging aortocaval lymph node. Baseline 18F-FDG PET/CT scan (A) before radioimmunotherapy demonstrated 4.8 × 3.6 cm aortocaval lymph node with SUVlean max of 13.3. A 55-cGy total-body radiation dose of 131I-tositumomab was administered because of patient's history of transplant. Follow-up 18F-FDG PET/CT scans at 12 (B) and 24 (C) wk after radioimmunotherapy demonstrated gradual decline in size (1.8 × 1.3 and 1.2 × 0.7 cm) and metabolic activity (SUVlean max, 4.42 and 2.72) of lymph node. Patient underwent additional 18F-FDG PET/CT scan that demonstrated no change in metabolic activity of aortocaval node from 24-wk scan. He remains without evidence of active NHL 28 mo after radioimmunotherapy.
The change in metabolic activity of 108 target lesions was evaluated over a 24-wk period after radioimmunotherapy. Forty-nine lesions resolved at 12 wk and remained in remission at 24 wk after radioimmunotherapy. Seventeen lesions had gradually declining SUVs over 24 wk. SUV initially decreased in 37 lesions at 12 wk but then increased at 24 wk. Four lesions had an increase and subsequent decrease in SUV, and 1 had a gradual increase over 24 wk. For lesions with a PR on the 12-wk scan, neither the baseline SUV nor the percentage decline in SUV at 12 wk was predictive of whether a lesion subsequently increased or decreased on the 24-wk scan.
DISCUSSION
The ample data supporting the use of 18F-FDG PET as the best modality for monitoring the response of lymphoma to standard therapies (1–6) prompted us to investigate the role of 18F-FDG PET/CT in the setting of radioimmunotherapy. The results of our study support our hypothesis that the information provided by combined 18F-FDG PET/CT is informative for monitoring the response of lymphoma to radioimmunotherapy, and several interesting findings were observed.
Patients who responded to radioimmunotherapy at 12 wk had longer OS, compared with nonresponders, using IWC or IWC-PET. Response by IWC-PET was minimally more predictive (more significant P value) of OS than was IWC alone. In general, this is concordant with prior reports but limited by the small number of patients in each response subgroup.
Compared with clinical trials evaluating radioimmunotherapy (10–14), our overall and complete response rates, 42% and 15%, respectively, were lower, probably because of a bias to refer patients who were sicker or had transformed, aggressive histologies and because of less stringent acceptance criteria for a patient to receive therapy. The 15% overall discordance rate between IWC-PET and IWC is lower than previously reported (5,6). Juweid et al. reported that response classification after chemotherapy was altered in 38% of patients with aggressive lymphoma (6). Although the number of cases is too limited to draw definitive conclusions, in 4 of the 5 discordant cases response by IWC-PET was probably more predictive of overall outcome than was response by IWC alone (Table 2). The largest group after chemotherapy accounting for differences in response classification is patients with 18F-FDG PET–negative residual masses on CT (6). The frequency of residual fibrosis or scarring may be higher with aggressive than with low-grade NHL or less after radioimmunotherapy than after chemotherapy, but the latter has not been studied.
Ulaner et al. (18) reported on 10 patients with refractory or relapsed NHL who underwent 18F-FDG PET/CT for restaging 4–6 mo after 90Y-ibritumomab tiuxetan, and our results are similar. Response assessments were concordant between IWC and IWC-PET in 8 cases (80%) but discordant in 2 (20%). The latter 2 patients had residual masses on CT (PR by IWC) that were 18F-FDG–negative (CR by IWC-PET), and they were without evidence of active lymphoma through 18 and 20 mo of follow-up, suggesting that the PET results were correct.
The use of 18F-FDG PET for routinely monitoring the response of “incurable” low-grade follicular lymphoma (the major indication for radioimmunotherapy) and other indolent lymphomas is debatable. 18F-FDG PET scans are recommended, by some, only in clinical trials when response rates are the primary endpoints and only if the pretreatment scan is “positive” (5). All patients in the present study had a positive pretreatment PET scan.
Semiquantitative analyses with SUV are not currently viewed as necessary to determine PET positivity at the conclusion of chemotherapy and radiation therapy (22). We applied IWC-PET criteria in our study to assess response to therapy. The percentage change in SUV at 12 wk after radioimmunotherapy was also calculated as an exploratory measure to determine whether it might be useful for predicting OS after radioimmunotherapy. We did not attempt to prospectively classify response on the basis of changes in SUV because currently there are no established values. The level of 18F-FDG uptake before radioimmunotherapy in target lesions did not provide prognostic information in our study, similar to the report by Torizuka et al. (17) but in contrast to data after chemotherapy (23). Another study suggests that an SUV-based assessment of mid-therapy response in patients with aggressive NHL improves the prognostic value of early PET, compared with the visual assessment (24). This might not hold true in the posttherapy setting, but prospective validation of semiquantitative criteria for determining response may prove helpful in the future, particularly in the setting of residual masses on CT.
No significant differences between 131I-tositumomab and 90Y-ibritumomab tiuxetan were found for changes in tumor metabolism and CT size after radioimmunotherapy.
Tumors treated with 90Y-ibritumomab tiuxetan tended to be larger at baseline than did tumors treated with 131I-tositumomab, but this difference likely reflects a bias in patient selection. 90Y emits a more energetic β-particle and has a longer pathlength in tissue than does 131I (average energy, 935 vs. 183 keV; mean pathlength, 0.25 vs. 0.04 cm, respectively). In Monte Carlo–based dosimetry simulation studies, 90Y-labeled antibodies had higher therapeutic efficacy ratios for tumors greater than 5 cm, whereas 131I-labeled antibodies had the advantage for smaller tumors (25). The lack of difference in percentage change in tumor size between the groups might also be explained by the longer pathlength of the 90Y.
The time course of metabolic response after radioimmunotherapy, compared with the rapid response seen after chemotherapy, may be more gradual. Torizuka et al. (17) observed that SUVlean in a 2 × 2 pixel region of interest over maximal tumor uptake at 1–2 mo after radioimmunotherapy correlated well with ultimate NHL response but that earlier changes in 18F-FDG uptake after the tracer dose or 5–7 d after radioimmunotherapy were less well correlated. We also observed a gradual decline in the SUV of target lesions, consistent with ongoing response, in 4 of 13 patients with PET scans beyond 12 wk after radioimmunotherapy. Gradual regression of refractory ovarian cancer treated with 131I-anti–carcinoembryonic antigen monoclonal antibody has also been reported (26). Alternative mechanisms of cell death by radiotherapy versus chemotherapy might explain this finding.
Mitotic cell death occurs during division because of the presence of damaged chromosomes immediately after acquisition of the aberration or in subsequent cell cycles. This process is observed in vitro as a time delay to cell death. Apoptosis, or programmed cell death, occurs as a result of a specific sequence of cellular events, and in this setting, cell-survival curves are linear. Most cell lines have contributions from both mechanisms of cell death, but one can predominate. Radiation most commonly induces mitotic cell death, but a higher proportion of apoptosis is associated with increasing radiosensitivity. Lymphoma, a radiosensitive tumor, has a substantial component of apoptotic cell death after external-beam radiation (27). The exact mechanisms of cell death after radioimmunotherapy is unknown, but it is possible that a mitotic component (or delayed immunologic effects) may contribute to the observed gradual decline in SUV.
The optimal timing to obtain a PET scan after radioimmunotherapy has not been defined. Management options for patients with a CR or PD 12 wk after radioimmunotherapy, follow-up or possibly additional therapy, respectively, seem readily defined. Patients with a PR are more challenging because some may have a continued response, warranting further observation, whereas others may progress, necessitating treatment. A longer delay to initial response assessment might allow more accurate assessment of a slow responder, but a long delay clearly would not be acceptable in the case of a nonresponding patient who would potentially benefit from earlier detection of disease and further treatment.
Several studies have suggested that 18F-FDG PET scans obtained earlier than 12 wk after radioimmunotherapy provide important prognostic information and predict response (17,28,29). Shrikanthan et al. (29) performed 18F-FDG PET on 21 patients with lymphoma 4–6 wk after radioimmunotherapy and found longer responses for patients who responded than for those who did not. In 22 patients with NHL, a positive PET finding 6 wk after fractionated 90Y-epratuzumab, an anti-CD22 monoclonal antibody, was also associated with a shorter time to progression than were negative results (5.4 mo vs. 15.6 mo) (28).
An interesting finding in our study was the pattern of progressive disease due only to new lesions not previously seen on PET. This distribution of failure patterns outside sites of initial disease has been described after treatment of lymphoma with both radioimmunotherapy and external-beam radiation therapy (30,31). After front-line 131I-tositumomab for follicular NHL, sites of bulky disease that completely responded were not at increased risk for recurrence (31). Recurrence occurs less frequently at new sites after chemotherapy alone (30,31). These data, along with ours, suggest that the quality of the initial response may predict long-term outcome and that progressive disease or relapse may be more likely to occur at new sites of disease than at sites of previous involvement.
Careful evaluation of the Kaplan–Meier curves reveals that improved OS is more likely related to the absence of new lesions at 12 wk after radioimmunotherapy than to the percentage decline in SUVlean max of target lesions. This conclusion is limited, however, by the small number of patients that resulted when patients were grouped on the basis of percentage decline in SUVlean max of target lesions and the presence or absence of new lesions.
The major limitations of this study are its retrospective nature, relatively small patient numbers, heterogeneity of lymphoma subtypes, and the use of 2 different radioimmunotherapy agents. These somewhat limit definitive conclusions from being drawn and suggest that additional studies are required before final recommendations can be made on the use of 18F-FDG PET/CT for monitoring the response of radioimmunotherapy.
CONCLUSION
18F-FDG PET/CT is a useful noninvasive imaging technique for monitoring the response of NHL to radioimmunotherapy. 18F-FDG uptake typically declines significantly with radioimmunotherapy. A complete disappearance of 18F-FDG uptake after radioimmunotherapy is associated with the longest PFS. A wide range of glycolytic responses of NHL lesions to radioimmunotherapy can be observed, and baseline SUVlean max is not predictive of response. Metabolic response to radioimmunotherapy can be gradual, with continued declines in SUVlean max occurring between 12 and 24 wk after radioimmunotherapy without additional therapy. In patients who progress after radioimmunotherapy, new sites of disease commonly develop, rather than recurrence at previous disease sites.
Acknowledgments
We thank Judy Buchanan for her assistance preparing this manuscript. Dr. Wahl holds patents on 131I-tositumomab and 90Y-ibritumomab tiuxetan and receives royalties via a licensing agreement with the University of Michigan when both agents are used clinically in the United States. These financial arrangements are reviewed and managed by the Johns Hopkins Office of Policy Coordination. Dr. Jacene receives research support from GlaxoSmithKline.
Footnotes
-
COPYRIGHT © 2009 by the Society of Nuclear Medicine, Inc.
References
- Received for publication June 23, 2008.
- Accepted for publication September 22, 2008.


Jump to section
Related Articles
Cited By...
- Prediction of Response to Immune Checkpoint Inhibitor Therapy Using Early-Time-Point 18F-FDG PET/CT Imaging in Patients with Advanced Melanoma
- End-Therapy Positron Emission Tomography for Treatment Response Assessment in Follicular Lymphoma: A Systematic Review and Meta-analysis
- Expert Opinions on Positron Emission Tomography and Computed Tomography Imaging in Lymphoma
- From RECIST to PERCIST: Evolving Considerations for PET Response Criteria in Solid Tumors