


Abstract
Markers predictive of treatment effect might be useful to improve the treatment of patients with metastatic solid tumors. Particularly, early changes in tumor metabolism measured by PET/CT with 18F-FDG could predict the efficacy of treatment better than standard dimensional Response Evaluation Criteria In Solid Tumors (RECIST) response. Methods: We performed PET/CT evaluation before and after 1 cycle of treatment in patients with resectable liver metastases from colorectal cancer, within a phase 2 trial of preoperative FOLFIRI plus bevacizumab. For each lesion, the maximum standardized uptake value (SUV) and the total lesion glycolysis (TLG) were determined. On the basis of previous studies, a ≤ −50% change from baseline was used as a threshold for significant metabolic response for maximum SUV and, exploratively, for TLG. Standard RECIST response was assessed with CT after 3 mo of treatment. Pathologic response was assessed in patients undergoing resection. The association between metabolic and CT/RECIST and pathologic response was tested with the McNemar test; the ability to predict progression-free survival (PFS) and overall survival (OS) was tested with the Log-rank test and a multivariable Cox model. Results: Thirty-three patients were analyzed. After treatment, there was a notable decrease of all the parameters measured by PET/CT. Early metabolic PET/CT response (either SUV- or TLG-based) had a stronger, independent and statistically significant predictive value for PFS and OS than both CT/RECIST and pathologic response at multivariate analysis, although with different degrees of statistical significance. The predictive value of CT/RECIST response was not significant at multivariate analysis. Conclusion: PET/CT response was significantly predictive of long-term outcomes during preoperative treatment of patients with liver metastases from colorectal cancer, and its predictive ability was higher than that of CT/RECIST response after 3 mo of treatment. Such findings need to be confirmed by larger prospective trials.
The use of PET/CT with 18F-FDG for staging patients with colorectal cancer (CRC) might be of interest for its sensitivity in detecting extrahepatic disease (1–3). It is suggested that the additional cost of PET/CT can be largely offset by the reduction of useless surgery, thanks to the identification of actually inoperable patients (4–6).
In addition, metabolic imaging techniques might be used as a biomarker of cancer response and might be able to predict treatment efficacy (7,8). PET/CT might be a powerful tool in this direction. For example, a PET/CT scan is usually obtained at baseline and after 1 or 2 cycles of treatment to determine whether the treatment is effective in lymphoma patients (9,10). The rapid readout of treatment effects that would allow prompt interruption of ineffective therapies and the possibility of proposing alternative options to patients is an extremely attractive perspective for tailoring health care.
For this reason, in a phase 2 trial of preoperative chemotherapy plus bevacizumab, in patients with resectable liver metastases from CRC, we explored as a secondary endpoint the ability of early PET/CT to predict long-term outcomes. Furthermore, we also explored the relative predictive ability of early PET/CT as compared with that of classic dimensional objective response defined with CT scan according to Response Evaluation Criteria In Solid Tumors (RECIST). Finally, thanks to the neoadjuvant setting, we also tested the predictive ability of PET/CT, compared with that of pathologic response.
MATERIALS AND METHODS
Patients
Patients aged 18–75, with an Eastern Cooperative Group performance status of 0 or 1, with resectable liver metastases from CRC, from a phase 2 trial were eligible for this analysis if they had both baseline and posttreatment PET/CT assessment, as planned within a phase 2 study protocol of preoperative systemic treatment (11). Patients provided written informed consent. The study was approved by the Ethical Committee of the National Cancer Institute of Naples, Italy.
Treatment
Patients received preoperative FOLFIRI plus bevacizumab. FOLFIRI was administered intravenously every 14 d with irinotecan (180 mg/m2 intravenous infusion on day 1), leucovorin (200 mg/m2 intravenous infusion on day 1), 5-fluorouracil (400 mg/m2 by intravenous bolus on day 1), and 5-fluorouracil (2,400 mg/m2 46-h continuous infusion); bevacizumab was administered at 5 mg/kg by intravenous infusion over 90 min, at the first cycle, then, if tolerated, over 60 min. The treatment was administered every 14 d, for 7 cycles; bevacizumab was stopped at cycle 6.
Assessment Procedures
Two PET/CT scans were included within the flow of examinations planned by the protocol, the first before treatment, as part of the baseline work-up to exclude the presence of extrahepatic metastases, and the second after the first treatment cycle, immediately before the second administration of chemotherapy (∼day 14), to assess early response to treatment.
According to standard clinical practice, patients underwent radiologic restaging after 3 mo of treatment, also in view of a possible surgical intervention. Assessment of the size of each tumor lesion for staging and restaging was performed with contrast-enhanced spiral CT scanning; response was categorized according to RECIST 1.0. For patients undergoing surgical intervention, pathologic response was assessed according to Mandard’s classification system (12); patients with complete (TRG1) or partial (TRG2 or TRG3) response were considered responders.
PET/CT Imaging Protocol and Semiquantitative Analysis
PET/CT studies were acquired on a Discovery 600 (GE Healthcare) 45–75 min after the injection of 18F-FDG (3.7 MBq/kg; megabecquerel of injected dose: mean ± SD 280.1 ± 46.1). Patients fasted for at least 6 h before injection, and their blood glucose level was less than 200 mg/dL.
Whole-body CT was performed using a continuous spiral technique with a 16-slice helical CT scanner (140 keV, 40–120 mAs adjusted to each patients' body weight; section width, 3–4 mm). After each CT scan, an emission scan was obtained from thigh to head for 3 min per frame in 3-dimensional mode. Attenuation-corrected PET images using CT data were reconstructed by an ordered subsets-expectation maximization algorithm (3D-OSEM, VUE-point HD; GE Healthcare) with all corrections (scatter, random, dead time, attenuation, and normalization) incorporated into the iterative scheme of reconstruction.
All PET/CT images were reviewed by 2 experienced nuclear medicine physicians on a dedicated workstation (Advantage Workstation 4.4; GE Healthcare) using Volume Viewer software.
Semiquantitative analysis on the hepatic lesions was performed by displaying PET images with a fixed window (0–5 standardized uptake value [SUV]). Volumes of interest for each tumor lesion were generated using an isocontour threshold method that was visually adjusted and verified on the transverse, sagittal, and coronal planes, to include the entire visible area of increased uptake. Pretreatment and follow-up studies were analyzed simultaneously by the same reader. The total volume of the pixels within the isocontoured region was defined as the metabolic tumor volume. For each lesion, the following parameters were determined: the maximum SUV (SUVmax), the mean SUV (SUVmean), and the total lesion glycolysis (TLG), defined as the product of SUVmean by the metabolic tumor volume for each hepatic lesion.
Definition of Metabolic Response
To assess metabolic response, we used 6 measures based on SUV and TLG (Table 1). The highest SUVmax and highest TLG were defined as the largest observed SUVmax and TLG within each patient, respectively. Both measures are indicators of the level of tumor metabolism, independently of the number of neoplastic lesions. The same definition applied to baseline and posttreatment scans, although the lesions from which the highest SUVmax and TLG were derived were not needed to be the same. Response was defined as a change ≤ −50%, representing a reduction equal to or greater than 50%.
Summary of Methods Applied for PET/CT Response Definition
Total SUVmax and total TLG were obtained by summing up SUVmax and TLG for all the lesions within each patient, respectively, both at baseline and after treatment. These measures clearly depend on the number of lesions and on tumor burden in addition to the level of tumor metabolism. Response was defined as a change ≤ −50%, representing a reduction equal to or greater than 50%.
SUVmax by lesion and TLG by lesion follow a different calculation. Changes in SUVmax (or TLG) from posttreatment to baseline scan were calculated for each lesion; a patient was defined as a responder if a ≤ −50% change in SUVmax (or TLG) was observed in all the lesions. These 2 measures could be interpreted as indicators of the extent of the tumor response and are quite conservative—that is, to reduce false-positive (false responder) patients, only subjects with a strong response to treatment were defined as responders. Therefore, in the assessment of metabolic response we used 4 patient-based measures and 2 lesion-based measures.
Statistics
The association between PET/CT and CT/RECIST or pathologic response was assessed by testing the symmetry of discordant pairs by exact McNemar test. Progression-free survival (PFS) was defined as the time elapsed from the date of enrollment to the date of disease progression or the date of last assessment for those not progressed. Overall survival (OS) was the time from enrollment to death or to the last available assessment.
The Kaplan–Meier product limit method was used to describe PFS and OS curves. The log-rank test was applied to test statistical significance of differences between curves of responding and nonresponding patients. We used Cox proportional hazards models to describe the contribution of PET/CT and RECIST (or pathologic) responses to the ability of PFS and OS prediction. PET responses were singularly added to a model with RECIST (or pathologic) response alone as covariate, and individual contributions were tested by likelihood ratio tests. The R2, statistic, according to Cox-Snell and Magee, was also reported as a measure of fit of the model (13). The assumption of Hazard proportionality was checked using Schoenfeld’s residuals (14).
All the patients included in this study underwent both PET/CT and RECIST response assessment; no progression or death was observed before the RECIST assessment. Therefore, no time-dependent adjustment was needed.
RESULTS
Thirty-three patients with advanced CRC metastatic to the liver were available for this study out of 39 enrolled in the phase 2 trial. Six patients were excluded because of incomplete PET/CT data. Median age was 58 y (range, 30–71 y). Most of the patients were men (63.4%); only 6 (18.2%) were controlled diabetic.
The first PET/CT scan was always obtained before the beginning of treatment, usually in the previous week; median lag between baseline PET/CT and start of treatment was 4 d (range, 0–49 d). Most patients presented at baseline with 1–3 neoplastic lesions at PET/CT scan (liver metastases and the primary CRC in patients with synchronous presentation); only 5 patients (15.1%) had four or more lesions. Patients’ characteristics and baseline values of PET/CT parameters (highest SUVmax or TLG value and total SUVmax and TLG value) are summarized in Table 2.
Baseline Characteristics of Patients (n = 33)
The second PET/CT scan was acquired after 1 cycle of chemotherapy as planned in 31 patients and after 2 cycles in 2; median time from beginning of treatment to the second PET/CT was 16 d (range, 9–35 d). After treatment, there was a notable decrease of all the patient-based PET/CT measures with a median change of −33.9% (range, −78.3 to +54.0) for the highest SUVmax, −61.5% (range, −86.9 to +148.1) for the highest TLG, −34.9% (range, −75.3 to +54.0) for the total SUVmax, and –65.5% (−86.9 to +148.1) for the total TLG.
According to Table 1 definitions, a variable number of responders was observed for the 6 PET/CT measures, ranging from 8 to 23 (Table 3), whereas 22 patients (66.7%) were defined as responder (1 complete and 21 partial responses) after 3 mo of treatment according to the CT scan and RECIST criteria. Pathologic response was assessed in 31 patients, 16 of whom were classified as responder (complete in 5 cases and partial in 11 cases) (Table 3).
Distribution of PET/CT Response by CT/RECIST and Pathologic Response
A strong asymmetry between PET/CT and RECIST responses was observed with SUV-based measures; in discordant pairs, indeed, a significantly larger number of responses were always found with RECIST than with PET/CT criteria. Conversely, no significant differences were found for TLG-based measures. No evidence of asymmetry was found among discordant pairs of early PET/CT and pathologic response (Table 3).
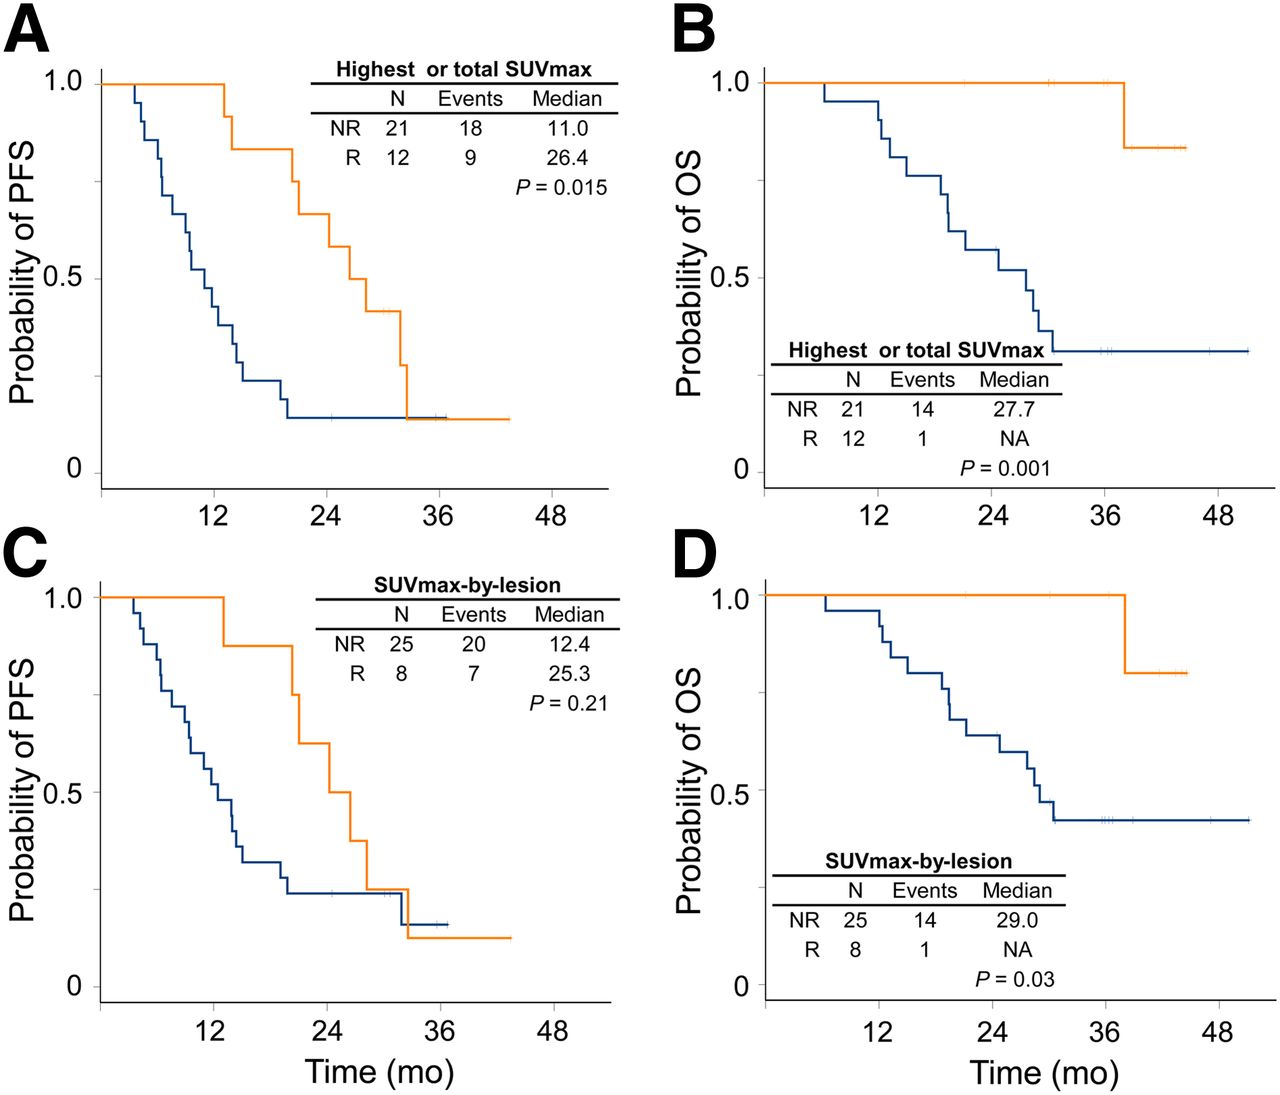
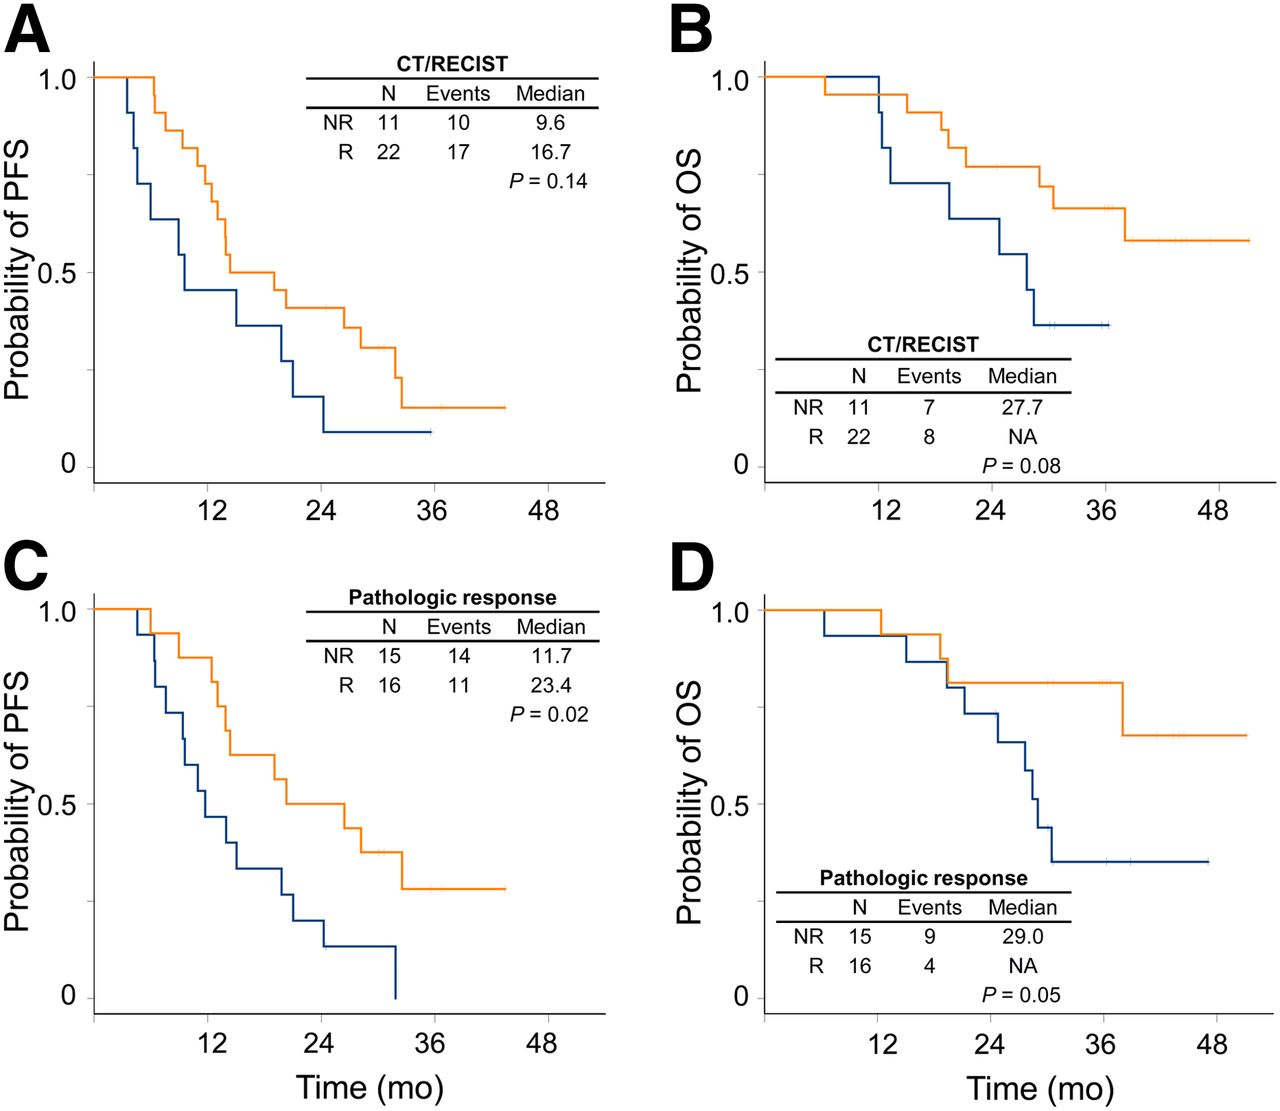
On April 30, 2012, with a median follow-up of 30 mo, 27 patients (81.8%) had progressed and 15 (45.5%) had died. Median PFS was 14.4 mo (95% confidence interval, 11.7–26.4), and median OS was 38 mo (95% confidence interval, 28.4, not reached). Patients defined as responders with SUV-based PET/CT outcome had significantly longer PFS and OS than nonresponders, except the case of PFS by SUVmax by lesion (Fig. 1); similarly, responders defined using TLG-based PET/CT outcomes had significantly longer PFS and OS than nonresponders (Fig. 2). Results did not change, excluding the 2 patients who underwent the posttreatment PET/CT scan after the second cycle of chemotherapy (data not shown). Objective response defined according to CT/RECIST did not predict PFS or OS, whereas responders defined according to pathologic assessment after surgery had longer PFS and OS than nonresponders (Fig. 3).

PFS and OS curves estimated by Kaplan–Meier method according to response assessed using highest or total SUVmax (A and B) and SUVmax by lesion (C and D). Orange lines represent responding (R) patients, and blue lines represent nonresponding (NR) ones; vertical dashes represent censoring.
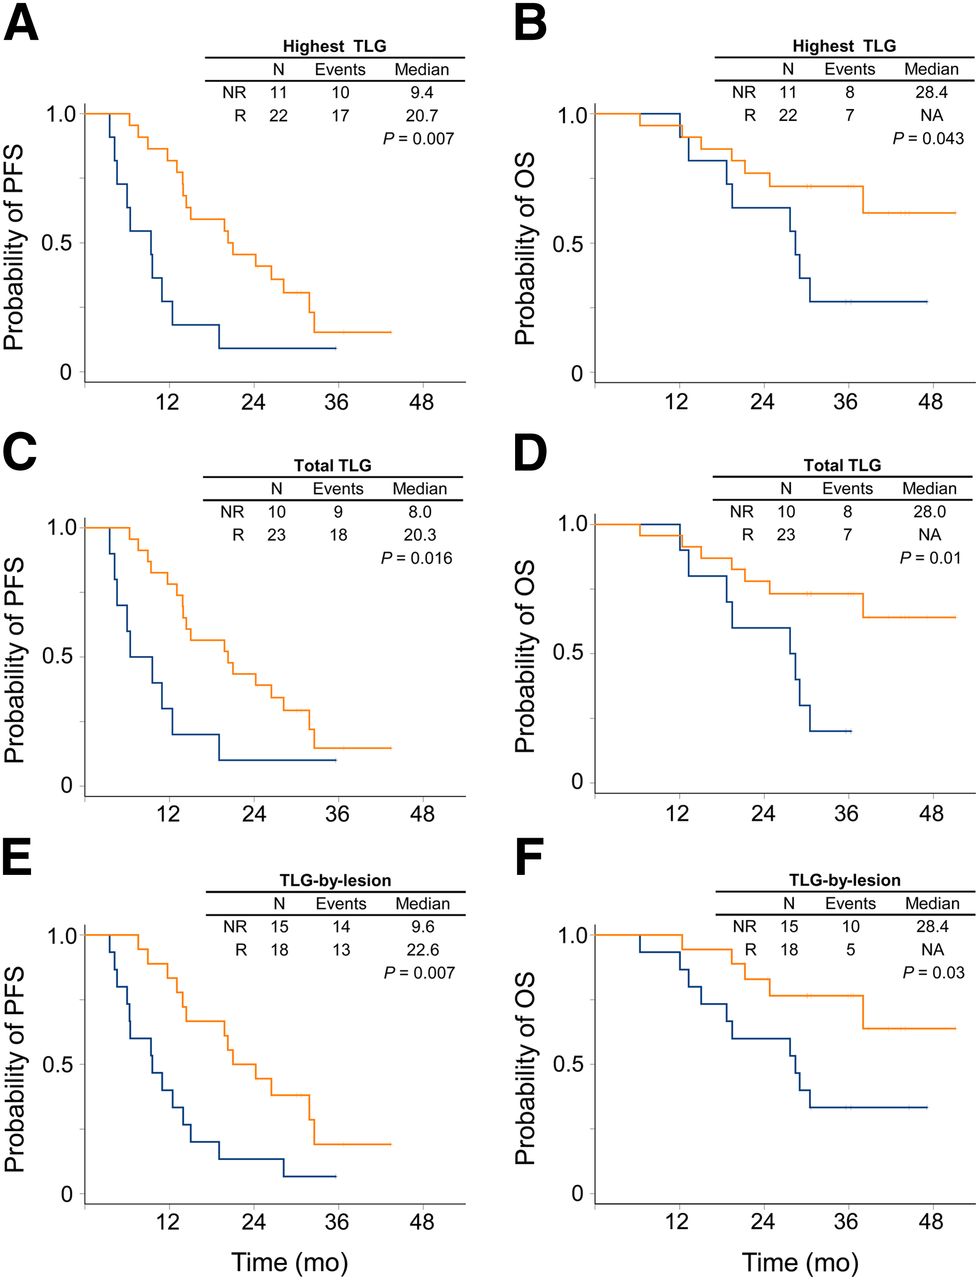
PFS and OS curves estimated by Kaplan–Meier method according to response assessed using highest TLG (A and B), total TLG (C and D), and TLG by lesion (E and F). Orange lines represent responding (R) patients, and blue lines represent nonresponding (NR) ones; vertical dashes represent censoring.

PFS and OS curves estimated by Kaplan–Meier method according to response assessed using CT/RECIST (A and B) and pathologic response (C and D). Orange lines represent responding (R) patients, and blue lines represent nonresponding (NR) ones; vertical dashes represent censoring.
The relative contribution of PET/CT and CT/RECIST responses to PFS and OS prediction is reported in Table 4: the bottom model included CT/RECIST alone whereas in the other 6 models PET/CT measures were singularly added to CT/RECIST response. The fit of the model (R2) was always increased by the addition of PET/CT information; seemingly SUV-based measures were of greater relevance in the prediction of OS. The contribution of the CT/RECIST response was moderate and consistently inferior to PET/CT response. Quite similar results were observed when the relative contribution of PET/CT and pathologic response to PFS and OS prediction was assessed (Table 5); the contribution of the pathologic response to prognosis was relevant but consistently inferior to PET/CT response.
Contribution of PET/CT and CT/RECIST Response to PFS and OS Prediction
Contribution of PET/CT and Pathologic Responses to PFS and OS Prediction
DISCUSSION
In this paper we report that in a series of 33 patients with CRC metastatic to the liver, treated with bevacizumab plus chemotherapy, PET/CT response assessed early after treatment initiation was significantly predictive of the time-to-event outcomes (PFS and OS). Such predictive ability was much stronger than that of typical response assessment with CT based on tumor size according to RECIST and stronger than that of pathologic response assessed on surgical specimens.
It would be important for clinical research and practice of oncology to identify effective surrogates for early prediction of success or failure of the ongoing treatment (15) and eventually shift patients to alternative treatments. Dimensional response is commonly used in research and practice, based on the principle that tumor shrinkage is a signal of treatment activity against cancer. After World Health Organization criteria, RECIST represents a highly refined method of response definition, with rules available for any possible case. However, its value as surrogate of long-term endpoints has been seldom validated and is largely criticized (16). On the other hand, there is no general agreement in the scientific community on the way PET/CT response could be assessed, notwithstanding guidelines of the European Organization for Research and Treatment of Cancer (EORTC) (17) and the proposal of PET Response Criteria in Solid Tumors (PERCIST) (18).
Many questions remain open: first, the identification of the most convenient parameters; second, the identification of the most effective thresholds; third, the identification of the best time for response assessment; fourth, the categorization of response in the case of disseminated disease (several organs for each patient and several lesions for each organ); and fifth, the comprehension of factors that can affect the generalizability of findings.
As for the first point, during preoperative treatment of patients with liver metastases from CRC (19–23) metabolic response based on SUVmax was predictive of PFS (or time to recurrence) and also of OS if defined by calculating the SUVmax percentage change (23), as in our study. SUVmax is an observer-independent semiquantitative index of tumor 18F-FDG uptake, based on a single pixel value that might not be representative in a highly heterogeneous tumor. SUVmax adjusted for lean body mass (SUL) has been proposed as more reliable for interindividual comparisons (18), but it does not seem necessary for intraindividual comparison done for response assessment. Interestingly, in a study of neoadjuvant chemotherapy for esophageal cancer, metabolic response—assessed evaluating SUL peak response according to PERCIST—was predictive of patients’ long-term outcomes, whereas RECIST response was not (24). However, a recent study of early PET/CT assessment in metastatic CRC patients showed that the performance of the response classification was unchanged when the SUV indices were normalized for both mass index and body weight (25).
Looking for convenient parameters, we also tested TLG, which, being the product of SUVmean × tumor volume, could better define whole tumor behavior (26). TLG performed well in studies of colorectal, lung, and renal cancer response but not in studies of sarcoma response, suggesting it might be useful in some but not all tumor types (27–30). According to our findings, SUVmax performs better than TLG in the prediction of OS.
In this study, we defined a priori a 50% reduction as the threshold for metabolic response definition. This choice was roughly based on our previous studies in rectal cancer (31,32). The present findings confirm that this simple threshold might be effective. Different thresholds have been proposed. A 15% SUV reduction was suggested by EORTC (17) and has recently shown predictive ability in patients with metastatic CRC undergoing chemotherapy (19). A 35% SUV reduction was predictive of response to preoperative chemotherapy in esophageal and gastric cancers (33,34). A 65% reduction was predictive of prognosis in lymphomas (35) and in other studies on rectal cancer (28,36). A 69% TLG reduction was predictive of long-term outcomes in rectal cancer patients treated with preoperative chemotherapy (28). A 40% TLG reduction was predictive of response to chemotherapy in patients with mesothelioma (37). Such thresholds were retrospectively determined and run the risk of overfitting (38).
Reasonably, more extreme thresholds might identify subgroups of patients with extremely good or bad prognosis; the latter might be crucial for a clinical trial (or for clinical decision) of stopping or changing treatment based on early PET/CT assessment.
The optimal time for PET/CT response assessment should be as early as possible, to allow the stopping or changing of a useless treatment. PET response assessed after 2 d of treatment with gefitinib predicted long-term outcome of patients with advanced non–small cell lung cancer (39). However, large diffuse B-cell lymphoma might require longer time for metabolic response (40). Although the research scenario is wide for treatments with oral drugs, we believe that checking PET/CT response at the end of the first cycle makes sense with most chemotherapy schemes.
Patients with multiorgan and multilesion involvement call for careful definition of methods for response calculation and no consensus exists in this field. Hendlisz et al. calculated a lesion-by-lesion response in patients with metastatic CRC undergoing chemotherapy using the cutoff proposed by EORTC (19) and defined 4 classes of dominant response; in patients with both improved and worsened lesions, dominance was defined according to which feature was more frequent, and if they were the same, tumor load was calculated.
We applied (with both SUVmax and TLG) 3 different methods for response calculation. Two methods were substantially patient-based—that is, the highest value recorded within 1 examination (whichever the lesion) or the sum of the values recorded for all the lesions. The former method, proposed within PERCIST (18), allows that response might be actually calculated comparing 2 different lesions (even in 2 different organs) at baseline and after treatment; this contrasts with a common rule of dimensional response assessment that calls for comparing the same lesion before and after treatment. The total SUVmax (or TLG), calculated as the sum of the values of all the lesions, on the contrary, implies a raw quantitative estimation of tumor burden, depending on the number of lesions. In our study, both methods produce similar classification and we cannot suggest a choice. We also explored a method based on lesion as unit to measure variation, similar to the strategy applied in World Health Organization and RECIST criteria. We did not apply limitations on the number of lesions by organ, differently from RECIST and PERCIST, because we considered that the choice of limiting to 5 lesions for each organ dimensional assessment (RECIST) was based on retrospective analyses of large databases but the application of the same rule to PERCIST was based only on analogy. However, response assessment by lesion requires intensive calculation and its performance looks slightly worse in the present study than the previous 2 methods. Last, we had no patient developing a new lesion at the posttreatment PET/CT scan, possibly because of the short interval; in principle, consistently with PERCIST, such a case should qualify response as a failure.
Generalizability of the use of PET/CT response as a surrogate depends on many potential confounding factors. The type of tumor, with varying biologic characteristics (e.g., doubling time, bottom level of glucose consumption), might affect the degree and the timing of metabolic response. The type of treatment, cytotoxic versus cytostatic drugs or directly acting on tumor cell versus acting on microenvironment, might affect metabolic response as well. Finally, patient characteristics, particularly those related to glucose metabolism, might also affect generalizability. For all these questions, we believe that further studies are needed, possibly including different types of tumor and treatment, to explore the degree of heterogeneity of PET/CT parameters and the usefulness of PET/CT response, compared with dimensional response assessment.
CONCLUSION
We strongly support that further research is done to prospectively validate the use of early PET/CT response as a surrogate of long-term outcome in patients with metastatic cancer, across multiple tumor types and medical treatments. Confirming that PET/CT response is a strong surrogate, as suggested by our data, would make it useful to accelerate clinical research and, in perspective, to optimize clinical management of cancer patients.
DISCLOSURE
The costs of publication of this article were defrayed in part by the payment of page charges. Therefore, and solely to indicate this fact, this article is hereby marked “advertisement” in accordance with 18 USC section 1734. No potential conflict of interest relevant to this article was reported.
Footnotes
Published online Oct. 17, 2013.
- © 2013 by the Society of Nuclear Medicine and Molecular Imaging, Inc.
REFERENCES
- Received for publication January 14, 2013.
- Accepted for publication July 1, 2013.


