


Abstract
There is an unmet need for predictive biomarkers of the clinical benefit of antiangiogenic drugs. The aim of the present study was to prospectively evaluate the value of 18F-FDG PET/CT performed during and after preoperative chemoradiotherapy with bevacizumab for the prediction of complete pathologic tumor regression and survival in patients with MRI-defined high-risk locally advanced rectal cancer. Methods: Sixty-one patients treated in a nonrandomized phase II study (BRANCH) with concomitant or sequential (4 d before chemoradiotherapy) administration of bevacizumab with preoperative chemoradiotherapy were included. 18F-FDG PET/CT was performed at baseline, 11 d after the beginning of chemoradiotherapy (early), and before surgery (late). Metabolic changes were compared with pathologic complete tumor regression (TRG1) versus incomplete tumor regression (TRG2–TRG5), progression-free survival, cancer-specific survival, and overall survival. Receiver-operating-characteristic curves were calculated for those 18F-FDG PET/CT parameters that significantly correlated with TRG1. Results: Early total-lesion glycolysis and its percentage change compared with baseline (ΔTLG-early) could discriminate TRG1 from TRG2–TRG5. Only receiver-operating-characteristic analysis of ΔTLG-early showed an area under the curve greater than 0.7 (0.76), with an optimal cutoff at 59.5% (80% sensitivity, 71.4% specificity), for identifying TRG1. Late metabolic assessment could not discriminate between the 2 groups. After a median follow-up of 98 mo (range, 77–132 mo), metabolic responders (ΔTLG-early ≥ 59.5%) demonstrated a significantly higher 10-y progression-free survival (89.3% vs. 63.6%, P = 0.02) and cancer-specific survival (92.9% vs. 72.6%, P = 0.04) than incomplete metabolic responders. Conclusion: Our results suggest that early metabolic response can act as a surrogate marker of the benefit of antiangiogenic therapy. The findings provide further support for the use of early 18F-FDG PET/CT evaluation to predict pathologic response and survival in the preoperative treatment of patients with locally advanced rectal cancer. ΔTLG-early showed the best accuracy in predicting tumor regression and may be particularly useful in guiding treatment-modifying decisions during preoperative chemoradiotherapy based on expected response.
Although preoperative multimodality treatment advances have remarkably improved the outcomes of patients with locally advanced rectal cancer (LARC), there is still a clear need to optimize the management of these patients (1). The evidence that LARC represents a widely heterogeneous group of tumors with different prognostic features has prompted the pursuit of different risk-adapted treatment strategies to maximize benefit and minimize toxicity (1).
Moreover, increased awareness of negative effects on quality of life consequent to the long-term morbidity of surgery (2) and the excellent outcomes associated with pathologic complete response has led to exploration of organ preservation strategies in selected patients with a good response to neoadjuvant treatment (3).
An intriguing conservative strategy that has become popular recently is the watch-and-wait approach. This strategy omits surgery when a complete clinical response is obtained after preoperative treatment and provides true organ sparing. However, concerns about the safety of this approach have been raised (2), considering that the current selection criteria rely exclusively on clinical assessment, which may be of limited accuracy after preoperative treatment (4,5). A promising role in the prediction of pathologic tumor response has been advocated for metabolic imaging with 18F-FDG PET in LARC (6). Interestingly, growing evidence has shown that this functional imaging method is able to reliably predict treatment response early, during preoperative treatment (7). Our group has recently reported that early metabolic change accurately predicts pathologic response and long-term outcome in LARC (8). The early identification of response has great clinical importance because it offers the opportunity for response-guided tailoring of preoperative treatment and subsequent surgery, allowing referral of nonresponders to alternative treatment and good responders to a conservative surgical approach.
We have recently reported the final results of a nonrandomized phase 2 study to assess the safety and efficacy of traditional concomitant versus experimental sequential (4 d before chemoradiotherapy) administration of bevacizumab and preoperative chemotherapy in patients with MRI-defined high-risk LARC (the BRANCH trial) (9). The primary endpoint, pathologic complete tumor regression (TRG1), was reached with the sequential schedule, and the final TRG1 rate was 50% (95% confidence interval [CI], 35%–65%). Because there is an unmet need for predictive biomarkers of the clinical benefit of antiangiogenic drugs, we have also explored the potential predictive role of early metabolic response.
MATERIALS AND METHODS
Patient Selection
PET imaging was performed as part of the phase II BRANCH trial (Clinicaltrials.gov number NCT01481545) evaluating preoperative chemoradiotherapy in patients with pathologically confirmed untreated MRI-defined high-risk LARC as reported previously (9). These included patients with tumors with concomitant resectable distant metastases or T4 features, any TN1–N2 tumors, and T3N0 tumors located in the lower third of the rectum or whose radial margin was no more than 5 mm from the mesorectal fascia. The study was conducted under a protocol approved by the local Ethics Committee and was in accordance with the Helsinki Declaration.
Treatment and Follow-up
Chemotherapy, given during radiotherapy (45 Gy over 5 wk), consisted of 3 biweekly cycles of infusional oxaliplatin (100 mg/m2) followed by raltitrexed (2.5 mg/m2) on day 1, levo-folinic acid (250 mg/m2) and a bolus of 5-fluorouracil (800 mg/m2) on day 2. Bevacizumab (5 mg/kg) was administered 2 wk before the start of chemoradiotherapy and on day 1 of each cycle (concomitant schedule) or 4 d before the first and second cycles of chemotherapy (sequential schedule). Two additional cycles of chemotherapy with 1 bevacizumab infusion were allowed after the end of chemoradiotherapy in patients with distant metastases. Total mesorectal excision was planned 8 wk after the last day of radiotherapy. Four months of postoperative adjuvant FOLFOX4 regimen was planned only in patients with ypN+ or a circumferential resection margin of 1 mm or less on pathology or for patients having distant metastases at baseline resected with R0/R1 status. Clinical examination, carcinoembryonic antigen serum levels, whole-body CT, and pelvic MRI were performed every 4 mo for the first 2 y of follow-up, every 6 mo for the next 3 y, and annually thereafter.
Pathologic Analysis
The surgical specimens were evaluated and scored according to Mandard et al. (10) by 2 experienced pathologists who were unaware of the PET findings. In cases of discrepancy between the 2 pathologists, the worse tumor regression score was assigned. On the basis of these findings, patients were classified as pathologic tumor complete responders (TRG1) or incomplete responders (TRG2–TRG5).
18F-FDG PET/CT Analysis
18F-FDG PET/CT imaging was performed before chemoradiotherapy (baseline), 11 d after starting chemoradiotherapy (early), and within 1 wk before surgical resection (late).
Patients who had fasted for at least 6 h and had blood glucose levels below 150 mg/dL were administered 300–400 MBq of 18F-FDG, and scanning began 60 min afterward. A DST-600 scanner (GE Healthcare) that underwent daily and periodic quality control according to European Association of Nuclear Medicine guidelines (11) was used for scanning (3-min emission per bed position). CT-based attenuation-corrected images were reconstructed with the ordered-subsets expectation maximization algorithm (2 iterations, 16 subsets). Emission data were corrected for decay, dead time, and random coincidences. Data were normalized for injected dose and patient body weight. All images were analyzed using the same software package that semiautomatically drew a 3-dimensional region of interest around the area of increased uptake. Thresholds were adjusted to encompass the area of increased uptake visually. For each tumor volume, the following parameters were calculated: SUV [measured activity concentration (Bq/mL)/(injected activity [Bq]/body weight [kg] × 1,000)], SUVmax (the maximum pixel value measured in the visualized lesion), SUVmean (the average SUVs in the regions of interest), and total-lesion glycolysis (TLG) (SUVmean × metabolic tumor volume [mm3]). Metabolic response was calculated by measuring early and late changes relative to baseline. Thus, for all indicators, a change value for early and late studies was calculated as follows [([baseline value – early or late value]/baseline value) × 100]. Correlations between these changes (early or late) and pathologic tumor responses were determined.
Statistical Analysis
The primary endpoint of the BRANCH trial was the rate of TRG1, and the sample size was established applying Simon’s 2-stage design as previously reported in detail (9). The study also included biomarker studies and among these the predictive role of early metabolic response, assessed by 18F-FDG PET/CT, as a prospective secondary endpoint. All quantitative values have been expressed as medians and ranges (minimum and maximum), as well as proportions with their 95% CIs. Receiver-operating-characteristic curves were calculated for the 18F-FDG PET/CT parameters that were found to be significantly correlated with TRG1. The area under the curve (AUC) was used to assess accuracy. Only when a test reported an AUC of more than 0.7 was the maximum product of sensitivity and specificity chosen as the best cutoff for the parameter for prediction of TRG1. To evaluate the independence of the cutoff in predicting TRG1, a multivariate analysis was performed with the most relevant clinical variables: age, sex, Eastern Cooperative Oncology Group performance status (0 vs. 1 or 2), Gunderson risk (12), distance from the anal verge (≤5 cm vs. >5 cm), distance from the mesorectal fascia (≤2 mm vs. >2 mm), and baseline carcinoembryonic antigen serum level (≤5 IU/L vs. >5 IU/L). The odds ratio and 95% CI were used to report the results. Progression-free survival (PFS) was defined as the time from initial treatment until tumor progression or relapse, death from any cause, or last follow-up. Patients who were progression-free at the closeout date had their time to progression censored to that date. Overall survival (OS) was defined as the time from initial treatment until death from any cause or until last follow-up. Cancer-specific survival (CSS) was defined as the time until cancer-related death or last follow-up. Patients who were alive at the closeout date had their OS and CSS censored to that date.
PFS, OS, and CSS rates were estimated with their 95% CIs using the Kaplan–Meier method and compared with the log-rank test. For survival analysis, in the 8 patients with distant metastases, the metabolic response of metastatic lesions according to previously described criteria (TLG reduction > 50%) (13)) was also considered when defining patients as responders and incomplete responders based on 18F-FDG PET/CT.
The Cox regression model was used to assess the role of the cutoff for 18F-FDG PET/CT parameters in predicting PFS, OS, and CSS. Hazard ratios were derived from Cox regression analysis. A univariate analysis assessed the correlation of pre- and postsurgical characteristics with PFS, OS, and CSS. Multivariate analysis was performed according to a backward elimination of factors showing a P value of less than 0.10 in the univariate analysis. In all statistical tests, a P value of less than 0.05 was considered significant. All statistical analyses were performed using SPSS software (version 22; SPSS Inc.).
RESULTS
Patient Characteristics and Pathology Results
In total, 61 consecutive patients, including 8 patients with concomitant distant resectable metastases (5 liver, 1 lung, and 2 lymph node metastases) were evaluated with 18F-FDG PET/CT. One patient refused surgery, and of the remaining patients, 25 showed a TRG1 response, whereas 35 were TRG2–TRG4. The median interval between the end of chemoradiotherapy and total mesorectal excision was 9 wk for both TRG1 (range, 7–13 wk) and TRG2–TRG4 (range, 7–15 wk). No significant differences in baseline disease characteristics were observed between TRG1 and TRG2–TRG4 (Table 1).
Patient and Tumor Characteristics
Relationship Between 18F-FDG PET/CT Parameters and Pathologic Response
The median times between the start of preoperative chemoradiotherapy and the early PET scan and between the completion of chemoradiotherapy and the late PET scan were, respectively, 11 d for both TRG1 (range, 9–21 d) and TRG2–TRG4 (range, 9–14 d) and 59 d (range, 50–89 d) for TRG1 and 58 d (range, 43–96 d) for TRG2–TRG4. Among the 18F-FDG PET/CT parameters analyzed, early change in SUVmax showed borderline predictive value for response, but significant differences between TRG1 and TRG2–TRG4 were seen only in the early PET assessment, for day 11 TLG and for ΔTLG-early (Table 2). However, the AUC for day 11 TLG was not sufficiently accurate to establish an optimal cutoff (AUC, 0.68; 95% CI, 0.53–0.82; Supplemental Fig. 1 [supplemental materials are available at http://jnm.snmjournals.org]), whereas for ΔTLG-early the AUC was 0.76 (95% CI, 0.64–0.89; P = 0.001) with an optimal cutoff of 59.5% (80% sensitivity, 71.4% specificity) in identifying TRG1 (Fig. 1). In Figures 2 and 3, 2 representative cases of metabolic response in pathologic complete and incomplete responders are shown. Among the 30 patients with a ΔTLG-early of at least 59.5%, 20 (67%) were classified as TRG1, 9 (30%) as TRG2, and 1 (3%) as TRG3, for a positive predictive value of 67% (probability of correct identification of TRG1). In contrast, among the remaining 30 patients with a ΔTLG-early of less than 59.5%, only 5 (17%) were TRG1, 13 (43%) were TRG2, and 12 (40%) were TRG3–TRG4, for a negative predictive value of 83% (probability of correct identification of TRG2–TRG4). It should be noted that 2 false-negative subjects (TRG1 with ΔTLG-early < 59.5%) received 2 additional cycles of chemotherapy after the end of chemoradiotherapy and before surgery because they had distant metastases.
18F-FDG PET/CT Parameters in Relation to TRG1 and TRG2–TRG4
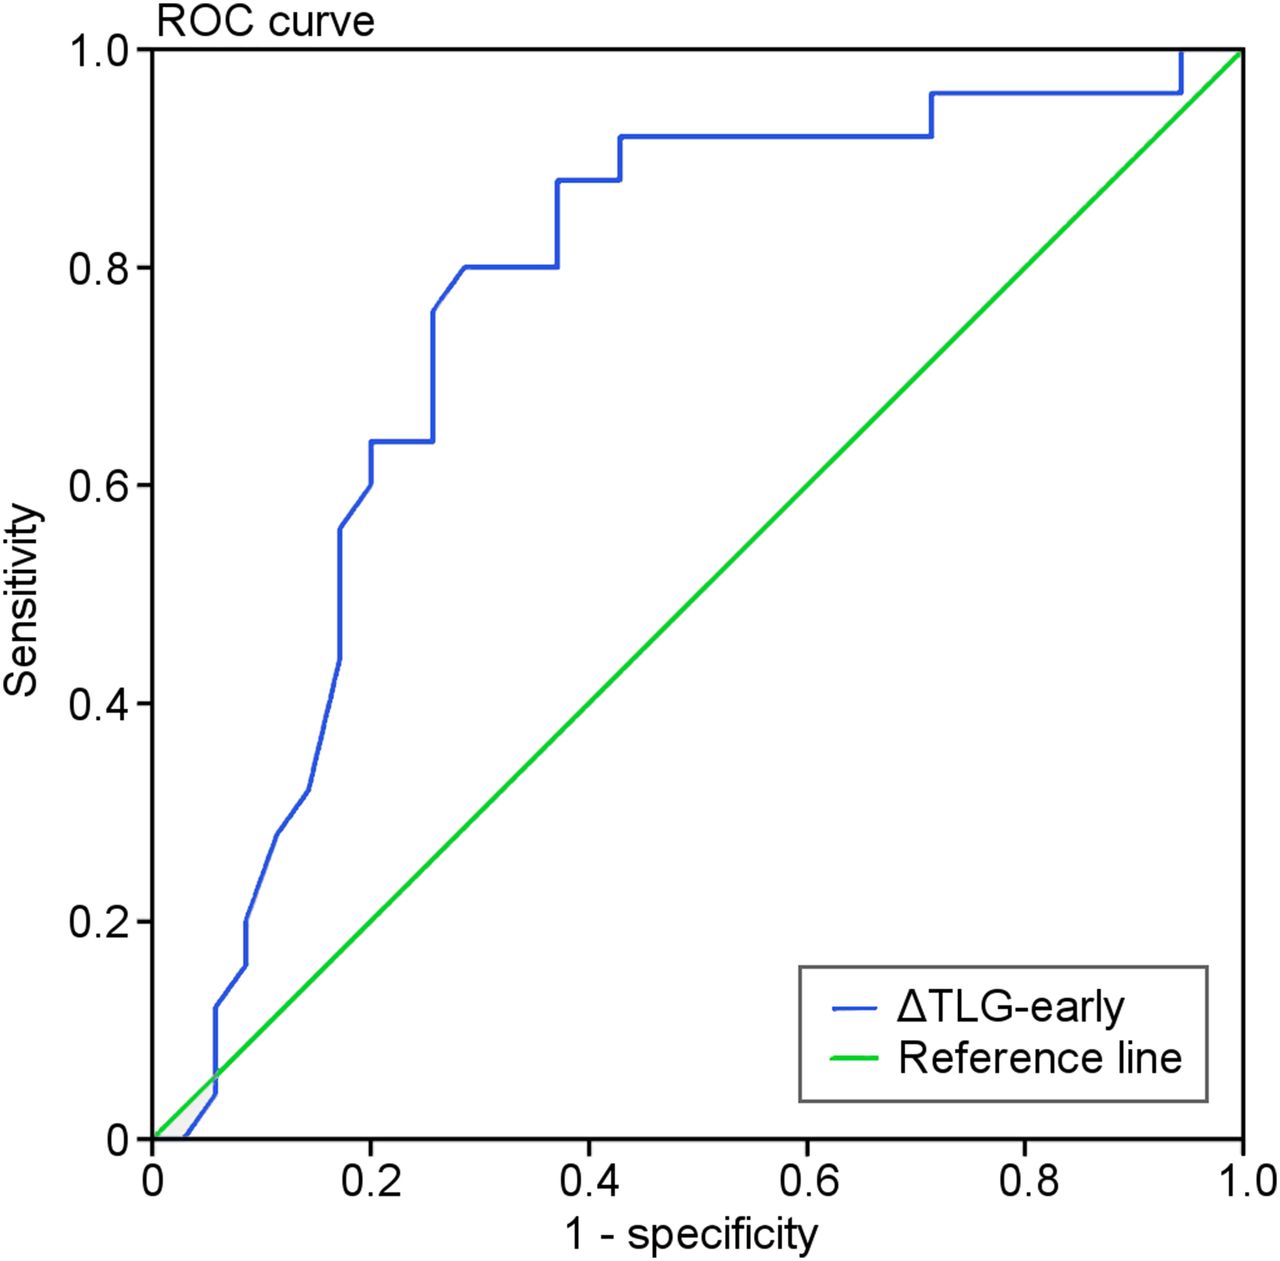
Receiver-operating-characteristic (ROC) curve for ΔTLG-early. Curve shows accuracy of using ΔTLG-early (AUC, 0.76; 95% CI, 0.64–0.89; P = 0.001) with cutoff ≥ 59.5% (80% sensitivity, 71.4% specificity) for predicting TRG1 vs. TRG2–TRG4.

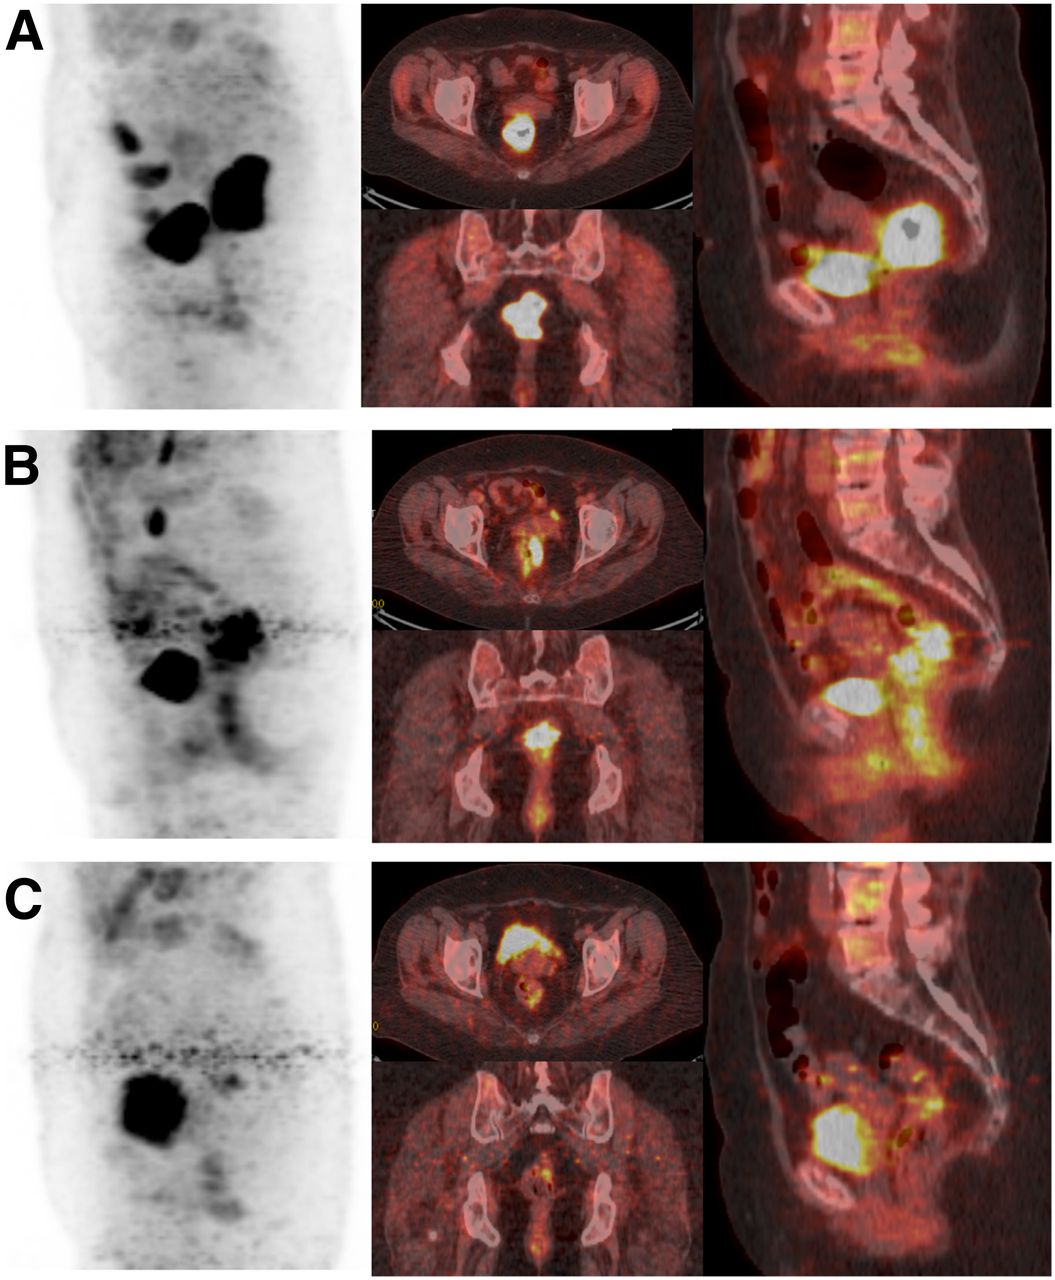
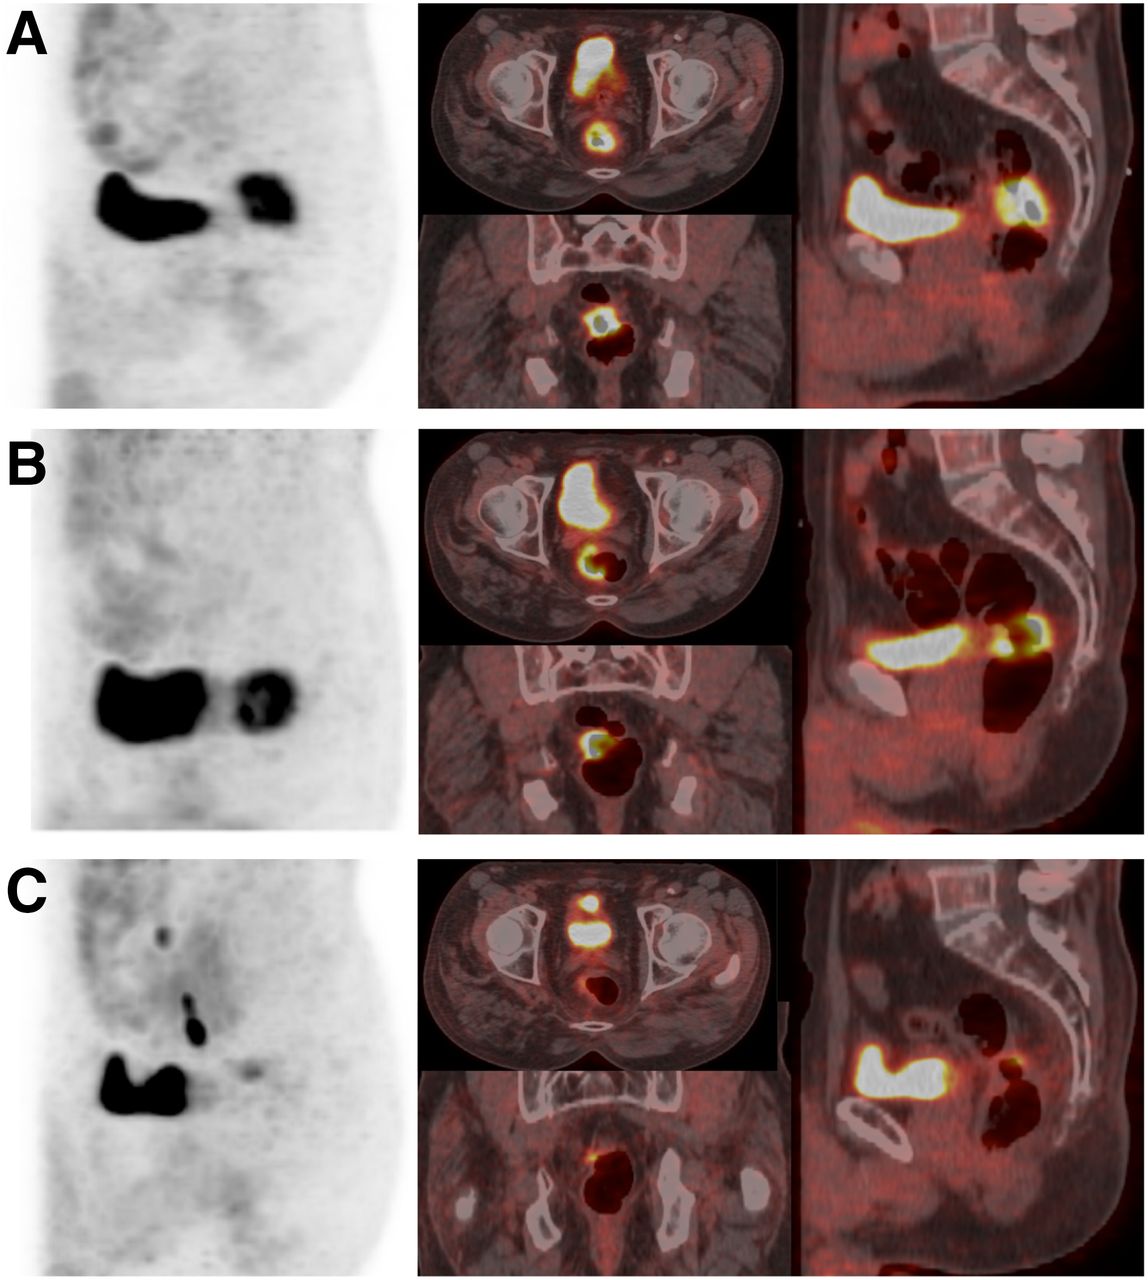
18F-FDG PET/CT images in patient with complete pathologic response. (A) Baseline 18F-FDG uptake in cT3 lesion (TLG, 470.40). (B) Early significant decrease in tumor TLG (TLG, 65.86; ΔTLG-early, 86%). (C) Late nearly complete disappearance of tumor (TLG, 14.11; ΔTLG-late, 97%). Pathologic analysis showed TRG1 (ypT0N0). Neither local nor distant recurrence occurred during 83 mo of follow-up.

18F-FDG PET/CT images in patient with incomplete pathologic response. (A) Baseline 18F-FDG uptake in cT3 lesion (TLG, 57.6). (B) Early slight decrease in tumor TLG (TLG, 48.38; ΔTLG-early, 16%). (C) Late nearly complete disappearance of tumor (TLG, 8.06; ΔTLG-late, 86%). Pathologic analysis showed incomplete pathologic response (ypT3N1, TRG3). Pelvic recurrence and death occurred after 35 and 53 mo from initial treatment, respectively.
Interestingly, the relationship between ΔTLG and tumor regression observed early was not maintained in the late evaluation (Table 2). Moreover, the pathologic primary tumor stage was ypT0–T2 in all but 1 patient (97%) with an ΔTLG-early of at least 59.5% (henceforth referred to as metabolic responders) and in 23 of 30 (77%) with an ΔTLG-early of less than 59.5% (incomplete metabolic responders). Lymph node involvement was found in 7 (23%) metabolic responders and in 11 (37%) incomplete metabolic responders.
Overall, pathologic complete responses were observed in 16 of 30 (53%) metabolic responders and in only 5 of 30 (17%) incomplete metabolic responders. Primary tumor resection was complete in all metabolic responders, whereas a positive circumferential resection margin was found in 2 incomplete metabolic responders (Supplemental Table 1).
Multivariate analysis showed a strong and independent correlation of ΔTLG-early in predicting TRG1 (Table 3).
Multivariate Analysis for Identification of TRG1
Metabolic Changes and Long-Term Outcomes
With a median follow-up of 98 mo (range, 77–132 mo), 15 patients showed cancer progression (1 local recurrence, 6 local and distant recurrence, 4 distant recurrence, and 4 progression of distant metastases), and 12 patients had died at the time of analysis. The overall estimated 10-y PFS, OS, and CSS were 75.4% (95% CI, 63.3%–84.5%), 78.7% (95% CI, 66.9%–87.1%), and 82.0% (95% CI, 70.5%–89.6%), respectively (Supplemental Fig. 2).
Survival analysis was performed to compare metabolic responders and incomplete responders. Two of the 8 patients with distant metastases at enrollment showed a discordant metabolic response between the primary tumor, which showed a marked metabolic response (ΔTLG-early, 71% and 72%), and the metastatic lesions, which did not show a significant metabolic response (TLG reduction < 50%). These patients were classified as incomplete metabolic responders. In the remaining 6 patients, the metabolic response of the primary tumor (2 responders and 4 incomplete responders) was not affected by metastatic lesions.
Only 5 (18%) of 28 metabolic responders received adjuvant chemotherapy; 3 patients (11%) experienced recurrence. In contrast, 13 of 33 (39%) incomplete metabolic responders (including the patient who refused surgery) received adjuvant chemotherapy; in 12 (36%) patients, recurrence or cancer progression was documented. Metabolic responders had a significantly longer PFS than incomplete responders (10-y PFS, 89.3%; 95% CI, 72.8%–96.3%, vs. 63.6% and 46.6%–77.8%; log-rank test, P = 0.02; Fig. 4). In the univariate analysis, only ΔTLG-early and ypTNM showed a significant association with PFS (hazard ratios, 0.26 [P = 0.02] and 0.15 [P = 0.04], respectively; Table 4). A clear trend toward reduced risk of recurrence or cancer progression was observed for the tumor regression category. At multivariate analysis, none of these factors showed prognostic significance (Table 4). In relation to OS, 3 metabolic responders (11%) and 10 incomplete metabolic responders (30%) died, and all but 2 deaths, 1 for each subgroup, were cancer-related. Metabolic responders had a longer OS, although this difference was not statistically significant (10-y OS, 89.3%; 95% CI, 72.8%–96.3%, vs. 69.3% and 52.7%–82.6%; log-rank test, P = 0.06; Supplemental Fig. 3). However, metabolic responders showed significantly longer CSS than incomplete responders (10-y CSS, 92.9%; 95% CI, 77.4%–98%, vs. 72.6% and 55.8%–84.9%; log-rank test, P = 0.04; Fig. 4). In the univariate analysis, only ΔTLG-early showed a significant association with CSS (hazard ratio, 0.23; P = 0.04; Table 4). At multivariate analysis, no factor showed prognostic significance.
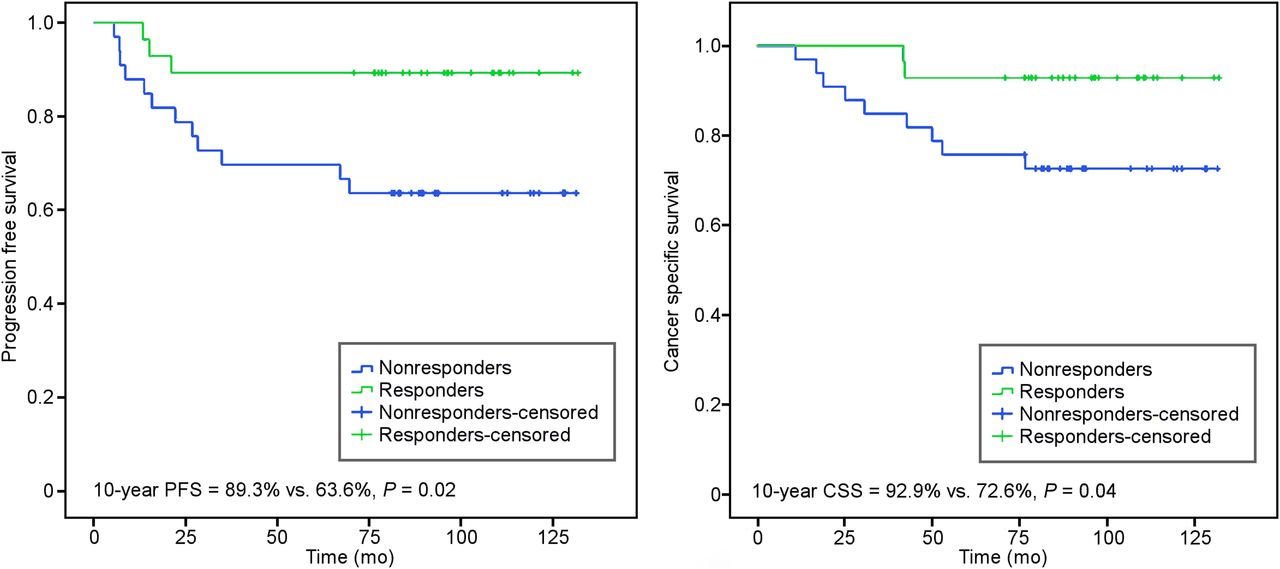
Kaplan–Meier curves for PFS (A) and CSS (B) according to metabolic response.
Univariate and Multivariate Analysis of Prognostic Factors for PFS and CSS
Metabolic Changes and Bevacizumab Scheduling
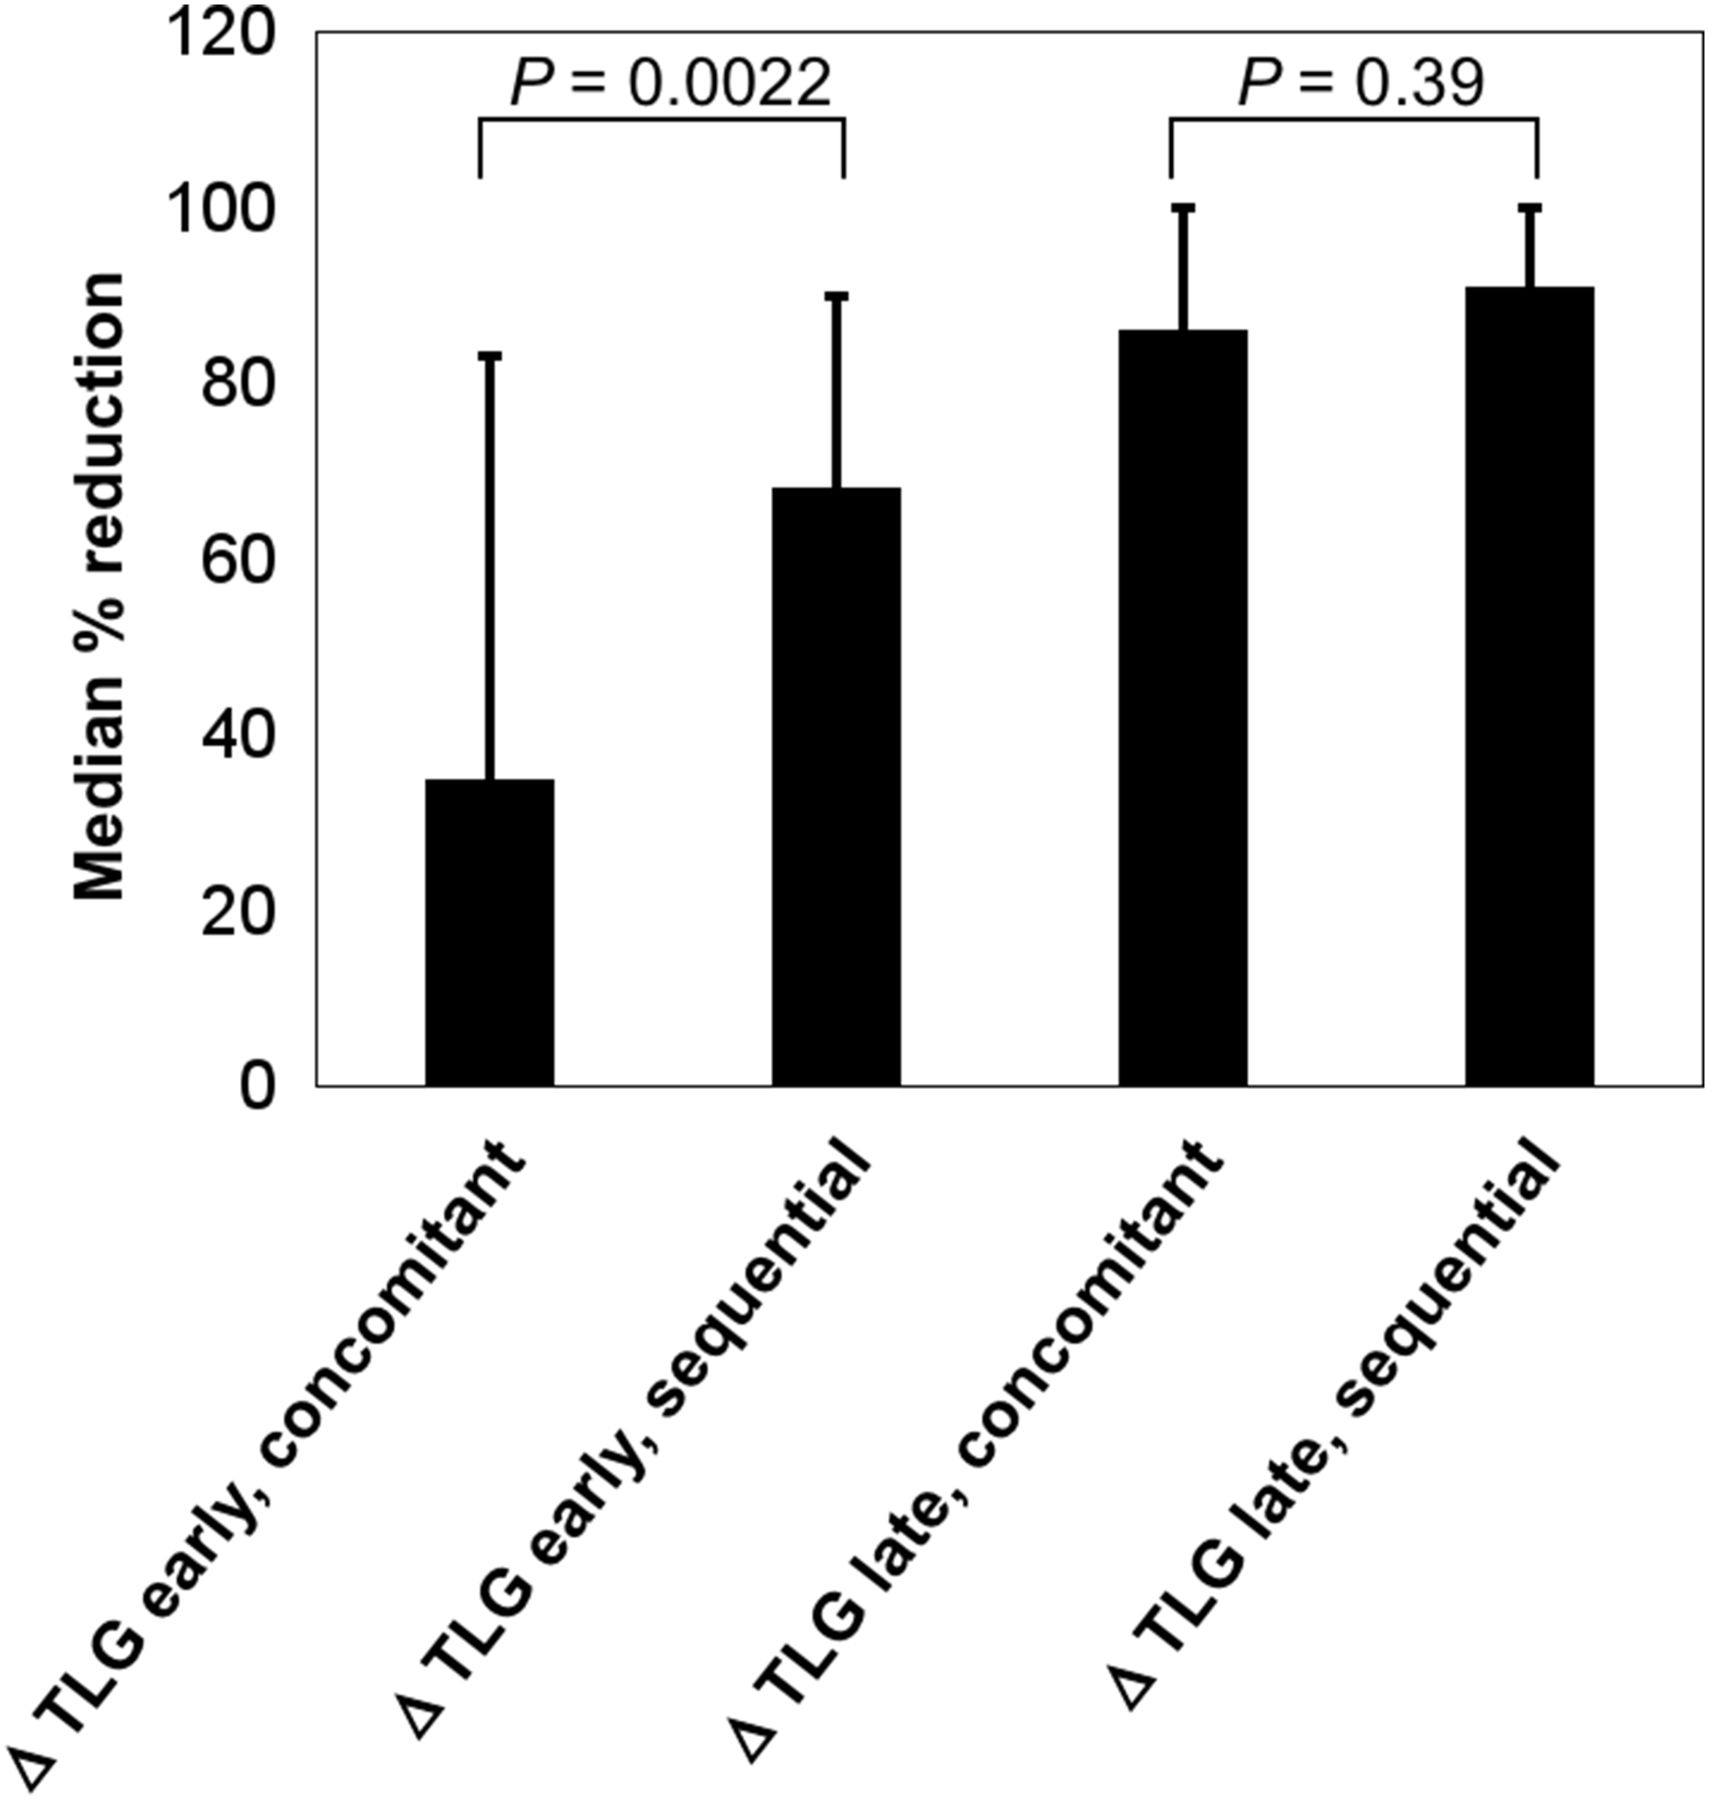
The primary endpoint of the BRANCH study was the rate of TRG1. This was reached only using the sequential schedule of bevacizumab (TRG1 rate, 50%; 95% CI, 35%–65%). In contrast, for the concomitant schedule, accrual was stopped early since the number of TRG1 (2/16 patients) was statistically inconsistent with the preplanned first-stage analysis. In line with these results, we observed a significant difference in ΔTLG-early between the 2 bevacizumab schedules (concomitant schedule, median of 35% and range of −129% to 83%, vs. sequential schedule, median of 68% and range of −31% to 90%; P = 0.0022; Fig. 5). In contrast, no differences were observed in ΔTLG-late (concomitant schedule, median of 86% and range of −24% to 100%, vs. sequential schedule, median of 91% and range of −4% to 100%; P = 0.39; Fig. 5).

Relationship between ΔTLG-early and ΔTLG-late with bevacizumab scheduling.
DISCUSSION
This prospective study corroborates our previous evidence that early metabolic change accurately predicts pathologic response and long-term outcome in LARC, showing an increased accuracy compared with late assessment (8). We found that only early metabolic response to preoperative chemoradiotherapy can discriminate LARC patients with TRG1 from those with TRG2–TRG4 response. Looking for convenient parameters, we found that only ΔTLG-early showed an accurate AUC of 0.76 at receiver-operating-characteristic analysis, with an optimal cutoff of 59.5% to distinguish TRG1 from TRG2–TRG4. Moreover, among presurgical parameters only ΔTLG-early showed a strong and independent correlation in predicting TRG1 in the multivariate analysis. In addition, the positive predictive value was 67% and the negative predictive value was 83%. It is important to once again note that 2 false-negative subjects received 2 additional cycles of chemotherapy in the waiting period because they had distant metastases, highlighting the potential value of intensifying treatment in selected nonresponding patients. Importantly, we showed that the relationship between ΔTLG and tumor regression observed early is lost in the late evaluation. Similarly, the borderline predictive value for response given by the more traditionally used SUVmax measurements is lost in the late assessment. It should be noted that in the present study we used TRG1 instead of TRG1–TRG2 as the reference for the evaluation of the predictive value of metabolic response. Most studies in this setting, as well as in our previous experience, address major pathologic response (TRG1–TRG2). We confirm the difficulty that 18F-FDG PET/CT has in distinguishing between TRG1 and TRG2 given the very low spatial resolution and the very subtle differences at the cellular level (14,15). Indeed, among the patients with a ΔTLG-early of at least 59.5%, there were 9 patients (30%) with TRG2, and overall, all but 1 patient (97%) were classified as TRG1–TRG2 and pT0–T2. In contrast, only 5 patients with TRG1 were wrongly classified as nonresponders. In this group, 2 patients had received additional chemotherapy as reported above, leading to speculation that TRG1 may have been a consequence of additional chemotherapy and that 18F-FDG PET/CT could allow clinicians to modify or intensify treatment on the basis of PET findings. However, the low positive predictive value for identifying TRG1 suggests the need to combine early 18F-FDG PET assessment with other imaging modalities at different time points, such as diffusion-weighted MRI or dynamic contrast-enhanced MRI, to improve the selection of patients for organ-preserving strategies (16,17). It is interesting to note that our data are consistent with another recent series (18) in which early reduction of SUVmax was the only parameter used to discriminate TRG1 from TRG2–TRG5, although long-term outcome was not reported. In this regard, our findings support the use of TLG as a better composite parameter accounting for tracer avidity and metabolic tumor volume for this type of assessment as observed by several authors (19,20).
A point of strength of this study is the long-term follow-up (median, 98 mo; minimum, 77 mo), which is hardly ever seen in other studies on this matter. Metabolic responders showed significantly higher 10-y PFS probability (89.3%) than incomplete responders (63.6%), with a 74% reduction in risk of recurrence. Of note, none of the other presurgical parameters showed a significant association with PFS in the univariate analysis, whereas of the postsurgical factors only ypTNM was statistically correlated to PFS. Furthermore, metabolic responders showed better 10-y OS (89.3% vs. 69.3%), although this difference was not statistically significant, as well as showing significantly improved 10-y CSS (92.9%) compared with incomplete responders (72.6%), with a 77% reduction of the risk of cancer death. Overall, these results confirm the prognostic value of early metabolic response. However, the low number of events (recurrence, cancer progression, or cancer death) limit the statistical power of the analysis for this and other prognostic factors in the multivariate analysis. The correlation between the early 18F-FDG PET changes and long-term outcomes may also be particularly helpful in selecting patients for adjuvant treatment, in light of the debate between the pros and cons of adjuvant treatment after preoperative chemotherapy in LARC (21). In this regard, early metabolic response showed a significant ability to predict outcome despite the lower percentage of patients (18% vs. 39%) who received adjuvant treatment in our series.
Finally we would like point out that, to the best of our knowledge, this is the first prospective study indicating a relevance of the use of early 18F-FDG PET in the prediction of pathologic response and outcome in LARC patients treated with a chemoradiotherapy regimen with bevacizumab. In this setting, early metabolic assessment allowed a higher rate of prediction of TRG1 in the sequential than in the standard concomitant bevacizumab administration scheme. Again, this capability was lost in the late metabolic assessment. These findings highlight the importance of assessing early functional changes compared with conventional RECIST, which is inadequate in addressing early changes. Early PET response may provide the sought-after and as yet undefined functional biomarker for response or resistance to antiangiogenic therapy (22,23).
CONCLUSION
The results of this study provide further support for the use of early PET response assessment as a clinical tool in the management of patients with LARC, showing that ΔTLG-early can be used to predict pathologic response and outcome. Our results show that early 18F-FDG PET/CT could be particularly useful for identifying early incomplete pathologic response, allowing clinicians to modify or intensify the treatment approach through radiotherapy dose escalation or additional chemotherapy in the waiting period. At the same time, early identification of patients likely to achieve complete pathologic response could complement morphologic imaging findings and allow better selection of patients for organ-preserving strategies. Interestingly, our results also indicate the potential of early 18F-FDG PET/CT as a surrogate marker of the benefit of antiangiogenic therapy. These hypothesis-generating findings warrant further evaluation in larger properly powered and possibly multicenter studies to validate this approach.
DISCLOSURE
The study was partially supported by research grants from the Italian Ministry of Health to Antonio Avallone (RF-2009-1539464) and Alfredo Budillon (RF-2011-02346914). Bevacizumab was kindly provided by Hoffmann-La Roche Italy. Antonio Avallone receives honoraria from Hoffmann-La Roche Italy, Sanofi, and Amgen for participation in conferences as a speaker and in advisory board meetings. No other potential conflict of interest relevant to this article was reported.
KEY POINTS
QUESTION: The aim of the study was to evaluate the prediction value of 18F-FDG PET/CT performed during and after preoperative chemoradiotherapy with bevacizumab in high-risk locally advanced rectal cancer (LARC) patients.
PERTINENT FINDINGS: Sixty-one patients were treated with preoperative chemoradiotherapy plus bevacizumab, and 18F-FDG PET/CT was performed at baseline, 11 days after the beginning of chemoradiotherapy (early) and before surgery (late). Only early metabolic response, change of total lesion glycolysis (ΔTLG-early), could discriminate pathologic complete versus incomplete tumor regression. Metabolic responders showed a significantly higher 10-y progression-free survival and cancer-specific survival than incomplete metabolic responders.
IMPLICATIONS FOR PATIENT CARE: These results suggest that early metabolic response can act as a surrogate marker of the benefit of antiangiogenic therapy and provide further support for the use of early 18F-FDG PET/CT evaluation to predict pathologic response and survival in the preoperative treatment of patients with LARC.
Footnotes
↵* Contributed equally to this work.
Published online Mar. 15, 2019.
- © 2019 by the Society of Nuclear Medicine and Molecular Imaging.
REFERENCES
- Received for publication October 27, 2018.
- Accepted for publication March 4, 2019.


Jump to section
Related Articles
Cited By...
- No citing articles found.