


Abstract
PET can be used to monitor response during chemotherapy and assess biologic target volumes for radiotherapy. Previous simulation studies have shown that the performance of various automatic or semiautomatic tumor delineation methods depends on image characteristics. The purpose of this study was to assess test–retest variability of tumor delineation methods, with emphasis on the effects of several image characteristics (e.g., resolution and contrast). Methods: Baseline test–retest data from 19 non–small cell lung cancer patients were obtained using 18F-FDG (n = 10) and 3′-deoxy-3′-18F-fluorothymidine (18F-FLT) (n = 9). Images were reconstructed with varying spatial resolution and contrast. Six different types of tumor delineation methods, based on various thresholds or on a gradient, were applied to all datasets. Test–retest variability of metabolic volume and standardized uptake value (SUV) was determined. Results: For both tracers, size of metabolic volume and test–retest variability of both metabolic volume and SUV were affected by the image characteristics and tumor delineation method used. The median volume test–retest variability ranged from 8.3% to 23% and from 7.4% to 29% for 18F-FDG and 18F-FLT, respectively. For all image characteristics studied, larger differences (≤10-fold higher) were seen in test–retest variability of metabolic volume than in SUV. Conclusion: Test–retest variability of both metabolic volume and SUV varied with tumor delineation method, radiotracer, and image characteristics. The results indicate that a careful optimization of imaging and delineation method parameters is needed when metabolic volume is used, for example, as a response assessment parameter.
PET is a functional imaging modality that provides information about the metabolism, physiology, or molecular biology of tumor tissue. There is growing evidence that PET can be used to monitor response during chemotherapy and to assess biologic target volumes for radiotherapy (1–4). For response monitoring studies, it is important to know whether a difference between tumor volumes in successive scans represents a true response or methodology-related variability. In addition, for radiation treatment planning, accurate definition of tumor volume is important for focusing the dose to the tumor and sparing surrounding normal tissue. Various PET tracers have been developed to visualize and quantify the biologic characteristics of tumors, that is, metabolism, proliferation, hypoxia, and apoptosis. The most widely used PET tracer, 18F-FDG, is increasingly applied to define gross tumor volume in radiotherapy. Evidence is accumulating that 18F-FDG could improve the accuracy with which tumor boundaries are defined (2–4). 18F-FDG uptake reflects glucose metabolism, and tumors can be identified on the basis of their increased rate of glycolysis. However, increased glucose metabolism is not specific to tumors, and increased 18F-FDG uptake is also seen in, for example, inflammatory tissue (5).
Proliferation of tumor cells is directly related to DNA synthesis, which can be measured using radiolabeled thymidine or thymidine derivatives. The 18F-labeled thymidine analog 3′-deoxy-3′-18F-fluorothymidine (18F-FLT) has shown a high correlation with thymidine kinase-1 and tissue markers of proliferation, that is, proliferating cell nuclear antigen (Ki-67), in pulmonary nodules (6). Moreover, 18F-FLT showed high sensitivity and specificity, comparable with 18F-FDG (7). Therefore, 18F-FLT is increasingly being used as a specific tracer for noninvasive assessment of tumor cell proliferation.
In this paper, we will use the term metabolic volume to indicate tumor volumes that are derived directly from PET. This term may be justified, as 18F-FLT and 18F-FDG are trapped in tissue by metabolic (kinase) activity. However, for volume assessments with other tracers, that is, those that measure perfusion or bind to receptors, the term functional volume may be more appropriate.
Various techniques for determining the boundaries of the gross tumor volume based on PET images have been reported (2–4,8,9), ranging from visual interpretation to automatic or semiautomatic methods. In the simplest case (visual), tumor boundaries are outlined manually by a nuclear medicine physician, radiologist, or radiation oncologist. Manual outlining may lead to a large variation in gross tumor volume delineation, as boundary definition depends on both the experience of the physician and the contouring protocol used (10). Automatic or semiautomatic delineation methods, methods that automatically delineate a tumor after user input, have been proposed to reduce this variability. So far, to our knowledge, only 2 studies have reported the test–retest variability of metabolic volumes (11,12). However, in the study of Frings et al. (11), metabolic volume test–retest variability was evaluated for a few percentage threshold–based automated tumor delineation methods, and in both studies metabolic volume test–retest variability was assessed using constant imaging parameters only. There are, however, many factors that could affect the accuracy of PET-based automatic or semiautomatic delineation methods, that is, image resolution, reconstruction settings, image noise, and tumor characteristics (2,3,13). Assessing the effects of these different image characteristics on metabolic volume test–retest variability is of the utmost importance to understand the need to optimize image quality (14). Moreover, there are several types of PET-based automated tumor delineation methods for which test–retest performance may or may not be sensitive to the image characteristics.
The aim of this study was to further evaluate both the test–retest variability and differences in metabolic volumes derived from PET studies using various types of automatic or semiautomatic delineation methods, with emphasis on the effects of image characteristics (i.e., resolution and contrast) and for 2 different tracers.
MATERIALS AND METHODS
Patients and Radiotracers
Retrospective data from patients with stage IIIB or IV non–small cell lung cancer for 2 radioactive PET tracers were used. All patients gave written informed consent, and both studies were approved by the Medical Ethics Review Committee of the VU University Medical Center.
Ten patients (3 women and 7 men; mean age ± SD, 51 ± 5 y; range, 45–63 y; mean weight, 76 ± 10 kg; range, 56–94 kg) were included in a dynamic baseline 18F-FDG study. Blood glucose levels were obtained for each patient and were within the reference range (mean, 5.5 ± 0.6 mmol·L−1; range, 4.4–7.0 mmol·L−1). All patients fasted for at least 6 h before scanning. In all patients, 2 dynamic 18F-FDG studies were acquired on consecutive days.
Nine patients (2 women and 7 men; mean age, 66 ± 11 y; range, 45–78 y; mean weight, 72 ± 8 kg; range. 61–87 kg) were included in a dynamic baseline 18F-FLT study. All patients were scanned twice within an interval of 1 wk.
PET Protocol
Patients were prepared in accordance with recently published guidelines for quantitative PET studies (14,15). All patients were scanned in the supine position and received an intravenous catheter for tracer administration. All scans, performed using an ECAT EXACT HR+ scanner (Siemens/CTI) (16), started with a 10-min transmission scan. Afterward, a tracer bolus was administrated intravenously (18F-FDG: 388 ± 71 MBq; 18F-FLT: 350 ± 47 MBq) while dynamic emission scanning began in 2-dimensional acquisition mode. Each dynamic scan consisted of 40 frames with the following lengths: 1 × 30, 6 × 5, 6 × 10, 3 × 20, 5 × 30, 5 × 60, 8 × 150, and 6 × 300 s.
Both the last 3 frames (45–60 min after injection) and the last 6 frames (30–60 min after injection) were summed to obtain various image contrasts, and the resulting sinograms were reconstructed using normalization and attenuation-weighted ordered-subsets expectation maximization with 2 iterations and 16 subsets, followed by postsmoothing using a Hanning filter at 0.5 of the Nyquist frequency (17). An image matrix size of 256 × 256 × 63 was used, corresponding to a pixel size of 2.57 × 2.57 × 2.43 mm. Additional smoothing was applied to the images using various gaussian kernels, thereby reducing both image resolution and noise. The kernels used resulted in final spatial resolutions of 6.5, 8.3, and 10.2 mm in full width at half maximum (FWHM). Using each combination of image contrast and noise (i.e., sum of last 3 or 6 frames), spatial resolution (i.e., 6.5, 8.3, and 10.2 mm FWHM) and tracer (i.e., 18F-FDG and 18F-FLT), test–retest variability of both metabolic volume and corresponding standardized uptake value (SUV) was determined for all automatic or semiautomatic tumor delineation methods.
Data Analysis
Test–retest variability of both observed metabolic volumes and volumetric average SUVs was assessed for the following 6 different types of automatic or semiautomatic tumor delineation methods:
Fixed threshold of 50% and 70% of maximum voxel value within tumor (VOI50, VOI70). This method applies a threshold based on the percentage of the maximum voxel intensity within the tumor (8). Next, this threshold is used to delineate the tumor.
Adaptive threshold range of 41%–70% of maximum voxel value within tumor (VOIA41, VOIA50, VOIA70). This method is similar to the fixed threshold method, except that it adapts the threshold relative to the local average background, thereby correcting for the contrast between tumor and local background (8).
Contrast-oriented method (VOISchaefer). This method uses a correction by measuring the mean of 70% maximal SUV and background activity for various sphere sizes. Regression coefficients are calculated, which represent the relationship between optimal threshold and image contrast for various sphere sizes (3). This threshold equation is given by:
Background-subtracted relative-threshold level (RTL) method (VOIRTL). This method is an iterative method based on a convolution of the point-spread function that takes into account the differences between various sphere sizes and the scanner resolution (4).
Gradient-based watershed segmentation method (GradWT). This method uses 2 steps before calculating the volume of interest. First, this method calculates a gradient image on which a seed is placed in the tumor and another in the background. Next, a watershed algorithm is used to grow the seeds in the gradient basins, thereby creating boundaries on the gradient edges. In our presentation, the watershed continues to grow the gradient basins until all voxels are classified as either tumor or nontumour (background). The voxel is assigned to tumor if 2 watersheds are competing for the same voxel.
Absolute SUV (SUV2.5). Normalized (SUV) voxel intensities at a chosen absolute threshold are used to delineate tumor. An SUV of 2.5 was used, as it might properly differentiate between benign and malignant lesions (9).
For all delineation methods, the maximum voxel value was obtained by applying a cross-shaped pattern that could be less sensitive to noise. This method searches for the region with the (local) average maximum intensity, based on the average of 7 neighboring voxels, which was then used as maximum or peak value.
The volume measured by VOIA41 using both sum of last 3 frames and 6.5 mm FWHM was used as the defined reference standard. The volumes obtained by all tumor delineation methods using various image characteristics were compared with this defined reference standard. To assess accuracy, the mean ratio (of all methods compared with the reference dataset) and precision, that is, SD, for each tumor delineation method were calculated across all studies for a given tracer. Percentage test–retest variability was defined as
A 2-tailed paired Wilcoxon signed-rank test was used to indicate a statistically significant difference between volume, SUV, and test–retest variability of volume and SUV obtained from images with various image characteristics and those obtained from the defined reference standard. P values of less than 0.05 were considered significantly different, and P values of between 0.1 and 0.05 were considered to indicate a trend.
RESULTS
Precision of Tumor Delineation Methods
Table 1 shows the number of outliers and detectable lesions for all tumor delineation methods in both test and retest studies. For 18F-FDG, identification of several lesions was independent of contrast and resolution. Most methods did not show a large difference (>3) in the number of outliers when image characteristics were varied, except for VOI50, VOIA41, both variants of VOISchaefer, and SUV2.5, which showed up to a 23% increase of the number of identified outliers. Similarly, trends were observed for 18F-FLT. For this tracer, however, the number of lesions that could be detected depended moderately on image resolution.
Number of Outliers When Determining Tumor Volume for All Scans (Test and Retest) for Different Image Characteristics and Radiotracers
Accuracy of Tumor Delineation Methods
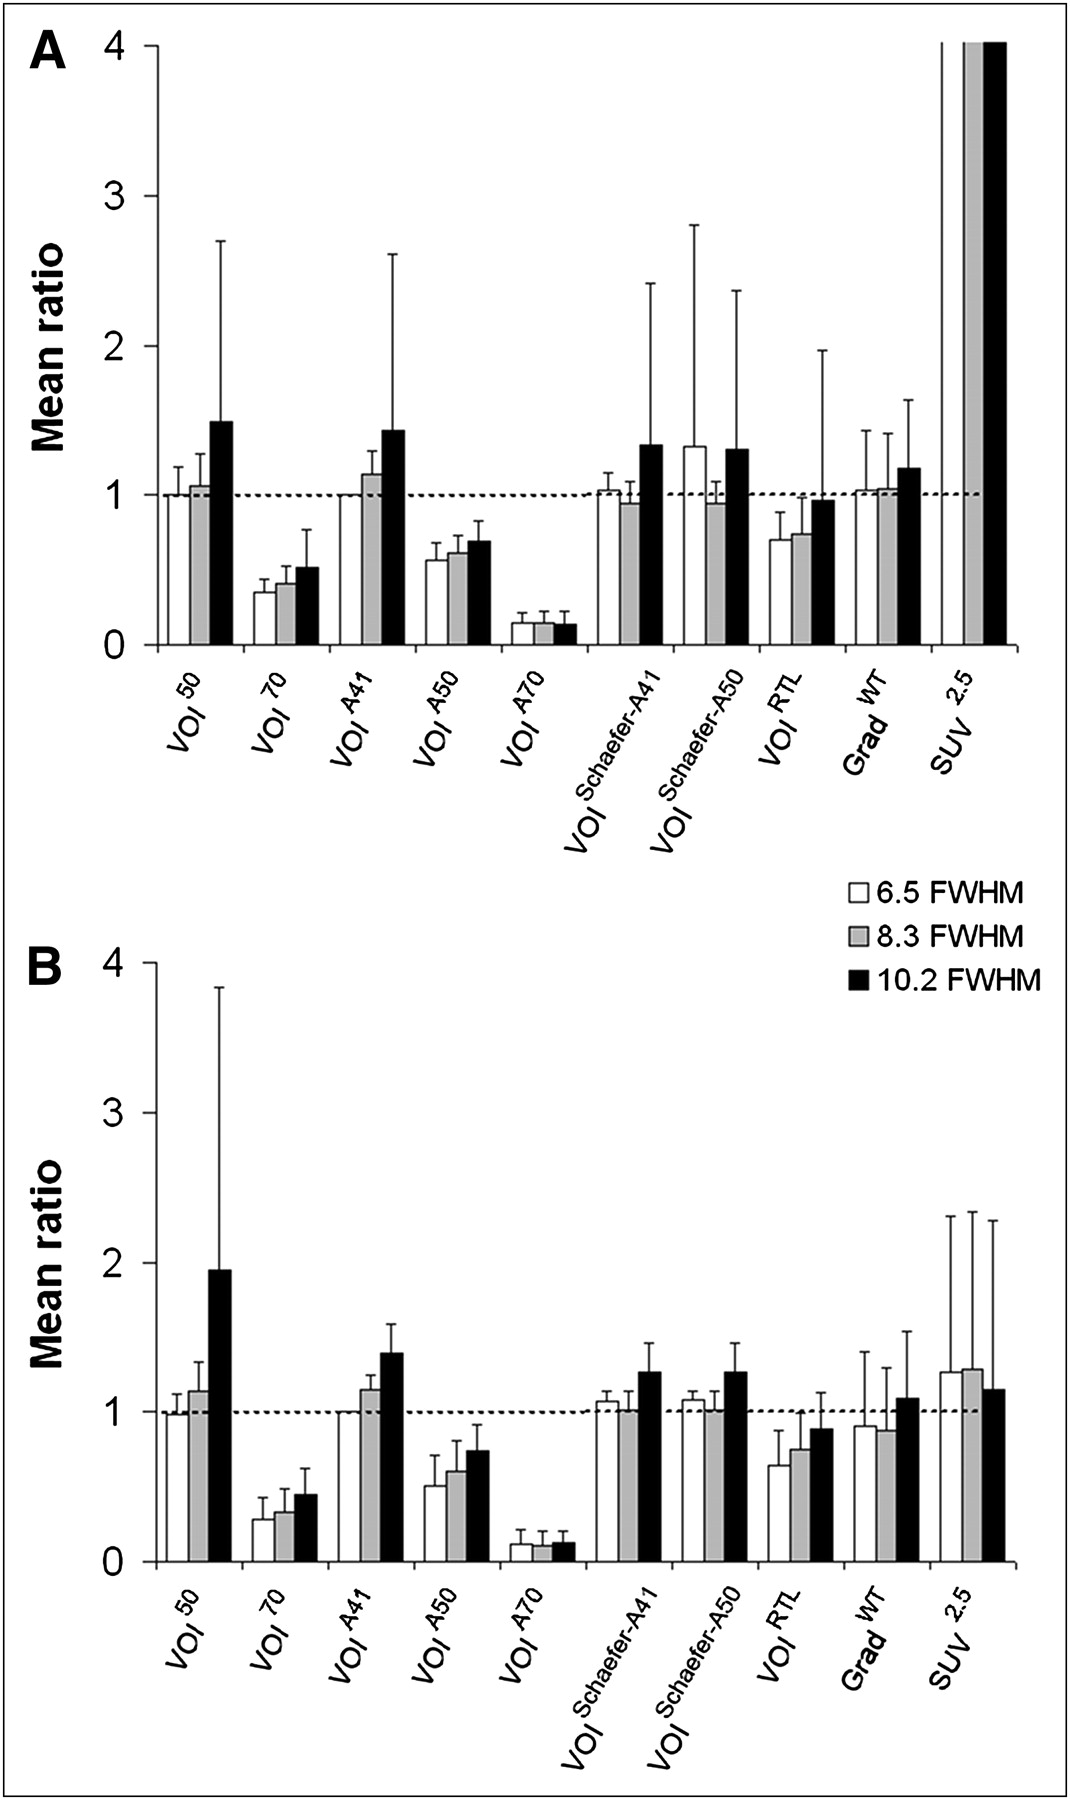
Figure 1 shows the effects of spatial resolution on the change in metabolic volume for various tumor delineation methods and for both 18F-FDG and 18F-FLT. In general, there was variability (≤94%) in measured tumor volume when image resolution was changed. For almost all methods, except for VOIA70 and SUV2.5, the mean ratio obtained with low resolution (10.2 mm FWHM) was higher than that obtained with high resolution (6.5 mm FWHM). Compared with VOIA41 at 6.5 mm FWHM data, VOI50, VOISchaefer-A41, and GradWT provided similar volumes at high resolution. However, only GradWT provided volumes independent of resolution. In contrast, VOI70, VOIA50, and VOIA70 gave lower volumes (>26%). Similar trends were observed between the 2 tracers. However, for 18F-FLT, only a moderate overestimation of metabolic volume (>15%) was observed for SUV2.5, compared with the reference value (Fig. 1B).

Mean ratio of tumor volume obtained with various tumor delineation methods against defined reference standard (sum of last 3 frames and 6.5 mm FWHM) as function of image resolution for 18F-FDG (A) and 18F-FLT (B). All bars cut off at 4 (indicated by absence of SD bars) were higher than 20. Error bars represent SD.
Figure 2 shows the effects of image contrast on the change in metabolic volume for various tumor delineation methods and for both 18F-FDG and 18F-FLT. In general, the trends observed were similar to those when image resolution was changed; that is, results for lower contrast (6 frames or 30–60 min after injection) corresponded to those for lower resolution (10.2 mm FWHM).

Mean ratio of tumor volume obtained with various tumor delineation methods against defined reference standard (sum of last 3 frames and 6.5 mm FWHM) as function of image contrasts for 18F-FDG (A) and 18F-FLT (B). All bars cut off at 4 (indicated by absence of SD bars) were higher than 20. Error bars represent SD.
Test–Retest Variability of VOI Size
Slope and R2 (intercept set to 0) between measured tumor volumes of test and retest studies obtained using different tumor delineation methods and tracers are shown in Table 2 for the defined reference standard. VOIA41, VOIA50, both variants of VOISchaefer, VOIRTL, and SUV2.5 showed good correlation between test and retest scans (R2 > 0.90, slopes between 0.76 and 1.06) for both tracers. For 18F-FDG, VOISchaefer-A41 showed the best correlation (R2, 1.00; slope, 1.01). Good correlation with respect to volume size (i.e., R2 > 0.79, slopes between 0.71 and 1.11) was found for all tumor delineation methods, except for GradWT, which showed a correlation of only 0.58. However, 5 lesions were clear outliers for this method. These outliers were found in cases of heterogeneous lesions or a low tumor-to-background ratio. After these outliers were removed, a good correlation (R2, 0.86; slope, 0.94) was observed for this method as well. A similar result was observed in the case of 18F-FLT, for which the correlation for GradWT improved from 0.41 to 0.70 when 3 outliers were excluded. In addition, VOI70 showed 2 outliers that provided a much smaller volume in the test scan than in the retest scan. After these outliers were removed, the correlation improved from 0.52 (slope, 1.52) to 0.81 (slope, 1.21). In all cases, these outliers were found for tumors with very heterogeneous uptake or lesions that were close to high-uptake structures. For 18F-FLT, VOIA50 and VOIRTL showed the best correlation (R2 > 0.90; slope, ∼1.05).
Slope (with Intercept Fixed to 0) and Coefficient of Determination Between Tumor Volume Size Measured for Test and Retest Studies
Figure 3 shows the test–retest variability of metabolic volume as a function of image resolution for high image contrast or noise (45–60 min after injection). Overall, volume test–retest variability depended mainly on image resolution for all tumor delineation methods and for both tracers. Median test–retest variability of tumor volume ranged from 8.3% to 23% and from 7.4% to 29% for 18F-FDG and 18F-FLT, respectively. For 18F-FDG (Fig. 3A), fixed, adaptive percentage threshold, both variants of VOISchaefer and VOIRTL methods showed deteriorating median test–retest variability (≤11% difference) for lower resolution. Both variants of VOISchaefer showed good performance, having a low median volume test–retest value (<13%) and a low number of changes in median test–retest values (<3.7% difference) when resolutions were varied. In addition, VOIA41 and VOIA50 showed relatively low median volume test–retest values (14% and 17%, respectively) and a low number of changes in median test–retest values (<6.0% and 1.4% difference, respectively) when resolutions were varied. Interestingly, for 18F-FLT (Fig. 3B), most methods showed an opposite trend in median test–retest variability when resolution was changed, with better performance at lower resolution. VOI70 and SUV2.5 were relatively independent of changes in resolution (<0.5% difference), having a low median test–retest variability (<15%). All other delineation methods gave a moderate variation in test–retest variability (<9.5% difference) and reasonable median test–retest values (<29%) when resolutions were changed.
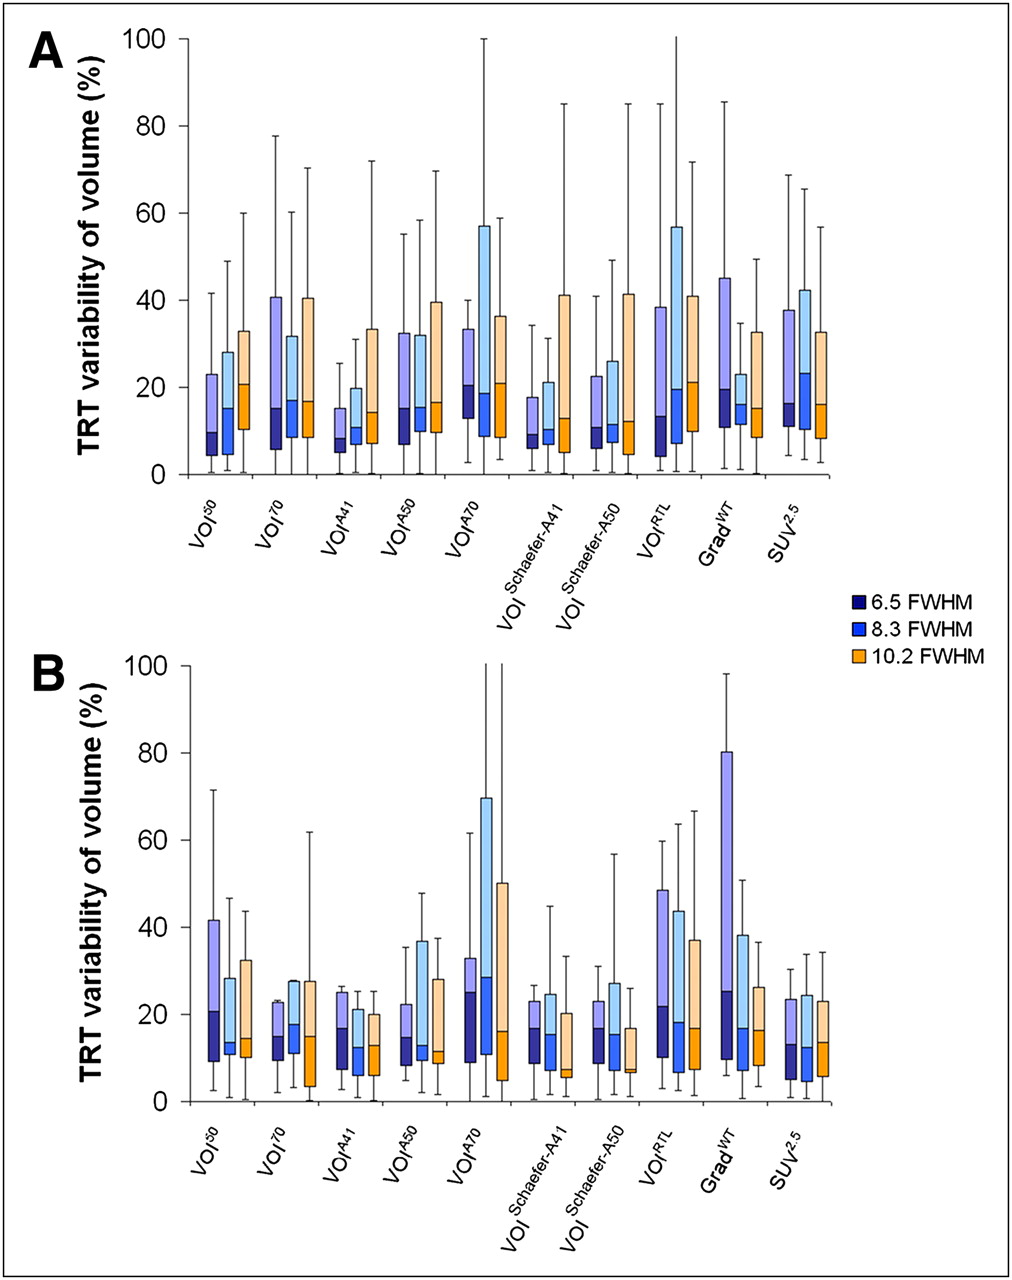
Box-and-whisker plots of percentage test–retest (TRT)variability in tumor volume obtained using various tumor delineation methods at high image contrast and varying image resolutions for 18F-FDG (A) and 18F-FLT (B). Median is horizontal line between lower (first) and upper (third) quartiles. Upper whisker represents upper quartile to maximum value, corrected for outliers (not exceeding 1.5 times interquartile range).
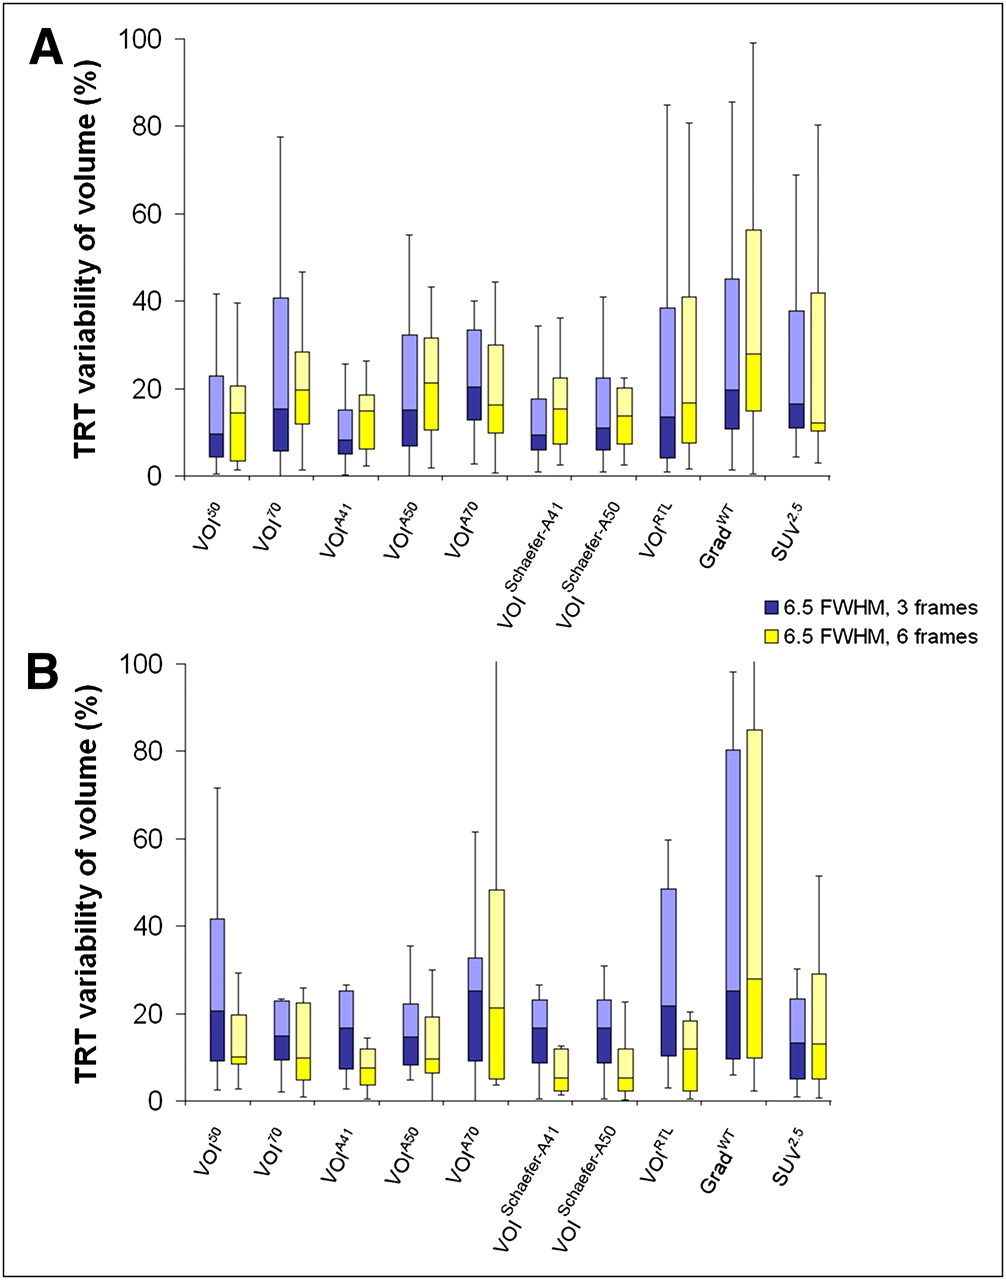
Figure 4 illustrates the effects of image contrast on volume test–retest variability for a fixed resolution of 6.5 mm FWHM. Figure 4A shows that, for 18F-FDG, most methods were nearly independent of a change in contrast (<6.7% difference), except for GradWT (>8.3% difference). In contrast, for 18F-FLT (Fig. 4B), reducing the contrast showed—likely because of an improvement in noise levels by summing over more frames—an improvement in median test–retest variability for all methods (<12% lower difference), except for GradWT (2.6% higher difference). SUV2.5 was the method that showed the lowest dependence on contrast (<1% difference).

Box-and-whisker plots of percentage test–retest (TRT) variability of tumor volume obtained by various tumor delineation methods when using different image contrasts for 18F-FDG (A) and 18F-FLT (B). Median is horizontal line between lower (first) and upper (third) quartiles. Upper whisker represents upper quartile to maximum value, corrected for outliers (not exceeding 1.5 times interquartile range).
Test–Retest Variability of SUV
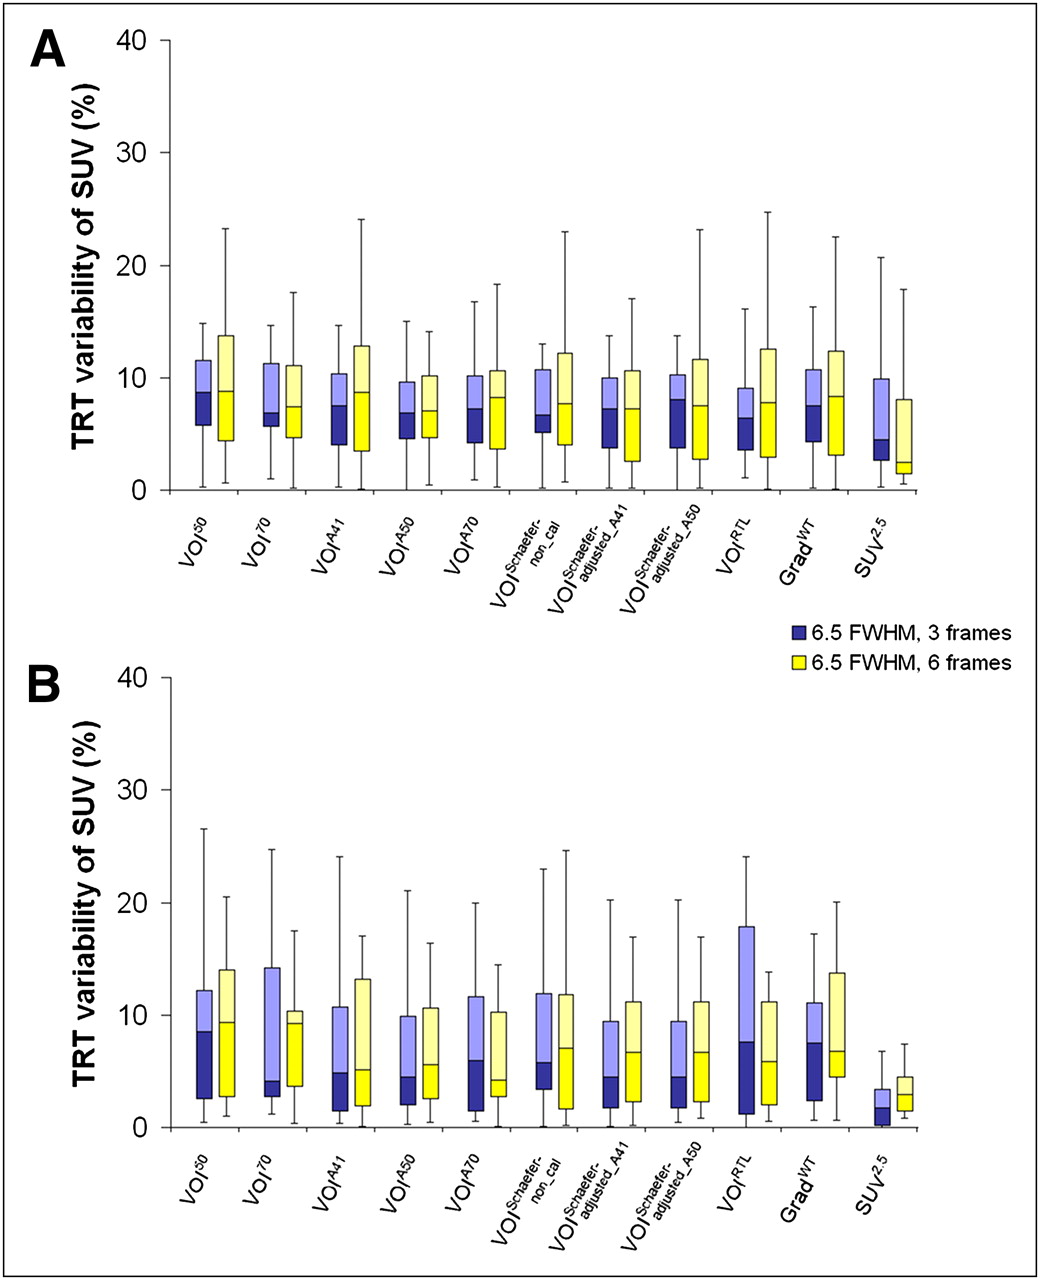
Figure 5 illustrates the test–retest variability of SUV at high image contrast and for various image resolutions. Overall, changes in test–retest variability of SUV were much lower than those seen for VOI size (median test–retest variability of SUV ranged from 4.5% to 11% and from 1.8% to 8.5% for 18F-FDG and 18F-FLT, respectively). For all tumor delineation methods and both tracers, the effect of image resolution on test–retest variability of SUV was small (<4% difference). Figure 6 illustrates the effects of image contrast on test–retest variability of SUV for a fixed resolution of 6.5 mm FWHM. Trends were similar to those seen for changes in image resolution.

Box plots of percentage test–retest (TRT) variability of SUV obtained by various tumor delineation methods at high image contrast when image resolutions were varied for 18F-FDG (A) and 18F-FLT (B). Median is horizontal line between lower (first) and upper (third) quartiles. Upper whisker represents upper quartile to maximum value, corrected for outliers (not exceeding 1.5 times interquartile range). Note that scale differs from Figure 3.

Box plots of percentage test–retest (TRT) variability of SUV obtained by various tumor delineation methods when different image contrasts were used for 18F-FDG (A) and 18F-FLT (B). Median is horizontal line between lower (first) and upper (third) quartiles. Upper whisker represents upper quartile to maximum value, corrected for outliers (not exceeding 1.5 times interquartile range). Note that scale differs from Figure 4.
Statistics
Supplemental Tables 1 and 2 (mean ± SD provided in Supplemental Tables 3 and 4) indicate that for most tumor delineation methods a change in resolution has a more significant impact on SUV and volume than their corresponding test–retest variability (supplemental materials are available online only at http://jnm.snmjournals.org). The same trend was observed for a change in contrast, except for volumes obtained on 18F-FLT images, where for most tumor delineation methods a change in contrast has a more significant impact on volume test–retest variability than on volume itself.
DISCUSSION
The aim of this study was to further investigate metabolic volume test–retest variability beyond those findings published recently (11,12), not only by including various types of tumor delineation methods for 2 different tracers but also by studying the impact of image characteristics.
In theory, estimating metabolic tumor volume accuracy and reproducibility is important for a curative outcome of radiation treatment planning. Tumor delineation methods may show metabolic tumor volumes that are too small for radiation treatment planning purposes, leading to local recurrences. For response monitoring, however, consistent underestimations of metabolic tumor volumes are less important, as only relative changes in tumor volume during therapy may be relevant. In general, all tumor delineation methods showed much larger variations in measured metabolic tumor volume (<29%) than in SUV (<11%), when image characteristics and radiotracers were varied. This finding corresponds with the results of a previous report (8) showing that, in response studies, there was only a small dependency of SUV ratios on VOI definition and image parameters. Therefore, this discussion will focus on metabolic volumes.
In our study, volumes determined by different tumor delineation methods were affected by imaging parameters (resolution and noise or contrast) and tracers being used (Fig. 1–6). This finding is in line with a previous study (14), showing that measured tumor volumes were affected by several factors, that is, image reconstruction settings, smoothing filters, and measured maximal SUV within a lesion. Moreover, the performance of several automatic or semiautomatic tumor delineation methods as a function of PET image characteristics agreed with results obtained from simulation and phantom studies (18).
Differences in tumor volumes generated with different methods have been reported previously (2–4). Substantially different results could be obtained in comparison with other image modalities or pathologic data. Few clinical studies have shown the potential of threshold-based methods for different tracers (11,12,19). Two articles (11,12) showed that different metabolic tumor volume test–retest repeatabilities were obtained when different tumor delineation methods were used. Moreover, similarly to this study, they showed that volume test–retest variability obtained from 18F-FLT was larger than that from 18F-FDG. To date, however, no gold standard exists for accurately defining tumor volumes on various image modalities, with the possible exception of pathologic findings.
A previous study (19) reported excellent reproducibility, with an intraclass correlation coefficient of 0.98 and an SD of 7% for quantitative 18F-FLT measurements with high image contrast, a resolution of about 7 mm FWHM, VOIA41. In addition, this study showed that there was no significant correlation between absolute 18F-FLT uptake and lesion size in either lung or head-and-neck cancers, indicating that this threshold-based delineation method was reliable for defining tumor boundaries of all lesion sizes. For this reason, in our study, VOIA41 was used to compare measured volumes obtained by all other tumor delineation methods. However, our study shows that VOIA41 seemed to be sensitive to a change in image characteristics for both tracers. For 18F-FLT, a high SD was observed when we summed over more frames, caused by 1 primary lesion with heterogeneous uptake. Furthermore, a relatively high number of outliers (≤20%) was found for both tracers when different image characteristics were used (Table 1). Therefore, VOIA41 seems to be reliable only for high image resolution and lesions with high contrast to background.
Two versions of VOISchaefer were investigated in this study. The performances between the 2 versions were similar (Fig. 2). However, for 18F-FDG at high resolution, a high SD of VOISchaefer-A50 was observed, caused by 1 lesion with heterogeneous uptake that was near the spine. Therefore, the version in which diameter is obtained using VOIA41 is preferred in this dataset.
For radiation treatment planning, VOI50, VOIA41, both versions of VOISchaefer, and GradWT provided, for both tracers, volumes that were relatively independent of image contrast. However, VOI50, VOIA41, and both variants of VOISchaefer showed poorer performance at low image resolution (Fig. 1). As GradWT was relatively independent of image characteristics and showed a low number of outliers when image characteristics were varied (<4%), GradWT seems to be a good possible candidate for radiation treatment planning. However, validation of the various tumor delineation methods against a gold standard, for example, pathology-determined tumor sizes, is still warranted.
Test–retest variability is important for assessing differences between successive scans beyond methodology-related variability. Clearly, for monitoring response, test–retest variability needs to be as low as possible. Large differences in test–retest variability of tumor volume estimates (≤94%) were obtained for different tumor delineation methods when different tracers or image characteristics were used, especially in cases of low image resolution. For both tracers, GradWT showed small test–retest variability (<17%) when image resolution was varied but resulted in larger test–retest variability when contrast was varied. One limitation of GradWT is that delineation of the tumor boundaries by the gradient algorithm depends on the tumor-to-background ratio, that is, contrast, showing better performance for higher image contrast. For both tracers, VOI70 and SUV2.5 gave low changes in test–retest variability (<5.3% difference) when image characteristics were varied. Measured volumes obtained by VOI70, however, were too small to cover the whole lesion. SUV2.5 showed large overestimations of volume. In addition, SUV2.5 generated a large number of outliers for different contrasts, especially for 18F-FDG (Table 1). In general, VOIA50 and VOIRTL showed reasonable test–retest variability and a small number of outliers for both 18F-FDG and 18F-FLT (Fig. 3–6). In general, VOIA50 showed a slightly smaller coefficient of variation (calculated as mean divided by SD) (<21%) than did VOIRTL (>27%) when resolution was changed. Therefore, as also reported previously (11), VOIA50 seems to be a good possible candidate for response monitoring purposes.
For all image characteristics investigated, there was poor agreement between median test–retest variability of tumor volume and SUV (R2 < 0.3, data not shown). In addition, there were large differences in median test–retest variability between the 2 parameters for all image characteristics; that is, median differences between test–retest variability of tumor volume and SUV were approximately 2.3-fold (range, 1.1–4.5) and 3.7-fold (range, 1.0–11) for 18F-FDG and 18F-FLT, respectively. The implication is that tumor volume and its test–retest variability are more sensitive to changes in image characteristics than are SUV and its test–retest variability, as also confirmed by the statistical post hoc analysis.
For most methods, higher values of median SUV test–retest variability were obtained for lower contrast, with the exception of both variants of VOISchaefer and SUV2.5 for 18F-FDG (Fig. 6A) and VOIA70, VOIRTL, and GradWT for 18F-FLT (Fig. 6B). The likely explanation for this poorer percentage reproducibility is the lower average SUV caused by summing over more frames. When imaging parameters are varied, larger differences in SUV test–retest variability were seen for 18F-FLT than for 18F-FDG, probably because of the lower SUV for 18F-FLT. Previously, in a comparative study, it was shown that mean maximal SUV in all lesions was lower for 18F-FLT than for 18F-FDG (20).
There were several limitations in determining the test–retest variability of metabolic tumor volume and SUV using the various methods. Although 2 different types of tracers were used in this study, both tracers have the same kind of kinetic model. Therefore, the impact of various image characteristics on tracers with other kinetic behaviors should be further investigated. In addition, because this was a clinical study, the exact lesion volumes clearly were not known. This issue needs to be addressed in future studies by comparing VOI measurements with independent measurements based on other (anatomic) image modalities or pathologic specimens. Furthermore, visual inspection of outliers may have affected the performance evaluations to some extent. However, these visual inspections were required, as unrealistically large tumor segmentations might occur during segmentation because of noise, surroundings, or uptake heterogeneity. Finally, the sum of the last 3 frames not only shows higher contrast but also more noise. However, data were summed over 30 or 15 min, providing images with good statistical quality. In this way, we attempted to reduce the effect of a difference in noise between the 2 datasets.
CONCLUSION
For all automatic or semiautomatic tumor delineation methods tested, derived metabolic tumor volumes themselves and test–retest variability of both metabolic tumor volume and SUV depended on image characteristics. Differences in test–retest variability of SUV were much smaller than those of tumor volume. These findings underline the need for a careful optimization of both the tumor delineation method used and the imaging parameters to obtain accurate and reproducible delineations of tumors or metabolic volume assessments.
DISCLOSURE STATEMENT
The costs of publication of this article were defrayed in part by the payment of page charges. Therefore, and solely to indicate this fact, this article is hereby marked “advertisement” in accordance with 18 USC section 1734.
Acknowledgments
This study was performed within the framework of CTMM, the Center for Translational Molecular Medicine, AIRFORCE project (grant 03O-103) and a scholarship from the National Science and Technology Development Agency of the Royal Thai Government. No other potential conflict of interest relevant to this article was reported.
Footnotes
Published online Aug. 17, 2011.
- © 2011 by Society of Nuclear Medicine
REFERENCES
- Received for publication February 3, 2011.
- Accepted for publication May 31, 2011.


