


Abstract
PET/CT with the glucose analog 18F-FDG has several potential applications for monitoring tumor response to therapy in patients with non–small cell lung cancer (NSCLC). A prerequisite for many of these applications is detailed knowledge of the repeatability of quantitative parameters derived from 18F-FDG PET/CT studies. Methods: The repeatability of the 18F-FDG signal was evaluated in 2 prospective multicenter trials. Patients with advanced NSCLC (tumor stage III–IV) underwent two 18F-FDG PET/CT studies while not receiving therapy. Tumor 18F-FDG uptake was quantified by measurement of the maximum standardized uptake value within a lesion (SUVmax) and the average SUV within a small volume of interest around the site of maximum uptake (SUVpeak). Analysis was performed for the lesion in the chest with the highest 18F-FDG uptake and a size of at least 2 cm (target lesion) as well as for up to 6 additional lesions per patient. Repeatability was assessed by Bland–Altman plots and calculation of 95% repeatability coefficients (RCs) of the log-transformed SUV differences. Results: Test–retest repeatability was assessed in 74 patients (34 from the ACRIN 6678 trial and 40 from the Merck MK-0646-008 trial). SUVpeak was 11.57 ± 7.89 g/mL for the ACRIN trial and 6.89 ± 3.02 for the Merck trial. The lower and upper RCs were −28% (95% confidence interval [CI], −35% to −23%) and +39% (95% CI, 31% to 54%) in the ACRIN trial, indicating that a decrease of SUVpeak by more than 28% or an increase by more than 39% has a probability of less than 2.5%. The corresponding RCs from the Merck trial were −35% (95% CI, −42% to −29%) and +53% (95% CI, 41% to 72%). Repeatability was similar for SUVmax of the target lesion, averaged SUVmax, and averaged SUVpeak of up to 6 lesions per patient. Conclusion: The variability of repeated measurements of tumor 18F-FDG uptake in patients with NSCLC is somewhat larger than previously reported in smaller single-center studies but comparable to that of gastrointestinal malignancies in a previous multicenter trial. The variability of measurements supports the definitions of tumor response according to PET Response Criteria in Solid Tumors.
Lung cancer continues to be the leading cause of cancer deaths in the United States: more patients die of lung cancer than of breast cancer, prostate cancer, colorectal cancer, and lymphoma combined (1). Most patients present with advanced disease and undergo palliative chemotherapy. However, only about one third of patients respond to chemotherapy (2). Novel targeted therapies directed at the epidermal growth factor receptor do have higher tumor response rates but only in small subgroups of patients with activating mutations of the epidermal growth factor receptor kinase domain (3).
PET with the glucose analog 18F-FDG has shown encouraging results for monitoring tumor response to treatment (4). Quantitative changes in tumor 18F-FDG uptake a few weeks after the start of therapy have been shown to correlate well with subsequent tumor shrinkage and patient survival (4). Thus, 18F-FDG PET has the potential to improve patient management by signaling the need for early therapeutic changes in nonresponders, thereby avoiding the side effects and costs of ineffective treatment. Analogously, early response biomarkers such as 18F-FDG PET could also accelerate oncologic drug development by decreasing the length of time on trial per subject and reducing the number of subjects required to demonstrate a statistically significant difference between the arms of a randomized phase II trial (5).
Clinical use of 18F-FDG PET as a biomarker for tumor response to therapy requires a high degree of test–retest reproducibility (repeatability). Six single-center studies have evaluated the test–retest repeatability of quantitative parameters derived from 18F-FDG PET (6–12). The coefficient of variation for changes in tumor 18F-FDG uptake was about 10%–15% when patients were scanned twice within 2–3 wk. A larger variability was reported when the baseline and follow-up scans were obtained on different scanners (13).
Velasquez et al. have reported the results of a multicenter trial evaluating the repeatability of 18F-FDG PET in patients with metastatic cancers of the gastrointestinal tract (14). A dual-center study has also evaluated the repeatability of various quantitative indices derived from 18F-FDG PET studies in patients with ovarian cancer (11). However, similar data from multicenter studies are still needed for non–small cell lung cancer (NSCLC). Therefore, repeatability of tumor 18F-FDG uptake was assessed as part of a prospective multicenter trial (ACRIN 6678, NCT00424138) conducted by the American College of Radiology Imaging Network (ACRIN, now part of the Eastern Cooperative Oncology Group [ECOG]-ACRIN Cancer Research Group). In the present analysis, the data from ACRIN 6678 were analyzed together with unpublished data from a clinical trial performed by Merck & Co Inc. (MK-0646-008, NCT00729742) that addressed the same question in a similar patient population. A prespecified objective of both trials was to correlate changes in tumor 18F-FDG uptake during chemotherapy with patient survival. In the Merck trial, characterizing the repeatability of measurement was the primary objective, whereas in the ACRIN trial, this was a secondary objective. Data on the correlation between tumor response to therapy on PET and patient outcomes will be reported separately.
MATERIALS AND METHODS
The Merck and ACRIN trials both included patients aged 18 y or older with locally advanced or metastatic stage III or IV NCSLC (15). Other inclusion criteria included a performance status of 0–2 on the ECOG scale and the presence of measurable disease on CT according to the Response Evaluation Criteria in Solid Tumors 1.0 (16). For the ACRIN trial, this was either the primary tumor or a metastatic lesion in the chest. Exclusion criteria included previous chemotherapy within 2 wk of study entry, radiotherapy or surgery of the chest within 3 mo before entering the study, pregnancy, breastfeeding, and poorly controlled diabetes mellitus. The ACRIN trial additionally excluded patients with postobstructive pneumonia and patients with pure bronchioloalveolar carcinoma. The institutional review board of each participating site approved the study, and all subjects signed a written informed consent form.
PET/CT Imaging
To participate in the ACRIN trial, sites had to meet all of the criteria described in the ACRIN PET Qualifying Application (www.acrin.org/6678_protocol.aspx). Qualification included tests for correct PET/CT scanner calibration as well as submission of test images to ACRIN. The test images were reviewed by staff of the ACRIN imaging core laboratory for quality control and compliance. Merck used a similar process of site training and qualification that required phantom scans to be submitted to an imaging contract research organization before first-subject enrollment. PET/CT images were acquired in accordance with guidelines of the National Cancer Institute (17). The imaging procedure is described in the Supplemental Methods section (supplemental materials are available at http://jnm.snmjournals.org).
Image Analysis
Activity concentrations in the attenuation-corrected PET images were converted to standardized uptake values (SUVs) normalized to patient body weight. For analysis of test–retest repeatability, the intrathoracic lesion with a diameter of more than 2 cm on CT that showed the highest 18F-FDG uptake on the baseline scan was studied (target lesion). A user-defined volume of interest (VOI) was placed around this lesion, and the maximum SUV of target lesion (SUVmax) within this volume was determined. If the SUVmax was less than 4.0 g/mL, the patient was excluded from analysis. This threshold value was based on previous studies that indicated that the repeatability of SUVs (expressed as relative changes from baseline) deteriorates with decreasing tumor 18F-FDG uptake (12,18).
A cylindric VOI 1.5 cm in diameter and 3 slices in height was centered on the voxel with maximum 18F-FDG uptake using an automated program (written in MIMVista; MIM Software) (19). The SUVmax (representing the single voxel with the highest activity concentration) and average SUV (SUVpeak) within this VOI were determined for further analysis. VOIs were placed in the same way in up to 6 additional lesions. In participants with more than 6 metastatic lesions, a maximum of 3 lesions were analyzed in the same organ. In each organ, the lesions with the highest 18F-FDG uptake were selected for analysis. No minimum SUV or minimum size was required for those additional lesions.
For quality control purposes, a large circular region of interest (ROI) (diameter, ≥5 cm) was placed in normal liver tissue. The average SUV in liver (SUVmean) in this ROI was recorded. When it was not feasible to place 1 large ROI in normal liver tissue because of multiple metastases, several small ROIs, comprising approximately the same number of pixels as one 5-cm ROI, were placed in normal liver tissue. 18F-FDG uptake within these ROIs was then averaged for further analysis.
The ACRIN 6678 and the Merck images were analyzed in the ACRIN Imaging Core Laboratory by 1 of 3 nuclear medicine physicians with at least 5 y of experience in assessing PET/CT scans. Both PET/CT studies of individual patients were always analyzed by the same observer.
Statistical Analysis
The data from the 2 studies were first analyzed separately. An analysis of the pooled data was also performed. For each analysis, variability was assessed by calculating the difference of paired SUVmax and SUVpeak measurements at the time of the 2 PET/CT studies: Eq. 1where ui1 and ui2 are the SUV measurements for a lesion at the time of the baseline and the follow-up scan, respectively. The parameter D was plotted against various parameters with potential influence on the repeatability of the SUV measurements. Then quantile–quantile plots were generated to determine whether the distribution of D deviated from a normal distribution. As this was found to be the case, further analyses were performed on the differences of log-transformed SUV measurements:
 Eq. 2Because
 Eq. 3analysis of differences of log-transformed data provides information on the repeatability of relative changes in SUVs.
To quantify the test–retest repeatability of SUV measurements, repeatability coefficients (RCs) and their 95% confidence intervals (CIs) were calculated (20). This calculation was performed on the log-transformed data using the formula Eq. 4with sd being the SD of d. Assuming a normal distribution of d, the probability that measurements of d are larger than +RCln or smaller than −RCln is about 5%. To express the repeatability coefficient as a percentage change of SUVs, RCln was exponentiated using the following formula:
 Eq. 5RC is the repeatability coefficient for the percentage change of SUVs.
The 95% CI of RC was calculated using the χ2 distribution as previously described (14). The repeatability of SUVmax and SUVpeak was also displayed graphically by Bland–Altman plots of SUV differences on the original and the log scale.
These analyses were performed for SUVmax and SUVpeak. In addition, SUVmax and SUVpeak of all measured lesions in an individual patient were averaged, and the repeatability of these parameters (aSUVpeak, aSUVmax) was determined in the same way as for the target lesion.
Quantitative parameters are presented as mean ± SD and 95% CIs of the mean, as indicated. The correlation between SUVpeak and SUVmax was evaluated by Spearman correlation coefficients. Systematic changes in quantitative parameters between the first and second PET scans were analyzed by the Wilcoxon signed-ranked test. Statistical analyses were generated using SAS/STAT software (version 9.3; SAS Institute Inc.).
RESULTS
Ninety-six patients were accrued at 17 sites (Supplemental Table 3) for the ACRIN 6678 trial. Of these, 45 (recruited at 10 sites) consented to participate in the evaluation of test–retest repeatability; evaluable data are available for 34 of these patients (Supplemental Fig. 1).
Merck provided data from 47 patients who were accrued at 14 centers in Europe and Asia from February 2009 to May 2010. Evaluable data are available for 40 of these patients (Supplemental Fig. 2). Table 1 summarizes the body weight, uptake time, blood glucose level, and injected activity for the ACRIN and Merck studies.
Physiologic and Imaging Parameters for Patients in ACRIN and Merck Trials
To evaluate changes in the whole-body distribution of 18F-FDG between the 2 PET/CT studies, 18F-FDG uptake in the liver was analyzed. As shown in Table 2, liver 18F-FDG uptake remained stable at the time of the 2 PET/CT scans, with low interpatient variability in both the Merck and the ACRIN trials (Table 2).
Summary of PET Quantitative Measures
SUVpeak and SUVmax parameters for the target lesion showed no systematic increase or decrease from the first to the second PET/CT scan. Overall, SUVpeak and SUVmax differences demonstrated similar variability as evident from the Bland–Altman plots (Figs. 1 and 2) and the correlation coefficients shown in Supplemental Table 1. Also, averaging SUVmax and SUVpeak for all lesions in an individual patient to calculate aSUVmax and aSUVpeak had no major relevant effect on the repeatability of the measurements (Figs. 1 and 2; Table 3; Supplemental Table 1). The distribution of the SUV differences in the original scale was similar for the ACRIN and Merck trials. Because lesion SUVs were, on average, more than 1.6 times lower for the Merck than for the ACRIN trial, the difference of log-transformed SUVs was larger for the Merck trial than for the ACRIN trial (Figs. 3 and 4). The higher tumor SUVs of the ACRIN patients may be related to differences in the biodistribution of 18F-FDG because body weight of the ACRIN patient population was 1.3 times higher than that of the Merck patient population (21). However, additional factors are likely involved, because tumor SUVs normalized to lean body mass (21) were also markedly higher for the ACRIN patients (average SUV 10.6 for the ACRIN population, compared with 6.8 for the Merck population, at the time of the first PET/CT scan).
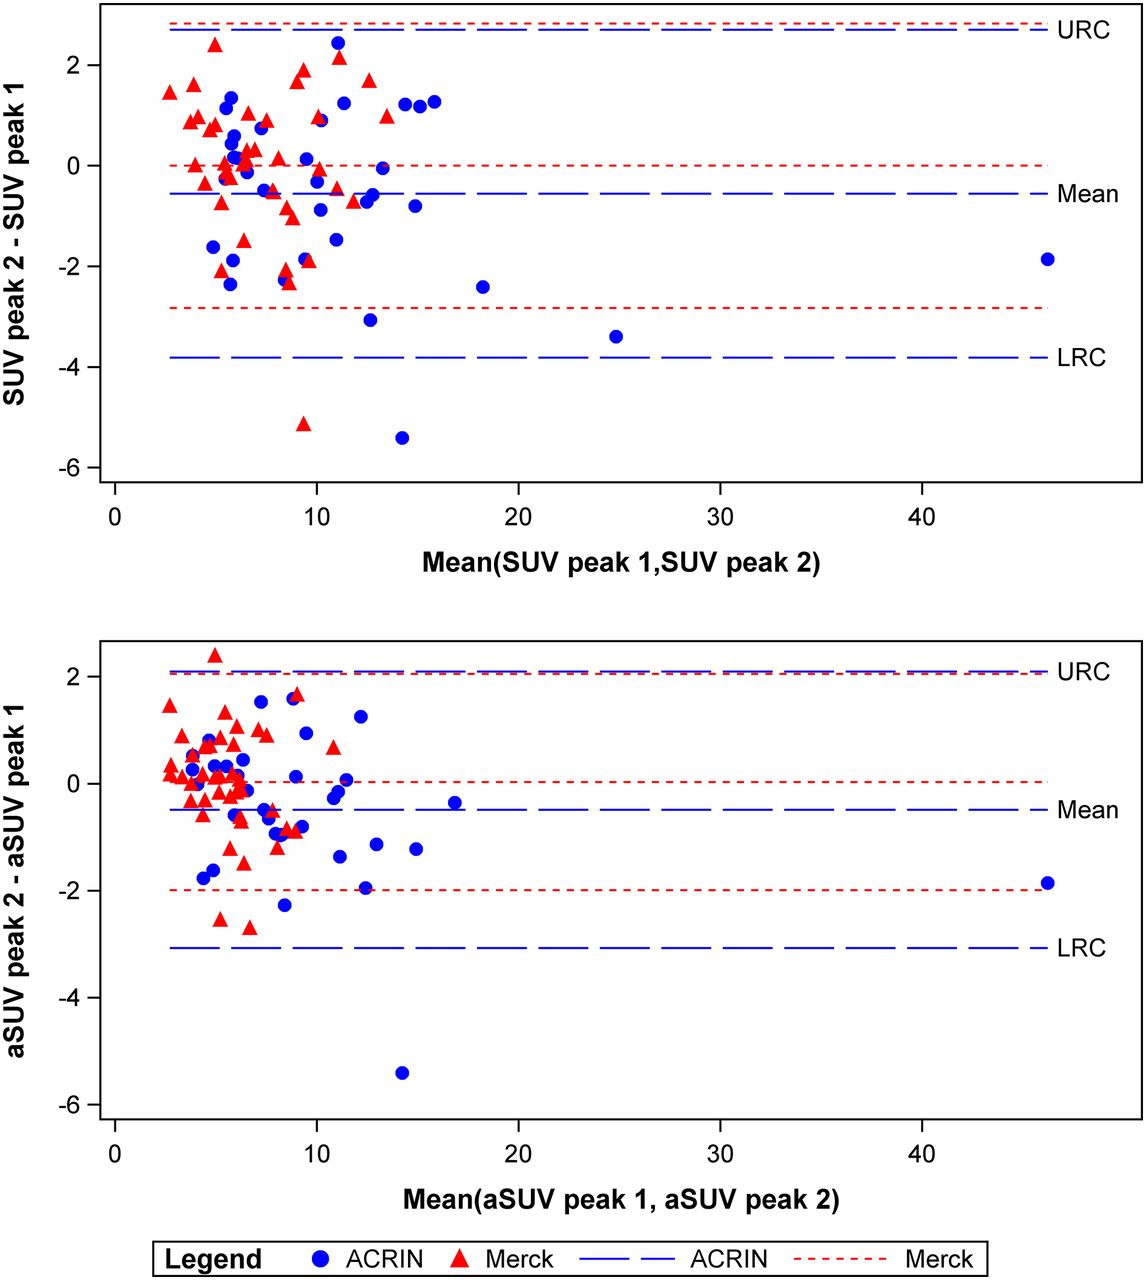
Bland–Altman plots showing repeatability of tumor 18F-FDG uptake measured by SUVpeak for most active target lesion (top) or SUVpeak averaged for several lesions (aSUVpeak, bottom). SUV unit is g/mL. LRC = lower RC; URC = upper RC.
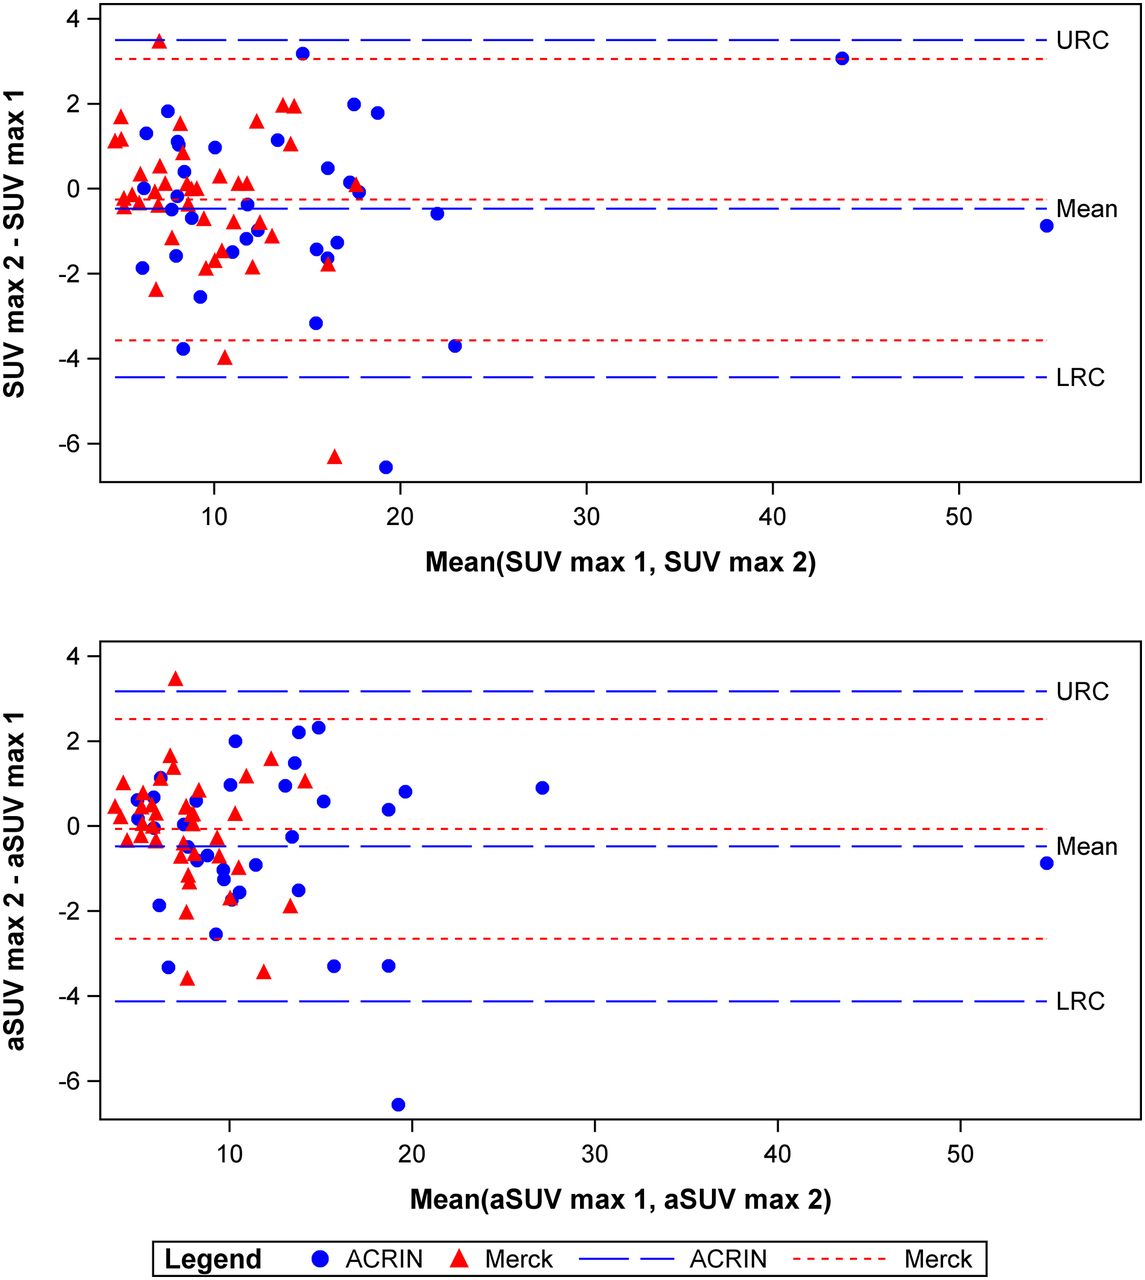
Bland–Altman plots showing repeatability of tumor 18F-FDG uptake measured by SUVmax (top) or SUVmax averaged for several lesions (aSUVmax, bottom). SUV unit is g/mL. LRC = lower RC; URC = upper RC.
RCs and Their 95% CIs
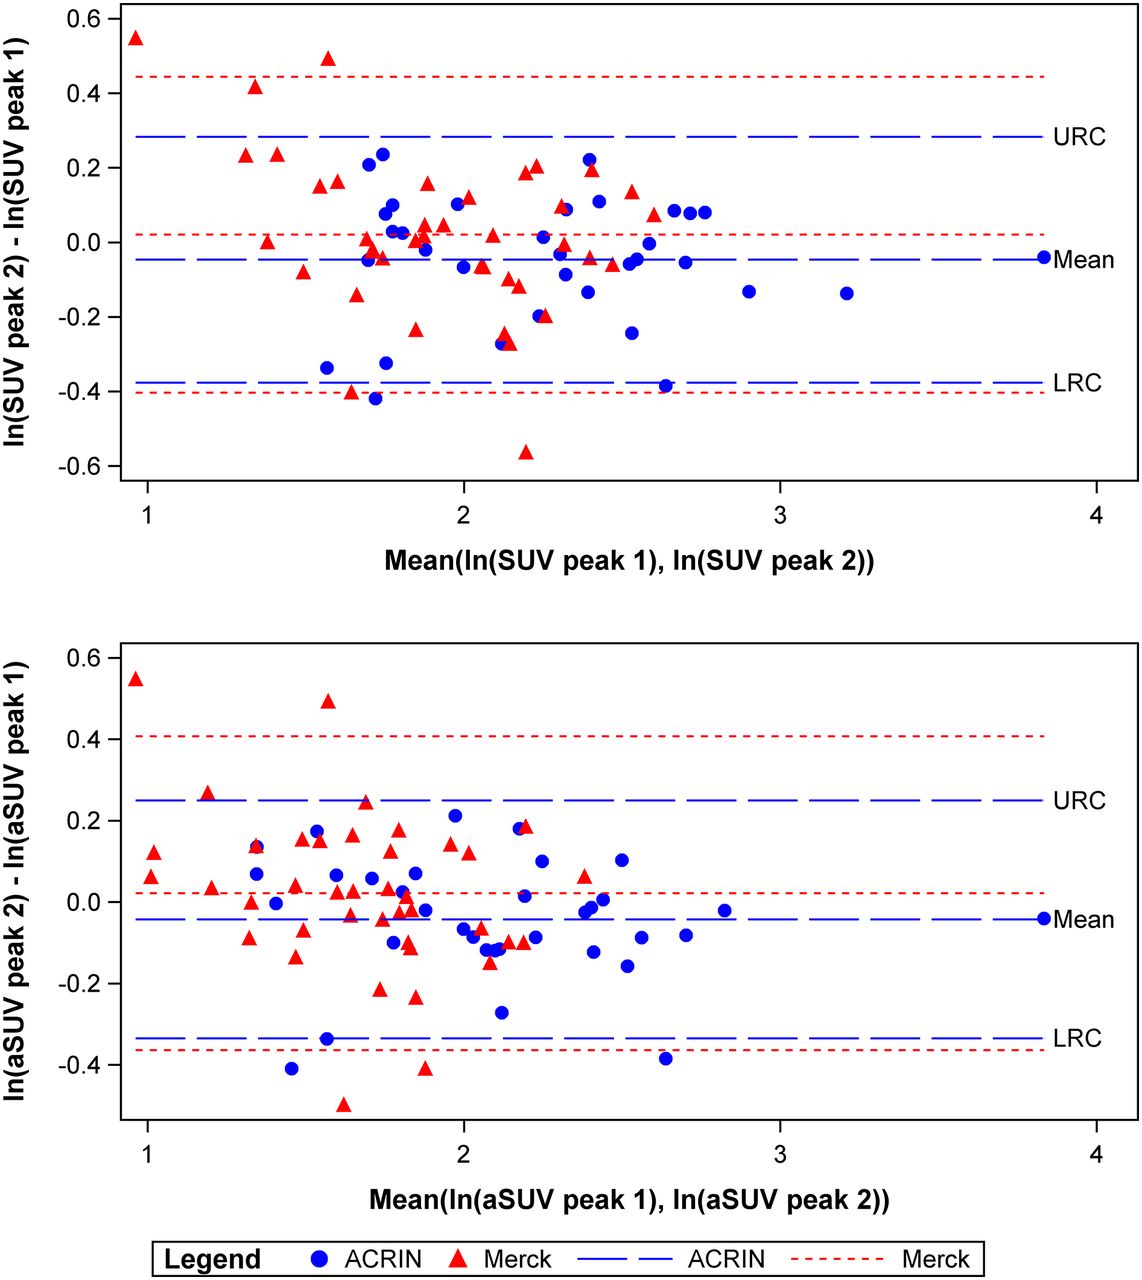
Bland–Altman plots showing repeatability of tumor 18F-FDG uptake measured by log-transformed SUVpeak (top) or log-transformed SUVpeak averaged for several lesions (aSUVpeak, bottom). SUV unit is g/mL. LRC = lower RC; URC = upper RC.

Bland–Altman plots showing repeatability of tumor 18F-FDG uptake measured by log-transformed SUVmax (top) or log-transformed SUVmax averaged for several lesions (aSUVmax, bottom). SUV unit is g/mL. LRC = lower RC; URC = upper RC.
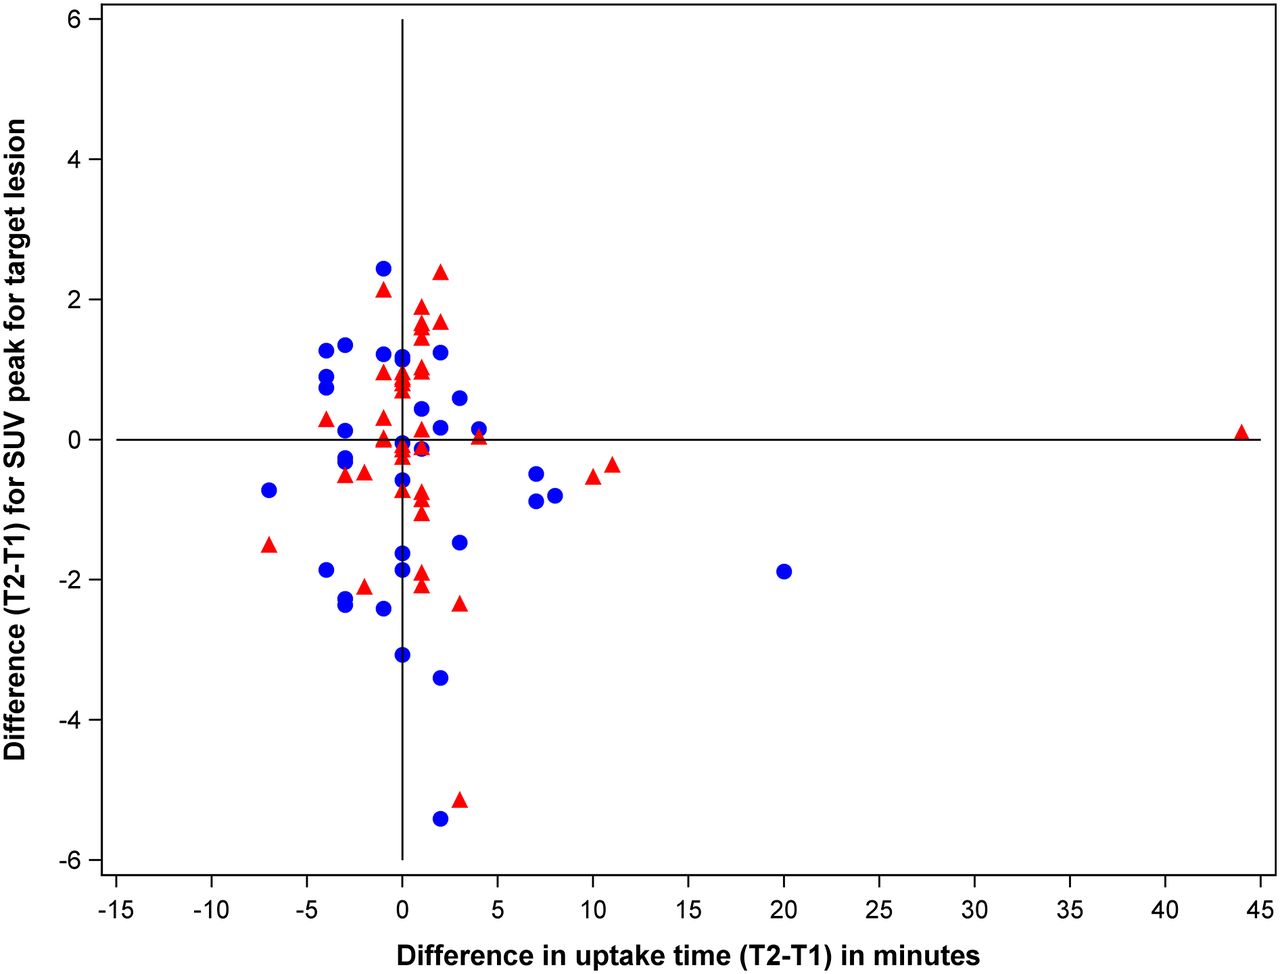
To identify factors that may explain the variability of SUV measurements, we correlated the differences in SUVpeak measurements with various parameters that potentially affect tumor 18F-FDG uptake. Specifically, we analyzed whether body weight, age, clinical stage, blood glucose levels, location of the target lesion, and number of lesions are correlated with the variability of SUV differences. Supplemental Figure 3 indicates that none of these factors had a clear impact on the variability of SUV measurements, although there was a trend of higher variability for the pulmonary lesions. In addition to these patient-related factors, we also analyzed whether differences in uptake time had an impact on the variability of SUV measurements. As shown in Figure 5, no correlation between differences in uptake time and differences in SUVpeak measurements was observed. Thus, differences in radiotracer uptake time over the range encountered in our study population had no major influence on the observed variability of SUVs in this study.

Correlation between differences in SUVpeak and differences in uptake time for target lesions. SUV unit is g/mL.
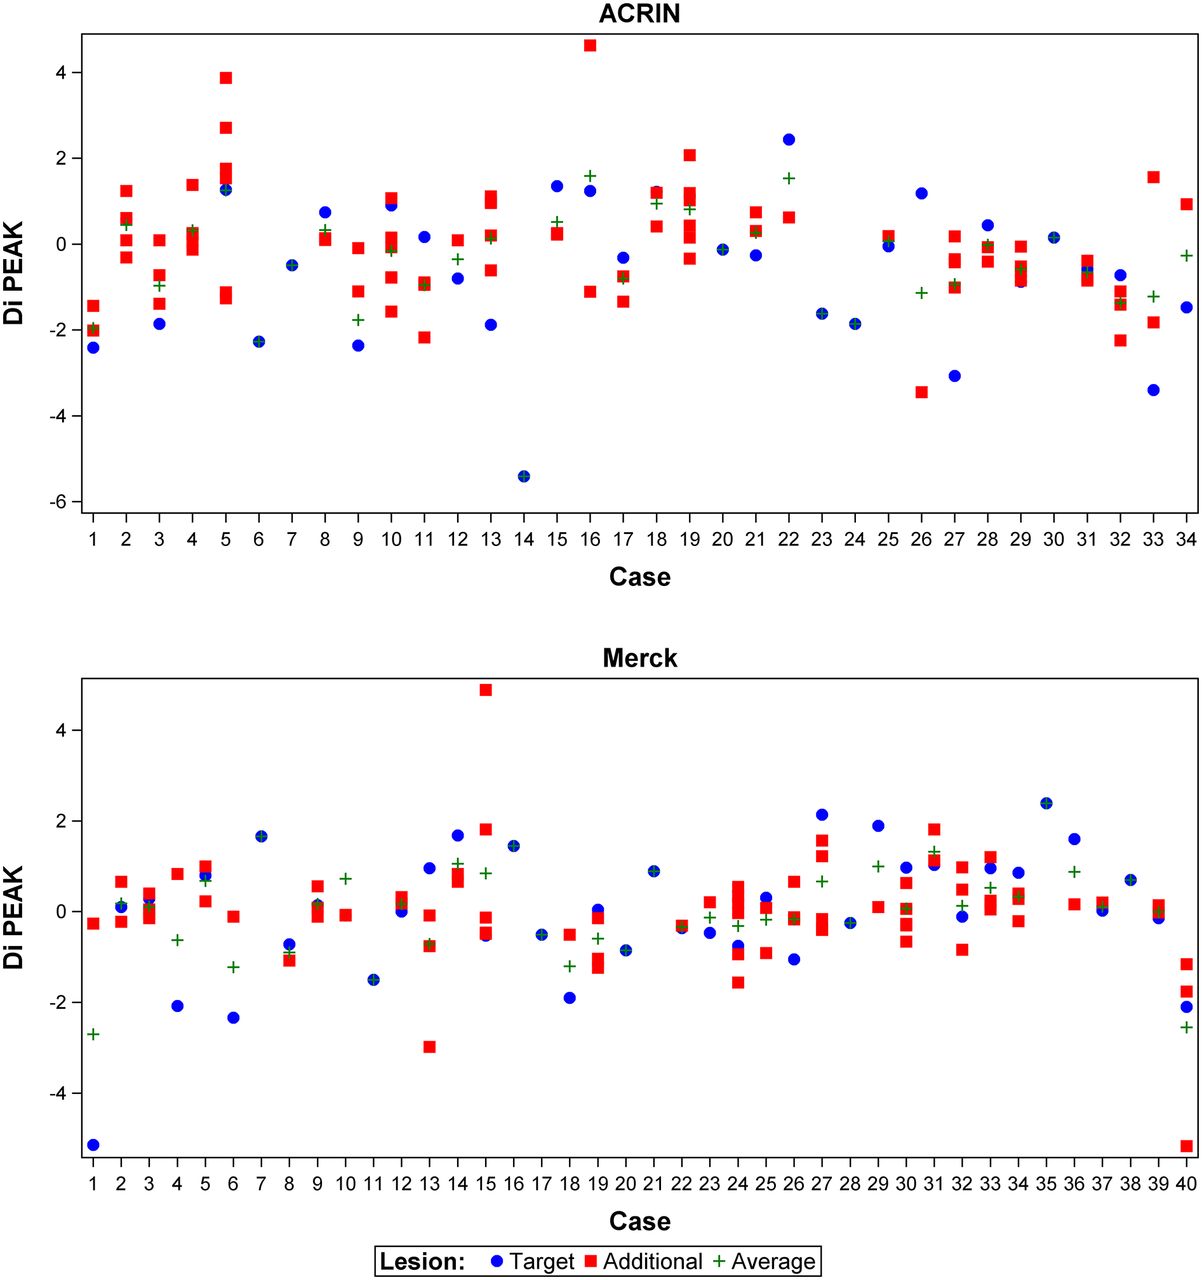
The log-transformed SUVs were used to define the 95% RC for the various studied parameters (Table 3). Supplemental Table 2 shows the corresponding coefficients of variation for comparison with prior studies. Overall, all parameters demonstrated similar RCs, with widely overlapping CIs. Figure 6 shows that, in most of the patients, SUVs of the target lesion and additional lesions changed in the same direction, which explains why the analysis of multiple lesions only slightly reduced the variability of the measurements.

Scatterplot showing differences between SUVpeak for target lesions (red) and additional lesions (blue) by patient ID. In many cases, SUV differences are in same direction and of similar magnitude for target lesion and additional lesions.
DISCUSSION
The variability of SUVs observed in this study is slightly higher than in previous single-center studies of patients with lung cancer and other malignancies but similar to the results of a previous multicenter study in patients with gastrointestinal malignancies (14). There are several potential reasons why the repeatability in NSCLC may be better or worse than in other tumors. On the one hand, the high metabolic activity of most NSCLCs may facilitate quantitative measurements (18). On the other hand, respiratory movement may cause errors in quantitative parameters because the PET signal is averaged over several breathing cycles and misregistration of the liver on PET and CT scans can result in considerable underestimation of tumor 18F-FDG uptake (22). Respiratory gating can minimize these measurement errors, but because it is not yet widely used clinically, it was not applied in this study (22).
To understand the variability of SUV measurements in our patient population, we investigated several clinical factors that may affect the measurements (23). We observed only a trend of higher SUV measurement variability in the lungs (Supplemental Fig. 3), which may be due to respiratory movement.
There is a longstanding discussion on how tumor 18F-FDG uptake should be measured on PET/CT studies. Phantom studies have indicated that SUVmax measurements are more influenced by variations in acquisition and reconstruction protocols than measurements averaging the information of several voxels (24,25), although the differences are mitigated by the noise correlations introduced during image reconstruction (26). On the other hand, measurement of mean tumor 18F-FDG uptake requires defining tumor borders, which may introduce interobserver variability. SUVpeak measurements represent a compromise between SUVmax and SUVmean measurements and have been used in several studies to assess tumor response to therapy (19). In the present study, we did not observe differences in the test–retest variability of SUVmax and SUVpeak measurements. Similarly, a recent study in patients with ovarian cancer (11) has reported almost identical repeatability for SUVmax and SUVmean measurements, suggesting that for the typical count statistics of whole-body 18F-FDG PET studies, the repeatability of SUVmax and SUVmean measurements are not fundamentally different.
A related question is whether to use measurements of tumor 18F-FDG uptake for a single lesion or to average SUVmax or SUVmean/SUVpeak measurements for multiple lesions. Most previous studies on the test–retest variability of tumor 18F-FDG uptake have used data for a single lesion (7,9,12). In the present study, averaging SUVpeak or SUVmax measurements for several lesions in an individual patient (aSUVmax and aSUVpeak) had no major impact on the test–retest repeatability of these measurements, because in many patients all lesions changed in a similar way between the first and second PET/CT scan (Fig. 6). Nevertheless, parameters that average information from several lesions may correlate more strongly with patient outcome (27). Therefore, further studies on treatment monitoring with 18F-FDG PET should systematically compare measurements of single and multiple lesions.
The test–retest repeatability of SUVs can be analyzed on the basis of either SUV differences or SUV ratios. We focused on SUV ratios because tumor response has generally been defined as a percentage change in pretreatment SUVs and calculated 95% RCs for percentage changes in SUVs. RCs allow an objective definition of criteria for tumor response or progression: if tumor 18F-FDG uptake after therapy decreases by more than the RC, there is a less than 2.5% probability that this decrease is due to variability of the measurement process. Such a change in 18F-FDG uptake most likely indicates an effect of therapy. Therefore, our findings indicate that a decrease in 18F-FDG uptake by 30% likely reflects a metabolic response to therapy. A larger relative increase in 18F-FDG uptake is needed for confidence that the change represents metabolic progression (Table 3). The asymmetry of the RCs is a consequence of the log transformation of the original measurements and exponentiation in Equation 5 (14). At first glance, the asymmetry may seem counterintuitive, but it is the appropriate way to express the repeatability of relative SUV changes, as seen in the following example: a decrease in SUV from 5 to 4 represents a relative change of 20%, whereas an increase in SUV from 4 to 5 represents a 25% relative change, although both pairs of SUV measurement have the same variability. Therefore, symmetric RCs are not suitable for changes of a parameter relative to a baseline measurement.
CONCLUSION
Both trials of patients with advanced NSCLC suggest that for lesions greater than 2 cm in size and with SUVmax greater than 4.0, decreases in tumor 18F-FDG uptake by more than 30% and increases by more than 40% are unlikely to reflect variability of the measurement process and could therefore be used to define metabolic response and metabolic progression, respectively. Thus, our data support the recently published PET Response Criteria in Solid Tumors for assessing tumor response on PET (19).
DISCLOSURE
The costs of publication of this article were defrayed in part by the payment of page charges. Therefore, and solely to indicate this fact, this article is hereby marked “advertisement” in accordance with 18 USC section 1734. This work was conducted by The American College of Radiology Imaging Network (now the ECOG-ACRIN Cancer Research Group) and supported by funding from the Foundation for the National Institutes of Health and by National Cancer Institute grants U01-CA-80098 and U01-CA-79778, under a cooperative agreement with the Cancer Imaging Program, Division of Cancer Treatment and Diagnosis. Merck & Co Inc. has no financial investments in medical imaging. No other potential conflict of interest relevant to this article was reported.
Acknowledgments
We gratefully acknowledge the participating institutions and the principal investigators at each site (Supplemental Table 3). We also thank the many radiologists, radiation and medical oncologists, nuclear medicine technologists, and research coordinators at the participating institutions, the American College of Radiology Imaging Network (ACRIN) staff who supported ACRIN 6678, and the Biostatistical and Data Management Center at Brown University in Providence, Rhode Island (Supplemental Table 4). Without the diligent efforts of all of these individuals, this study would not have been possible.
Footnotes
Published online Apr. 23, 2015.
- © 2015 by the Society of Nuclear Medicine and Molecular Imaging, Inc.
REFERENCES
- Received for publication August 24, 2014.
- Accepted for publication March 26, 2015.


Jump to section
Related Articles
Cited By...
- 18F-FDG PET/CT Imaging Biomarkers for Early and Late Evaluation of Response to First-Line Chemotherapy in Patients with Pancreatic Ductal Adenocarcinoma
- Quantitative Test-Retest Measurement of 68Ga-PSMA-HBED-CC in Tumor and Normal Tissue
- Use of a Qualification Phantom for PET Brain Imaging in a Multicenter Consortium: A Collaboration Between the Pediatric Brain Tumor Consortium and the SNMMI Clinical Trials Network
- Test-Retest Reproducibility of 18F-FDG PET/CT Uptake in Cancer Patients Within a Qualified and Calibrated Local Network
- The Influence of Minimal Misalignment on the Repeatability of PET Images Examined by the Repositioning of Point Sources
- Reproducibility and Repeatability of Semiquantitative 18F-Fluorodihydrotestosterone Uptake Metrics in Castration-Resistant Prostate Cancer Metastases: A Prospective Multicenter Study
- Reproducibility of MR-Based Attenuation Maps in PET/MRI and the Impact on PET Quantification in Lung Cancer
- 18F-FDG PET/CT for Very Early Response Evaluation Predicts CT Response in Erlotinib-Treated Non-Small Cell Lung Cancer Patients: A Comparison of Assessment Methods
- Test-Retest Variability in Lesion SUV and Lesion SUR in 18F-FDG PET: An Analysis of Data from Two Prospective Multicenter Trials
- Quantitation of Cancer Treatment Response by 18F-FDG PET/CT: Multicenter Assessment of Measurement Variability
- Qualification of National Cancer Institute-Designated Cancer Centers for Quantitative PET/CT Imaging in Clinical Trials
- Repeatability of SUV in Oncologic 18F-FDG PET
- Reliability of PET/CT Shape and Heterogeneity Features in Functional and Morphologic Components of Non-Small Cell Lung Cancer Tumors: A Repeatability Analysis in a Prospective Multicenter Cohort
- Repeatability of 18F-FLT PET in a Multicenter Study of Patients with High-Grade Glioma
- Repeatability of Quantitative 18F-NaF PET: A Multicenter Study
- Does PET SUV Harmonization Affect PERCIST Response Classification?
- Repeatability of Quantitative Whole-Body 18F-FDG PET/CT Uptake Measures as Function of Uptake Interval and Lesion Selection in Non-Small Cell Lung Cancer Patients
- Multicenter Clinical Trials Using 18F-FDG PET to Measure Early Response to Oncologic Therapy: Effects of Injection-to-Acquisition Time Variability on Required Sample Size
- SUVpeak Performance in Lung Cancer: Comparison to Average SUV from the 40 Hottest Voxels
- Reply: Repeatability of Tumor SUV Quantification: The Role of Variable Blood SUV
- Repeatability of Tumor SUV Quantification: The Role of Variable Blood SUV
- The Value of Establishing the Quantitative Accuracy of PET/CT Imaging