


Abstract
The aim of this study was to assess the interobserver variability of quantitative 18F-FDG PET/CT parameters used in assessments of treatment response across multiple sites and readers. Methods: Paired pre- and posttreatment 18F-FDG PET/CT images of 30 oncologic patients were distributed to 22 readers across 15 U.S. and international sites. One reader was aware of the full medical history (readreference) of the patients, whereas the 21 other readers were unaware. The readers selected the single hottest tumor from each study, and made SUV measurements from this target lesion and the liver. Descriptive statistics, percentage changes in the measurements, and their agreements were obtained. Results: The intraclass correlation coefficient for the percentage change in SUVmax (%ΔSUVmax) of the hottest tumor was 0.894 (95% confidence interval [CI], 0.813–0.941), and the individual equivalence coefficient was 1.931 (95% CI, 0.568–6.449) when all reads were included (n = 638). When only the measurements that selected the same target tumor as the readreference (n = 486) were included, the intraclass correlation coefficient for the %ΔSUVmax was 0.944 (95% CI, 0.841–0.989), and the individual equivalence coefficient was −0.688 (95% CI, −1.810 to −0.092). The absolute change in SUVmean of liver corrected for lean body mass showed upper and lower limits of agreement (average bias ± 2 SDs) of 0.13 and −0.13 g/mL. Conclusion: The quantitative tumor SUV changes measured across multiple sites and readers show a high correlation. Selection of the same tumor target among readers further increased the degree of correlation.
PET/CT with 18F-FDG is widely used for assessing response to therapy in clinical trials and clinical practice for patients with cancer. However, data are limited on the concordance of readers using varying software systems in quantitatively determining the treatment response using 18F-FDG PET/CT.
The ability of multiple readers to assign the same treatment response is to some extent dependent on the repeatability of the quantitative data obtained from the images. Despite the numerous factors known to result in variability of SUV measured from 18F-FDG PET/CT, the interobserver reproducibility of SUV and percentage change in SUV were higher than for measurements of CT size in a single-institution study (1).
Our aim was to study the consistency of the major quantitative PET parameters collected across sites and readers, to determine what component of variability there is in target lesion selection and reading software elements. When all readers have identical sets of representative human 18F-FDG PET/CT digital data available, low to no variability would be expected in the SUV measurements, except for reader selection of targets and software configurations (2,3). Low variability among sites would support quantitative 18F-FDG PET/CT studies being deployed in a more general manner for treatment response assessment whereas any variability suggests further opportunities for process improvement to minimize variance.
MATERIALS AND METHODS
Determining Number of Cases and Readers
Preliminary data from a single-institution/workstation study estimated an intraclass correlation coefficient (ICC) of 0.94 among 4 readers for determination of percentage change in SUVmax (%ΔSUVmax) (1). We expected to observe an ICC of 0.90 resulting from greater variation across sites, given multiple readers and workstations. Assuming 2 readers at each site evaluating 30 cases, 15 sites lead to a 95% confidence interval (95% CI) of 0.852–0.948. This estimate will ensure the ICC is in excess of 0.85, indicating strong reproducibility across sites. Thus, a protocol of 15 sites with 2 readers per site each evaluating 30 cases was planned on the basis of desired precision of ICC estimate.
Case and Site Selection
Images of 31 patients who underwent 18F-FDG PET/CT obtained before and either during or after chemotherapy or combination chemobiologic therapy from a central site were selected from a group of tumor types having representative patterns of 18F-FDG avidity. All PET/CT images were acquired using a 3-dimensional PET scanner (Discovery RX; GE Healthcare) with lutetium-yttrium-oxyorthosilicate crystals and iterative 3-dimensional image acquisition/processing. Cases were chosen by consensus of 2 nuclear medicine physicians to purposely include a mix of single and multiple tumors on the pretreatment scan (1 tumor, n = 6; >1 but <10 tumors, n = 19; ≥10 tumors, n = 6) and a mix of the 4 major response categories using PERCIST 1.0 (complete metabolic response, n = 4; partial metabolic response, n = 11; stable metabolic disease, n = 4; and progressive metabolic disease, n = 12).
An initial survey was sent to readers at 31 prospective sites, both National Cancer Institute Quantitative Imaging Network–affiliated and not affiliated, by e-mail. The survey requested information about the reader’s experience with PET and technical workstation status to ensure feasibility of quantitative assessment. Twenty-three sites that responded all had adequate analysis software and were invited to participate. Ideally, 2 experienced nuclear medicine physicians or nuclear radiologists at each site were asked to independently assess the cases.
Patient Population and Image Distribution
As a test case, the central study site provided the same digital data from 1 patient to all participating sites. Liver measurements were requested to verify the integrity of image transfer and to ensure that the values were within the expected 20% range of the reference site; all of the 17 sites that responded satisfied these 2 criteria. The mean liver SUV corrected for lean body mass was 1.12 ± 0.12 before treatment and 1.37 ± 0.17 after treatment.
The remaining 30 anonymized cases of pre- and posttreatment 18F-FDG PET/CT studies (total 60 studies) were distributed with directions for measurement methods and formatted reading forms. Approval from the institutional review board was obtained, and patient consent was waived for this study of anonymized image data.
Measurement
Individual measurements from coupled pre- and posttreatment 18F-FDG PET/CT images from 1 patient were counted as a read. The coupled pre- and posttreatment measurements for all 30 cases from a single reader were counted as a set of reads. One reader from the central site (reader 1) had full knowledge of the primary tumors, treatment histories, and subsequent follow-up results, but all other readers had no knowledge of the patients’ medical histories because the reader is frequently masked in the setting of multicenter trials. For statistical purpose, the measurements by reader 1 were considered as the readreference (the reference standard for comparison).
Each reader determined which tumor to measure. First, readers were asked to measure the SUVmax of the hottest tumor in the pretreatment image and follow the same lesion in the posttreatment image, which is a common clinical practice (baseline lesion followed). Second, readers were asked to measure the SUVmax of the hottest tumor in each of the pre- and posttreatment images, in which the selected lesion in the posttreatment image may or may not be the same as the lesion selected in the pretreatment image (hottest lesion to hottest lesion). The rationale was that the hottest lesion on follow-up may be the most resistant to therapy, and thus more representative of the actual response in the patient (4). Third, readers were asked to measure the SUVpeak corrected for lean body mass (SULpeak) from the hottest tumor in each of the pre- and posttreatment images (hottest lesion to hottest lesion). The SULpeak was predefined as the highest SUVmean corrected for lean body mass computed from a 1-cm3 spheric volume of interest (VOI). Finally, readers were asked to measure the mean value in the liver from a 3-cm-diameter spheric VOI centered in the right side of the liver (liver SULmean). The tumor SULpeak and liver SULmean were requested to test the variables suggested by PERCIST 1.0 (4). SULmax was not requested because the percentage change computation would cancel out the lean body mass correction factor and the resulting percentage change of SULpeak would essentially be the same as with %ΔSUVmax, assuming there was no drastic change in body weight. When a complete metabolic response was achieved and no tumor lesion was visually perceptible, measurement was requested from the site of the original tumor.
For each measurement, the readers recorded the anatomic site and screen-saved the PET/CT image from their workstation. There was no separate training session for the participating readers.
Various workstations and software were used: GE Healthcare AW; Hermes Hybrid Viewer; MedImage MedView; MiMVista Maestro; Mirada Medical XD; and Siemens E-Soft, True-D, and Syngo; and in-house developed software. The readreference used Mirada Medical XD.
Statistical Analysis
The primary metric was the %ΔSUVmax from before to after treatment. Percentage change was defined as [(posttreatment measurement – pretreatment measurement)/(pretreatment measurement)] × 100. Restricted maximum likelihood estimation of variance components in a random-effects model was used to estimate the intra- and intersubject variance components for each measure, including case and reader as random effects. The variance component estimates were used to compute the ICC, defined as the intersubject variance divided by the total variance (intersubject variance + intrasubject variance + error variance). The CI was constructed using the bias-corrected and accelerated bootstrap with 1,000 replicates, where the sampling unit was a read to adjust for both bias and skewness in the bootstrap distribution.
As another approach to assess agreement, assessment of interchangeability was performed (5). The interreader variability from the reference site was assessed using the individual equivalence coefficient (IEC), setting the level of measurement error within a site. Then the effect arising when readers from different sites are involved, instead of 2 readers from the same site, was quantified. To claim satisfactory agreement, the Food and Drug Administration recommended boundary below 2.4948 for good individual agreement (6). The CI for IEC was constructed using the bootstrap percentile interval with 1,000 replicates, where the sampling unit was a case.
RESULTS
Twenty-two sets of reads were received from 16 sites from August to February 2014. Of the 22 sets of reads, a single nuclear medicine physician/radiologist measured all cases in 15 sets. For 2 sets, 2 readers divided the cases, and each reader measured 15 cases. For 5 sets, 2 readers worked together to reach consensus. For statistical analysis, when 2 people were involved to produce a single set of reads, they were considered as a single reader. One case was subsequently excluded from analysis due to error with the distribution server.
All Reads
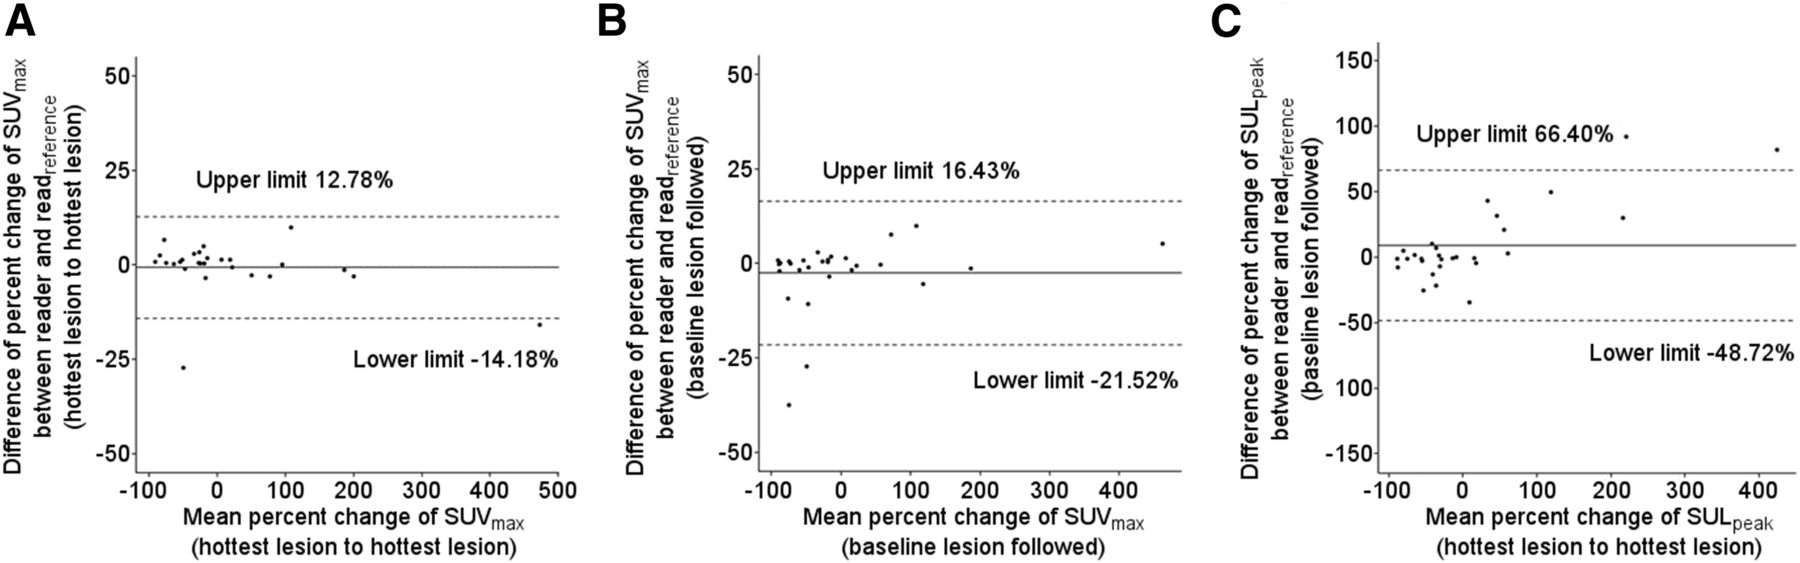
Twenty-nine cases with 22 separate sets of reads yielded a total of 638 reads. The Bland–Altman plots of the percentage change (%Δ) in the tumor measurements are shown in Figure 1. The plots for the other PET parameters are shown in Supplemental Figure 1–3 (supplemental materials are available at http://jnm.snmjournals.org). The overall ICC for the %ΔSUVmax (hottest lesion to hottest lesion) was 0.894 (95% CI, 0.813–0.941), and the IEC was 1.931 (95% CI, 0.568–6.449). The ICC and IEC for other measurements are shown in Table 1. When control for the number of readers—single reader versus 2 readers—was performed, no statistical difference was noted (ICC, 0.894; 95% CI, 0.796–0.937).

Bland–Altman plots of percentage change of tumor 18F-FDG uptake from before to after treatment. The plots are for percentage changes of SUVmax (hottest lesion to hottest lesion) (A), SUVmax (baseline lesion followed) (B), and SULpeak (hottest lesion to hottest lesion) (C). Each dot represents a case (total, 29 cases). x-axis represents average mean percentage change measurement by all readers. y-axis represents average difference between 21 readers, the readreference. Solid line represents average bias, and the dashed lines represent corresponding bias ± 2 SDs.
Overall ICC and IEC for Tumor Measurements
Reads with Same Target Tumor
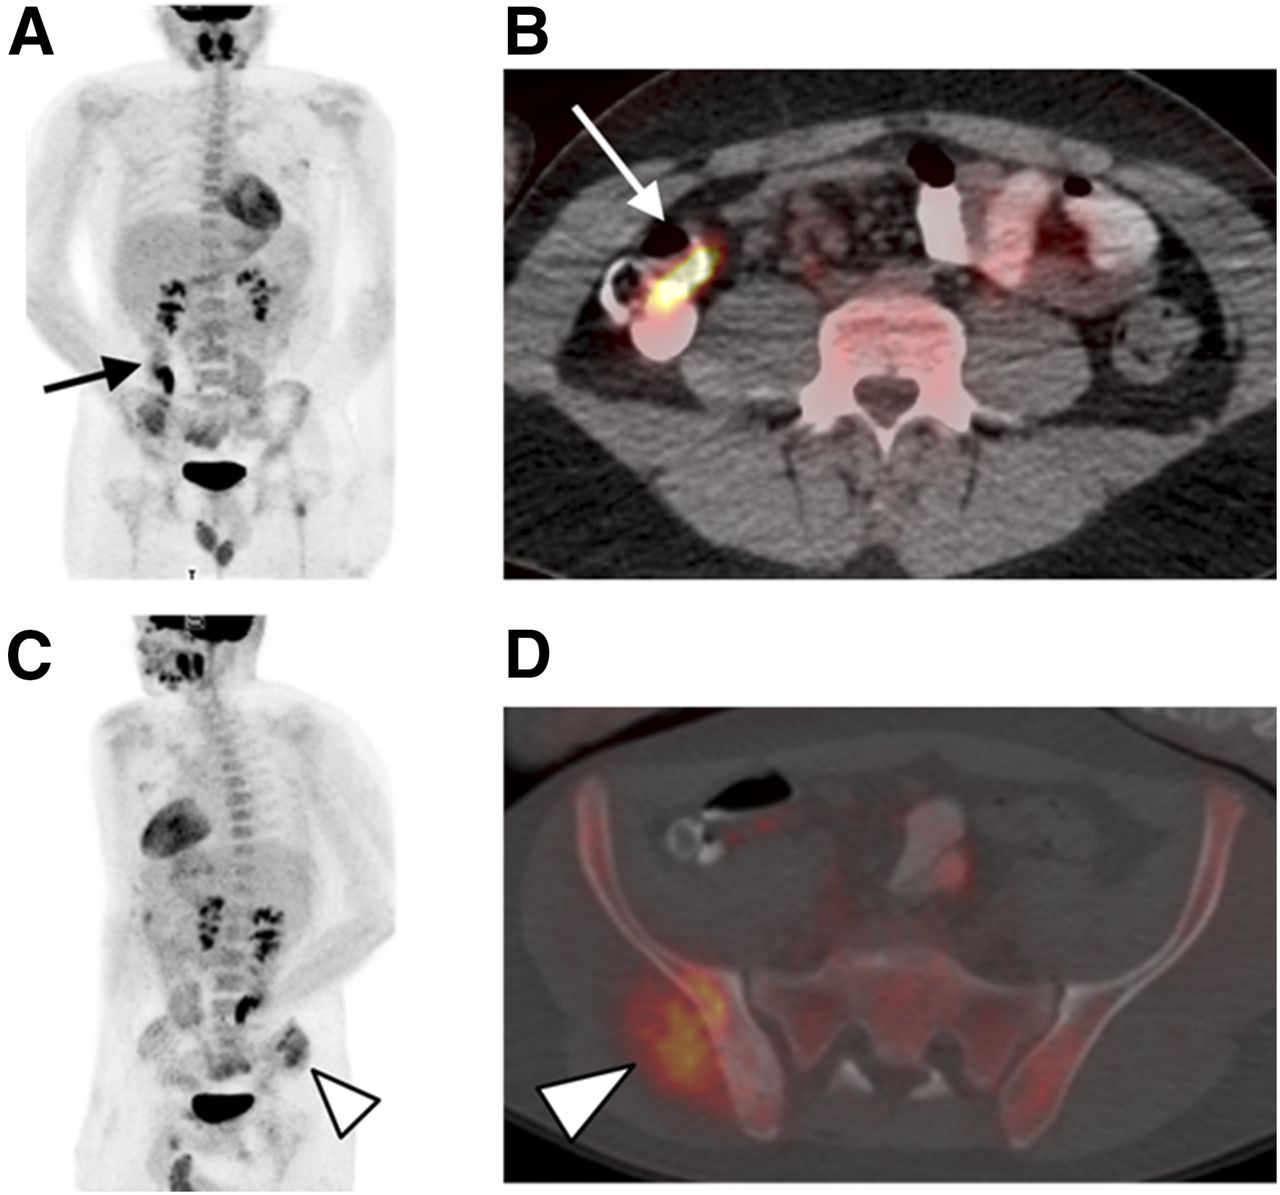
Among the 638 reads, the readers selected a different site as the target from the readreference in either the pre- or posttreatment images in 152 reads. Of a total of 29 cases, a different target was chosen from the readreference for an average of 2.9 ± 1.62 cases (range, 0–6) for the pretreatment images and 5.1 ± 1.53 cases (range, 2–10) for the posttreatment images. Only 1 reader chose the same hottest tumor in all cases as the readreference in the pretreatment images. The cases that resulted most often in discordant target selections had extensive metastases involving multiple bones or nodal stations (results per case and reader in Supplemental Figs. 4 and 5). The readers, being unaware of the medical history, sometimes selected benign condition as the hottest tumor (Fig. 2).

Physiologic 18F-FDG uptake in bowel was a source of confusion for readers who were completely unaware of primary tumor and clinical history. PET maximum-intensity projection (A) and axial fused PET/CT image (B) of example case. 18F-FDG uptake in bowel (arrows) was chosen by some readers as hottest tumor. (C) Maximum-intensity-projection image of same patient is rotated to better demonstrate sarcoma mass (arrowhead). (D) Axial fused PET/CT image at more inferior level shows mass involving right iliac bone and gluteus muscle (arrowhead). This sarcoma lesion was true target lesion when considering patient’s medical history.
For only the reads agreeing on target selection with the readreference, the distribution of the %Δ data is shown in Figure 3 and the Bland–Altman plots in Figure 4. For the reads agreeing on target selection with the readreference, the ICC for %ΔSUVmax (hottest lesion to hottest lesion) was 0.944 (95% CI, 0.841–0.989), and the IEC was −0.688 (95% CI, −1.810 to −0.092). The ICC and IEC of other PET parameters are in Table 1. The plots for the other PET measurements are in Supplemental Figures 6–9.

Data are plotted for only cases with same target lesion selected as readreference (n = 486). Percentage change in tumor 18F-FDG uptake from before to after treatment was measured by SUVmax (hottest lesion to hottest lesion). Plots for SUVmax (baseline lesion followed) and SULpeak (hottest lesion to hottest lesion) are in supplemental materials.
Bland–Altman plots of percentage change of tumor 18F-FDG uptake with only cases that selected same target lesion as readreference included. Plots are for SUVmax (hottest lesion to hottest lesion) (A), SUVmax (baseline lesion followed) (B), and SULpeak (hottest lesion to hottest lesion) (C). x-axis represents average mean percentage change measurement by all readers. y-axis represents average difference between 21 readers and reference read. Solid line represents average bias, and dashed lines represent corresponding bias ± 2 SDs.
The correlation coefficient (r2) for agreement between the readreference and the other 21 readers was high—the r2 was 0.997 for %ΔSUVmax (hottest lesion to hottest lesion). The r2 values for other PET parameters are in Table 2 and graphical displays in Supplemental Figures 10 and 11.
Correlation Coefficient Between readreference and Other Readers
Liver
The ICC for the percentage change in the liver SULmean was 0.751 (95% CI, 0.656–0.810), and the IEC was 7.799 (95% CI, 3.417–18.493). The Bland–Altman limits of agreement for absolute and percentage differences in liver SULmean measurements were small, as seen in Figure 5. Even the outlier absolute SULmean differences are within 0.25 SUL units from the average bias and the outlier percentage SULmean differences within 10% from the average bias. Agreement between the readreference and the other 21 readers showed an r2 of 0.95.

Bland–Altman plots for liver SULmean measurements from pretreatment image (A), posttreatment image (B), their absolute change (C), and percentage change (D). x-axis represents average mean measurement by all readers. y-axis represents average difference between 21 readers and reference read. Solid line represents average bias, and dashed lines represent corresponding bias ± 2 SDs.
DISCUSSION
Quantitation of treatment response is of growing importance, especially as we look to detect early treatment–induced alterations in adaptive treatment designs. A high degree of test–retest reproducibility was demonstrated for 18F-FDG PET/CT in various studies (7–9). However, these previous studies did not examine the performance of quantitative representation of response to treatment in the clinical setting for various tumor types, across multiple sites. In the present study, we observed that multiple readers from multiple sites gave similar, but not uncommonly, somewhat different measurements for an identical set of 18F-FDG PET/CT images due to selection of different targets and differing workstation software configurations. Although generally reliable, reader selection of target lesion appeared to contribute to the variability of quantitative change.
The ICC was higher and the IEC lower for all of the PET parameters when only the reads agreeing on target selection with the readreference were analyzed. The selection of the hottest tumor was sometimes problematic, especially because the patient’s diagnosis and medical history were withheld from the readers. Determining which tumor to measure may depend on subjective judgment when there are multiple lesions or prominent and discrete 18F-FDG uptake from a benign cause. Target selection was shown to be a cause of variability in anatomic response assessments with RECIST, and baseline selection of the lesion was pointed out as one of the pitfalls (10,11). Individual determination of target lesion would be required by the physician even when artificial intelligence enters the reading rooms of the PET/CT clinics and automatic measurement tools such as Auto-PERCIST become widely available (12,13). The issue arising from discrepancies of target selection needs to be addressed through comprehensive training. Being able to interpret the multitude of physiologic conditions that can be glucose-avid and being meticulous in the presence of multiple lesions are important steps to achieve the desired level of interreader agreement. In the presence of multiple lesions, sometimes the discrepancies in target selection could have been avoided simply with additional measurements. For example, in case 25, there were 2 axillary lymph nodes with intense 18F-FDG uptake, and some readers chose the node with a lower 18F-FDG uptake. In the cases with numerous tumors displaying a similar degree of 18F-FDG uptake, brief visual inspection would be insufficient for accurate selection of the target lesion.
How to quantitate a complete metabolic response is difficult to answer. Even when the same target was chosen, the readers selected subtly different foci in the posttreatment images and thus recorded slightly different values. Consensus on how to best determine the site of the original tumor and what to measure for tumors showing complete resolution would further enhance the repeatability of the quantitative 18F-FDG PET/CT response. The site corresponding to the hottest uptake from baseline could be identified by automatic image coregistration across different time points, a feature of many reading software, and careful visual consideration of the anatomic structures in the CT portion.
Inclusion of target lesions below the limit of measurability at baseline as suggested in PERCIST could have contributed to lowering the overall ICC. The absolute upper and lower limits of agreement for SUVmax (hottest lesion to hottest lesion) were, in fact, very tight in the Bland–Altman plots: 0.279 and −0.102 for pretreatment and 0.697 and −0.377 for posttreatment measurements. However, in the equation for computing the %Δ, the measurement from the pretreatment image becomes the denominator, and the cases with relatively low 18F-FDG uptake would be susceptible to greater fluctuations in the computed %Δ. Among the 29 cases, 7 cases had target tumor SUVmax below 5.0 in the pretreatment images (range, 2.65–4.60). These lesions with relatively low SUV produced wide ranges of %Δ, especially when the lesion progressed. A responding tumor can yield at most a near 100% drop in SUV, whereas progressing tumors can produce increases by several hundred or even thousand percent. Human error in drawing the VOI around the target is suspected as a cause of variation—either too big a VOI that included sites such as the kidneys and heart, or too small a VOI that excluded the pixels with the highest 18F-FDG uptake. Recording the measurements on the reading forms is another conceivable step for error. One site demonstrated SUVmax consistently lower than the readreference (difference mean, 0.93; 95% CI, 0.61–1.25), possibly from incorrect configuration inherent in the software, such as conversion of the imaging time or injected dose.
The difference in the liver SULmean measurements can be assumed to be partly from the characteristic heterogeneity of hepatic 18F-FDG uptake and from the variations in the setting of the workstation software, such as the method of drawing a spheric VOI (14,15). Both the absolute difference and the percentage difference in liver measurements demonstrated narrow limits of agreement in the Bland–Altman plots. SULpeak is reported to produce lower bias in assessment of PET/CT data (16,17). However, the variations in pixel segmentation and computation methods used by the different software resulted in lower interreader agreement than for the 2 SUVmax measurements in this study. As recently reviewed, consensus on the SULpeak computation method should be made before multicenter studies to use this PET parameter as an alternative to SUVmax, particularly in noisy studies (18).
The fact that the cases were not chosen at random from a clinical trial with uniform imaging conditions may limit the broader applicability of the results. The 30 cases evaluated in this study were specifically selected with the intention of mimicking the clinical reading room conditions, and varying types of tumors, therapeutic regimens, and imaging conditions are represented. Furthermore, the reproducibility of the percentage change in the SUV is only the initial step, and studies examining the reproducibility of the response classification among cases with uniform therapeutic and imaging protocols should follow.
CONCLUSION
Our study indicates that tumor selection by the reader is a major contributor to variability in quantitative 18F-FDG PET/CT assessment of treatment response. A thorough knowledge of the patient’s medical history and being meticulous during the reading process are required to reduce the inconsistency in target selection, though understanding the patient’s full medical history may not be an option in many clinical trials in which the readers are deliberately masked to the history to prevent bias. Despite the use of multiple types of workstation software, and the lack of clinical data to guide lesion selection, results from the readers from multiple U.S. and international sites showed strong reproducibility, supporting 18F-FDG PET/CT as a robust global tool for quantitative analysis of treatment response.
DISCLOSURE
This study was supported by funding from the Radiological Society of North America, the Quantitative Imaging Biomarkers Alliance, NIBIB contract HHSN268201000050C, the National Cancer Institute (5P30CA006973-52, 5U01CA140204-05), and the Research Fund of Seoul St. Mary’s Hospital, The Catholic University of Korea. No other potential conflict of interest relevant to this article was reported.
Acknowledgments
We thank Nancy Obuchowski, PhD, for her valuable statistical advice. The collected efforts of all the QIBA PET/CT readers made this analysis possible, and we thank Eric S. Perlman, MD, American College of Radiology Image Metrix; Hye Ok Kim, MD, Sun Young Chae, MD, and Jin-Sook Ryu, MD, PhD, Asan Medical Center; Andrew M. Scott, MD, and Sam Berlangieri, MD, The Ludwig Institute for Cancer Research; Sung Hoon Kim, MD, PhD, Sae Jung Na, MD, Narae Lee, MD, and Sonya Park, MD, Catholic University of Korea; Christopher Sakellis, MD, Dana Farber Cancer Institute; Edward A. Eikman, MD, and Jaime L. Montilla-Soler, MD, H. Lee Moffit Cancer Center and Research Institute; Huo Lee, MD, Peking Union Medical College Hospital; Sally F. Barrington, MD, and Gary Cook, MD, PET Imaging Centre at St Thomas' King’s College; Meena Kumar, MD, and Andrew Quon, MD, Stanford University; Nathan Hall, MD, PhD, Michael Knopp, MD, PhD, and Jun Zhang, PhD, The Ohio State University; Michael M. Graham, MD, PhD, and Yusuf Menda, MD, University of Iowa; James M. Mountz, MD, PhD, University of Pittsburgh; Mike Sathekge, MBChB, MMed, PhD, MASSAf, and Mariza Vorster, MBCHB, University of Pretoria & Steve Biko Academic Hospital; Andrew Shields, MD, Fatemeh Behnia, MD, and Paul Kinahan, PhD, University of Washington; and Ronald Boellaard, PhD, and Otto Hoekstra, MD, Vrije Universiteit University Medical Center.
Footnotes
Published online Mar. 30, 2017.
- © 2017 by the Society of Nuclear Medicine and Molecular Imaging.
REFERENCES
- Received for publication January 5, 2017.
- Accepted for publication March 10, 2017.


Jump to section
Related Articles
Cited By...
- Radiopharmaceutical Dosimetry for Cancer Therapy: From Theory to Practice
- Validation of Metabolically Active Tumor Volume and Total Lesion Glycolysis as 18F-FDG PET/CT-derived Prognostic Biomarkers in Chemorefractory Metastatic Colorectal Cancer
- 18F-FDG PET/CT Can Predict Development of Thyroiditis Due to Immunotherapy for Lung Cancer
- EBONI: A Tool for Automated Quantification of Bone Metastasis Load in PSMA PET/CT