


Abstract
This study aimed to validate the prognostic value of baseline whole-body metabolically active tumor volume (WB-MATV) and total lesion glycolysis (WB-TLG) measured with 18F-FDG PET/CT in a large cohort of chemorefractory metastatic colorectal cancer (mCRC) patients treated with multikinase inhibitors. The secondary objective of this study was to compare WB-MATV and WB-TLG respective prognostic values with commonly used clinical prognostic factors. Methods: Of 238 patients pooled from 2 successive prospective multicenter trials investigating multikinase inhibitors in chemorefractory mCRC, 224 were considered suitable for analysis. The patients were retrospectively randomly assigned to a development set (n = 155 patients) or a validation set (n = 69 patients). WB-MATV and WB-TLG optimal cutoffs for prediction of overall survival (OS) were determined by Contal and O’Quigley’s method. Univariate analyses were performed to assess the prognostic values of WB-MATV and WB-TLG. Multivariate analyses were performed for WB-MATV and WB-TLG along with clinical factors to identify the independent prognostic factors of OS. The prognostic weight for each parameter was obtained from the Cox model. Results: WB-MATV and WB-TLG optimal cutoffs for OS prediction were 100 cm3 and 500 g, respectively. Univariate analyses showed that WB-MATV and WB-TLG parameters were strongly related to outcome in both the development and the validation sets. In the validation set, the median OS was 5.2 mo versus 12.8 mo for high versus low WB-MATV (hazard ratio [HR], 3.12; P < 0.001) and 4.7 mo versus 13.9 mo for high versus low WB-TLG (HR, 3.67; P < 0.001). The multivariate analyses found that both high WB-MATV and high WB-TLG were independent negative prognostic parameters for OS, having the highest prognostic weight among the well-known clinical prognostic factors (HR, 2.46 and 2.23, respectively; P < 0.001). Conclusion: Baseline WB-MATV and WB-TLG parameters were validated as strong prognosticators of outcome in a large cohort of chemorefractory mCRC patients treated with multikinase inhibitors. These parameters were identified as independent prognostic imaging biomarkers with the highest prognostic values among the commonly used clinical factors. These biomarkers should therefore be used to support the optimal therapeutic strategy.
- FDG PET/CT
- metabolically active tumor volume
- total lesion glycolysis
- metastatic colorectal cancer
- multikinase inhibitors
Colorectal cancer is the third leading cause of cancer death worldwide (1). Despite important improvements in the management of metastatic colorectal cancer (mCRC), the prognosis remains poor, with low 5-y survival rates (1). Nevertheless, there are wide variations in the overall survival (OS) of mCRC patients, and the factors explaining this heterogeneity in survival have not all been identified. So far, most of the independent prognostic factors that have been validated (e.g., Eastern Cooperative Oncology Group performance status [ECOG PS], age, body mass index [BMI], elevated levels of lactate dehydrogenase, and serum albumin) have been related to the general medical condition of the patient and are not tumor-specific (2–5). Investigations of tumor-specific markers such as carcinoembryonic antigen, carbohydrate antigen 19-9, pathologic stage, and gene expression signatures have failed to accurately predict prognosis (6,7). Considering that biomarkers directly related to the tumor should be more specific than existing clinical factors and could more accurately identify those patients at risk of shorter OS, there is an urgent need to investigate and validate new tumor-specific prognostic biomarkers.
Whole-body 18F-FDG PET/CT is now widely accepted as a powerful tool for the assessment and monitoring of oncologic disease (8). The volume-based metabolic parameters—whole-body metabolically active tumor volume (WB-MATV) and total lesion glycolysis (WB-TLG)—have recently been studied as prognosticators of outcome in lymphoma (9–11) and some solid tumors (12–14). TLG was shown to be a predictor of outcome in mCRC in a recent study conducted on a small cohort of patients treated with regorafenib (15). However, this result should be confirmed and validated in a larger cohort of patients and should also be tested with the MATV parameter; indeed, the respective prognostic values of TLG and MATV have never been compared in mCRC.
This study therefore aimed to validate baseline WB-MATV and WB-TLG as prognostic imaging biomarkers in a large cohort of chemorefractory mCRC patients included in 2 successive prospective trials with comparable inclusion criteria. The secondary objective of this study was to compare their respective prognostic values to commonly used clinical prognostic factors.
MATERIALS AND METHODS
Study Design and Participants
This retrospective pooled analysis measured WB-MATV and WB-TLG at the baseline time point. The 18F-FDG PET/CT data were extracted from 2 sequential prospective multicenter phase II nonrandomized clinical trials investigating patients with unresectable chemorefractory mCRC treated with multikinase inhibitors. The SoMore study (EudraCT number 2010-023695-91; NCT number 01290926) investigated a combination of sorafenib (Nexavar, BAY 43-9006; Bayer Pharma AG) and capecitabine (Xeloda; Roche Pharma) (16), whereas the RegARd-C study (EudraCT number 2012-005655-16) investigated regorafenib (Stivarga, BAY 73-4506; Bayer Pharma AG) (17). The main enrollment criteria for these 2 studies were tumor refractory to all standard chemotherapy agents (fluoropyrimidines, irinotecan, and oxaliplatin) and anti-EGFR monoclonal antibodies in the case of RAS wild-type (cetuximab or panitumumab); age greater than 18 y; ECOG PS of 1 or less; life expectancy greater than 12 wk; a baseline 18F-FDG PET/CT examination performed within the 7 d previous to the day of inclusion in the trial with at least 1 measurable target lesion; ability to undergo the therapy; and signed informed consent (17). Both studies were conducted within the same Belgian hospital network and followed a similar study design, testing metabolic response after 1 course of treatment as a predictor of patient’s outcome, with OS as the primary endpoint. Twelve clinical centers and 9 PET/CT centers, all located in Belgium, were involved in these trials. Each PET/CT center followed strict procedural guidelines for patient preparation and imaging (18,19). All but 1 center (n = 1 patient included) obtained EARL accreditation during the first trial. All examinations were performed with the locally available PET/CT scanner: Discovery 690 or LS (GE Healthcare), Gemini TF (Philips), or Biograph 64 (Siemens). Quality assessment was ensured by an independent dedicated academic PET/CT imaging core lab.
Approval from the institutional review board was obtained for this retrospective pooled analysis (CE2616), and all patients gave written informed consent for this study. All imaging data were anonymized.
18F-FDG PET/CT Image Acquisition and Image Analysis Procedures
A quality control analysis was applied to all 18F-FDG PET/CT scans. Any patient who had not fasted for at least 6 h before 18F-FDG injection was rejected, as was any examination with an interval between 18F-FDG injection and scanning outside the range of 55–75 min, and any patient with glycemia higher than 150 mg/dL at the time of 18F-FDG injection. All PET scans were acquired from skull to mid thigh in 3-dimensional mode with an acquisition time of 90 s per bed position. The PET images were corrected for attenuation and scatter using the data from the unenhanced low-dose CT scan.
Two experienced nuclear medicine physicians assessed WB-MATV and WB-TLG for a set of 100 patients randomly selected from the 2 studies. In cases of discrepancy between the 2 observers of WB-MATV or WB-TLG (WB-MATV/TLG) values (defined as a >10% absolute difference in WB-MATV/TLG values), regardless of whether the discrepancy implied a change in category between low and high tumor load, a consensus was reached by a third experienced physician. Because there was good reproducibility in the WB-MATV/TLG measurements between the 2 observers, the WB-MATV/TLG of the remaining patients were assessed by the more experienced nuclear medicine physician.
The nuclear medicine physicians involved in this study were masked to the medical records and treatment outcomes. WB-MATV/TLG measurements were computed on a dedicated workstation (Advantage Workstation; GE Healthcare) using the commercial PET VCAR software, version 4.6 (GE Healthcare), and were normalized to lean body mass. Target lesions were defined as follows: an unequivocal tumor origin, transverse diameter greater than 15 mm on a registered CT image, and an 18F-FDG SUV normalized to lean body mass (SUL) higher than 1.5 × the mean liver SUL + 2 × SD, or in the presence of liver metastasis, 2.0 × mean aorta SUL + 3 × SD, following PERCIST recommendations with a minor adaptation (3 SDs instead of 2 SDs to have comparable thresholds between liver and aorta reference background activities) (20). A volume of interest was drawn on each target lesion using segmentation with a fixed absolute threshold calculated from the patient’s background liver or blood-pool activity, as described above.
The MATV of a lesion was defined as the volume of tumor tissue demonstrating metabolic activity at or above the calculated threshold. TLG was calculated as MATV multiplied by SULmean. WB-MATV and WB-TLG were calculated as the sum of the MATV or TLG values of all target lesions, without a predefined limitation on their number. WB SULmean was extracted from the WB-TLG formula as follows: WB SULmean = WB-TLG/WB-MATV.
Statistical Analysis
The baseline clinical characteristics and survival data were collected prospectively and measured from the date of inclusion in the trials to death from any cause. The patients alive at last follow-up were censored.
Two thirds of the patients remaining after application of the inclusion criteria (n = 224) were randomly assigned to a development set (n = 155 patients) to define the optimal WB-MATV, WB-TLG, and WB SULmean cutoffs, whereas the other third was assigned to a validation set (n = 69 patients) to validate these cutoffs. Patients were stratified by medication (sorafenib/regorafenib), BMI (≥25 vs. <25 kg/m2), and documentation of progression (radiologic or not).
Contal and O’Quigley’s method was used to determine the optimal WB-MATV, WB-TLG, and WB SULmean cutoffs for prediction of survival in the development set, with these cutoffs then being tested on the validation set (21). Survival analyses were performed using the Kaplan–Meier method and the Cox proportional hazards model to estimate the hazard ratio (HR) with 95% confidence intervals (CIs). A log-rank test was then performed to compare OS between groups. In the multivariate Cox model, the following variables were considered for association with OS: WB-MATV, WB-TLG, age, sex, BMI, ECOG PS, number of years between diagnosis and inclusion in the respective trial, KRAS mutation status, medication (sorafenib vs. regorafenib), and prior use of bevacizumab. The prognostic weight for each parameter was obtained from the Cox model by dividing its estimate by the estimate in absolute value of the parameter with the smallest value. The obtained value was then rounded. P values of less than 0.05 were considered statistically significant. Interobserver agreement was assessed using the Cohen κ-statistic (22). Interobserver agreements in WB-MATV measurements, WB-TLG measurements, and segmentation thresholds were represented on Bland–Altman plots. Statistical analyses were performed using SAS, version 9.4 (SAS Institute), and Bland–Altman plots using Prism, version 7 (GraphPad Software).
RESULTS
In total, 238 mCRC patients were included in this pooled analysis: 97 from the SoMore trial and 141 from the RegARd-C trial. Seven patients from each trial were excluded for one of the following reasons: not meeting the inclusion criteria (n = 4 in SoMore and n = 3 in RegARd-C), declining to participate (n = 1 in SoMore), having a too short follow-up (4 d; n = 1 in RegARd-C), and not having a baseline WB-MATV/TLG measurement because of absence of a target lesion or a major violation of the imaging protocol (n = 2 in SoMore and n = 3 in RegARd-C). The remaining 224 patients were considered suitable for WB-MATV/TLG measurements (Fig. 1).
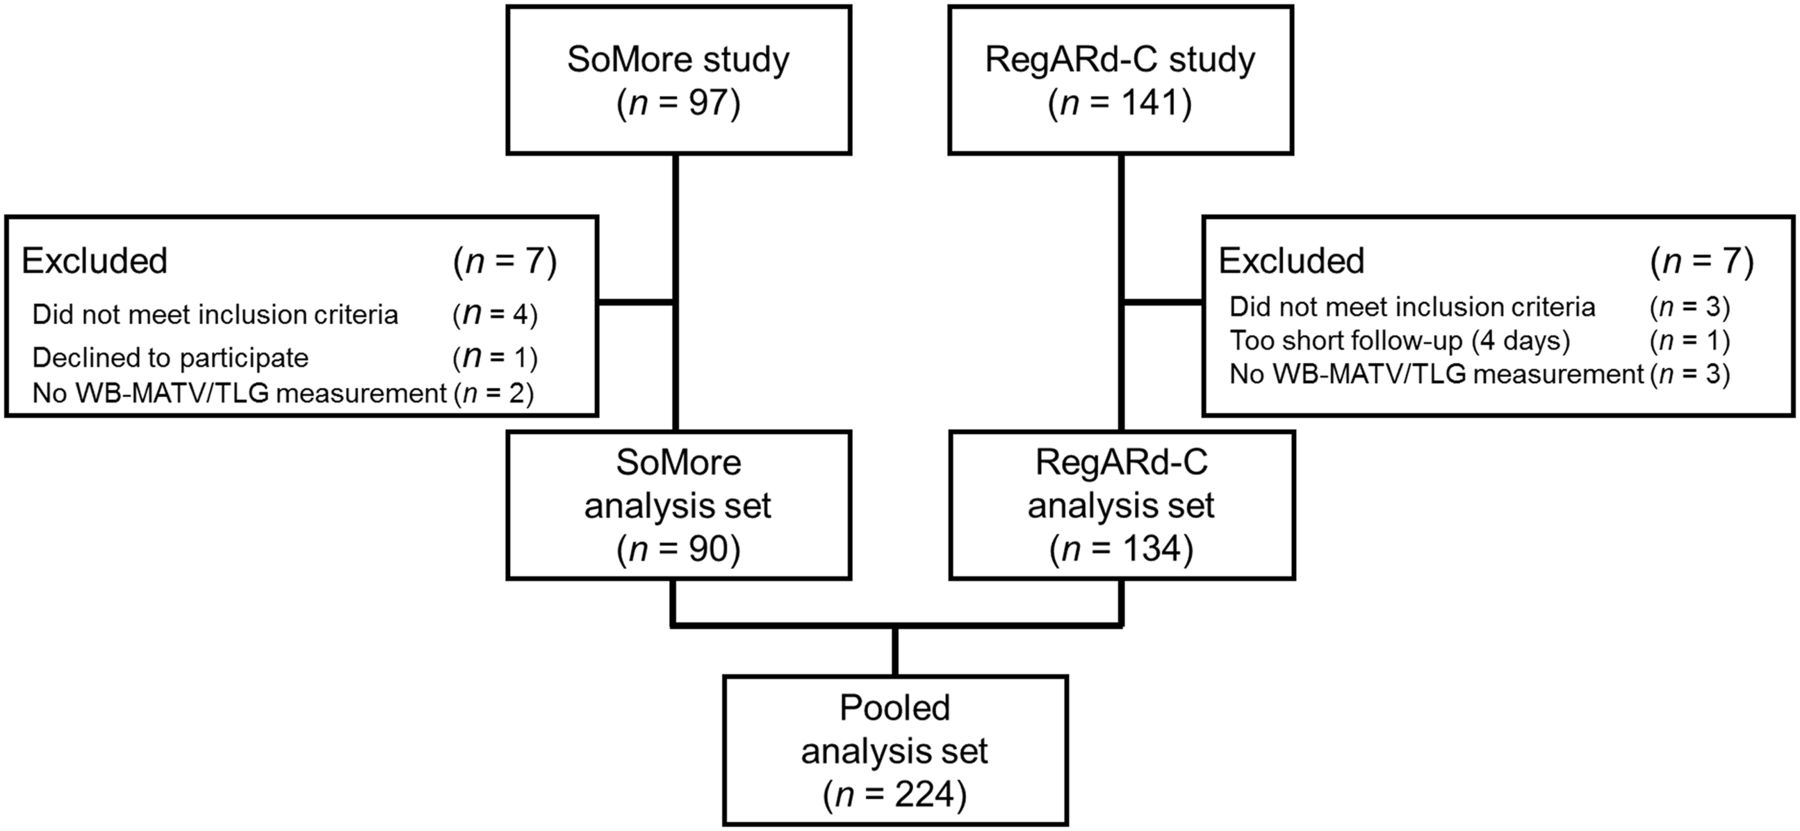
Flowchart of pooled SoMore–RegARd-C population.
The patient characteristics of the pooled population are summarized in Table 1. The survival characteristics of the pooled population, and of the development and validation sets, are summarized in Supplemental Table 1 (supplemental materials are available at http://jnm.snmjournals.org).
Baseline Patient Characteristics of Overall Population (n = 224)
Baseline WB-MATV, WB-TLG, and WB SULmean
The median baseline WB-MATV, WB-TLG, and WB SULmean in the development set were 166 cm3 (5th–95th percentiles, 11–1,524 cm3), 720 g (5th–95th percentiles, 31–7,334 g), and 4.4 g/mL (5th–95th percentiles, 3.1–6.1 g/mL), respectively. The optimal baseline WB-MATV, WB-TLG, and WB SULmean thresholds associated with OS were 100 cm3, 500 g, and 4.5 g/mL, respectively. WB-MATV and WB-TLG measurements correlated strongly, with a Spearman correlation of 0.982 (95% CI, 0.976–0.987; P < 0.001). The contingency table for WB-MATV and WB-TLG measurements after applying their respective cutoffs for categorization into low or high tumor load showed only 12 of 155 (8%) discrepancy cases in the development set (Supplemental Table 2).
The baseline WB-MATV/TLG measurements were highly reproducible between the 2 observers, with substantial overall agreement in the categorization of patients (κ = 0.80) (23). Discrepancies between categorization (low vs. high tumor load) were observed in only 4% (4/100) and 5% (5/100) of patients according to WB-MATV and WB-TLG parameters, respectively (Supplemental Table 3). Discrepancies between values were observed for 23% (23/100) of the patients, with 87% (20/23) of these discrepancies being due to differences in the selection of target lesions (including all the discrepancy cases in which the 2 observers assigned the patient to a different category), and 13% (3/23) being due to differences in the placement of the reference volume of interest. A consensus was achieved by recourse to a third reader for all these discrepancies. The Bland–Altman plots did not reveal any bias between the 2 observers in WB-MATV and WB-TLG measurements or in the calculated segmentation thresholds (Supplemental Fig. 1).
Correlation Between Baseline WB-MATV and OS
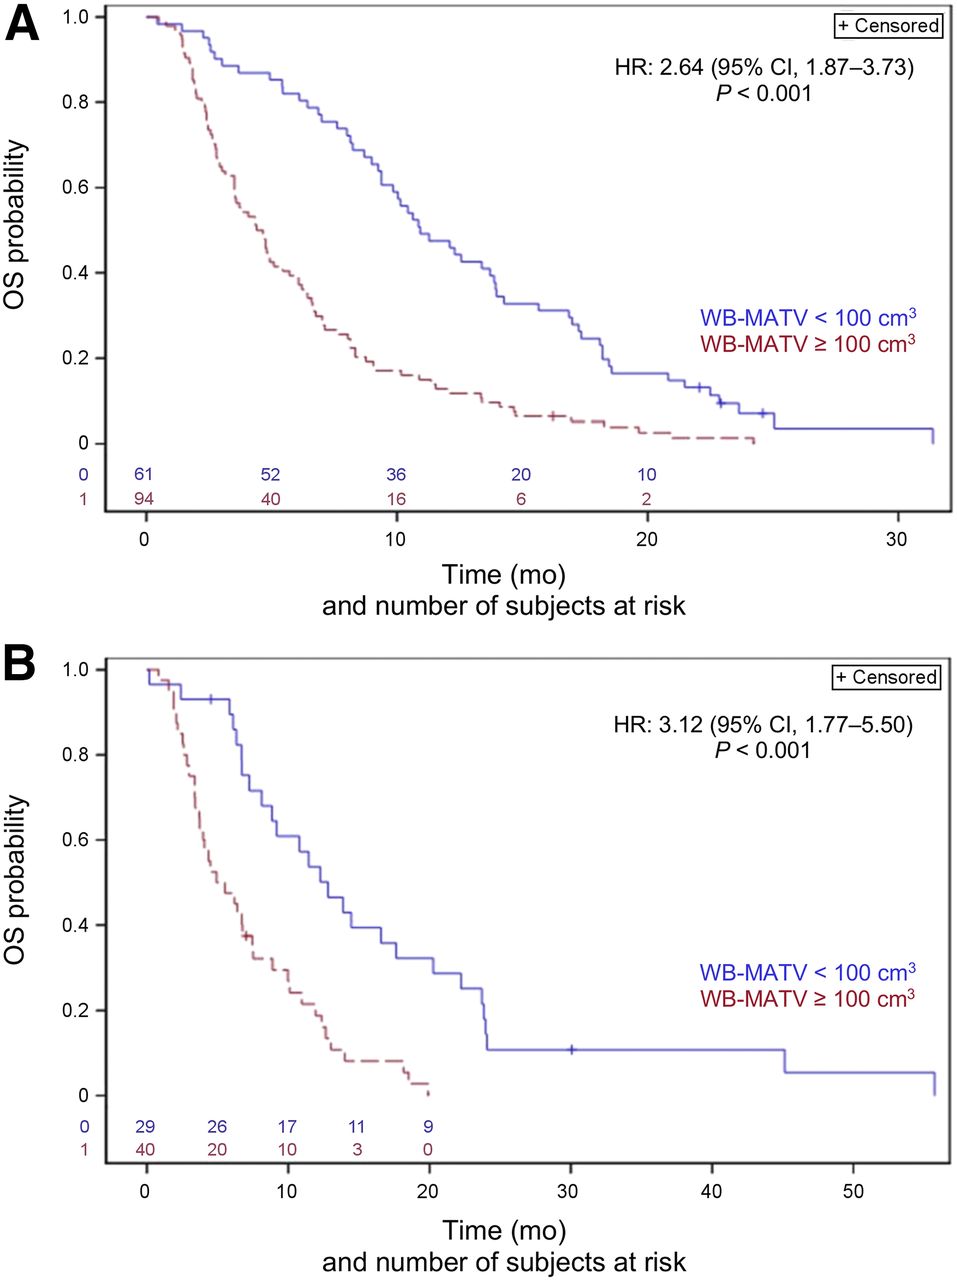
In the development set, patients with a high baseline WB-MATV (≥100 cm3) had a significantly worse outcome, with a median OS of 4.5 mo (95% CI, 3.5–5.7) versus 10.9 mo (95% CI, 9.4–13.9) for patients with a lower WB-MATV (<100 cm3) (HR WB-MATV ≥ 100 vs. < 100 cm3, 2.64; 95% CI, 1.87–3.73; P < 0.001; Fig. 2A).

OS according to baseline WB-MATV with cutoff of 100 cm3 in development set (A) and validation set (B).
These results were confirmed in the validation set: patients with a high baseline WB-MATV had a significantly worse outcome, with a median OS of 5.2 mo (95% CI, 3.7–7.5) versus 12.8 mo (95% CI, 8.1–17.6) for patients with a lower WB-MATV (HR WB-MATV ≥ 100 vs. < 100 cm3, 3.12; 95% CI, 1.77–5.50; P < 0.001; Fig. 2B). Examples of patients with a low and a high baseline WB-MATV/TLG are shown in Figure 3.

Patients with low (A) and high (B) baseline WB-MATV and WB-TLG according to cutoffs of 100 cm3 and 500 g, respectively. At top are PET maximum-intensity projections, and at bottom are coronal PET/CT images with delineation of lesions (blue contours). WB-MATV and TLG were 94 cm3 and 486 g, respectively (below cutoffs for MATV and TLG), for patient A and 147 cm3 and 559 g (above both cutoffs), respectively, for patient B. Liver lesions (arrowheads) for both patients and retroperitoneal lymph nodes (arrow) for patient A were identified as target lesions and were considered for WB-MATV and TLG measurements.
Correlation Between Baseline WB-TLG and OS
In the development set, patients with a high baseline WB-TLG (≥500 g) had a significantly worse outcome, with a median OS of 4.7 mo (95% CI, 3.5–5.7) versus 10.5 mo (95% CI, 8.7–13.4) for patients with a lower WB-TLG (<500 g) (HR WB-TLG ≥ 500 vs. < 500 g, 2.16; 95% CI, 1.54–3.02; P < 0.001; Fig. 4A).
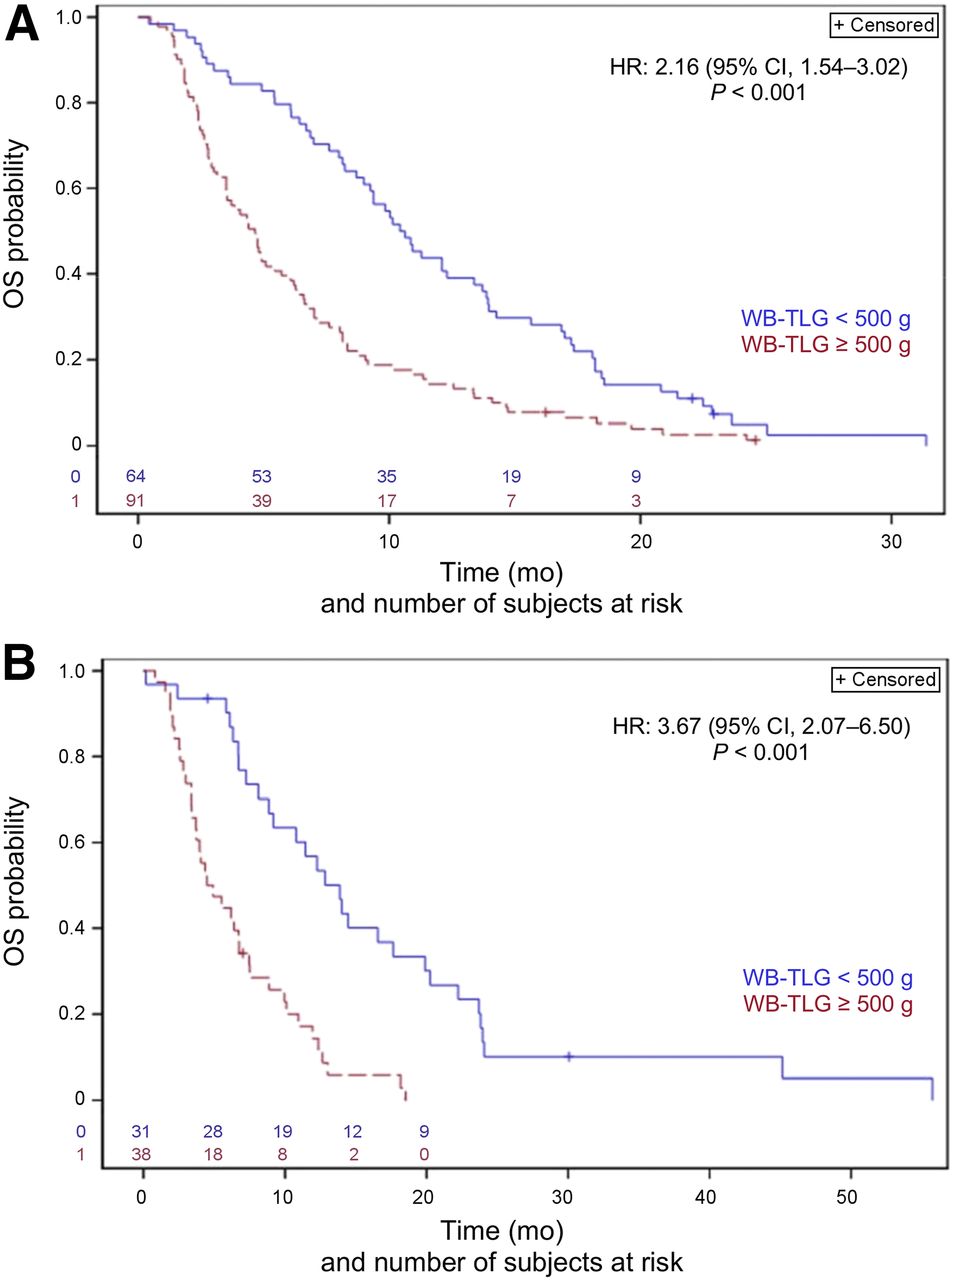
OS according to baseline WB-TLG with cutoff of 500 g in development set (A) and validation set (B).
These results were confirmed in the validation set: patients with a high baseline WB-TLG had a significantly worse outcome, with a median OS of 4.7 mo (95% CI, 3.4–6.8) versus 13.9 mo (95% CI, 8.9–19.9) for patients with a lower WB-TLG (HR WB-TLG ≥ 500 vs. < 500 g, 3.67; 95% CI, 2.07–6.50; P < 0.001; Fig. 4B).
Correlation Between Baseline WB SULmean and OS
No statistically significant correlation was found between baseline WB SULmean and OS in the development set (HR WB SULmean ≥ 4.5 vs. < 4.5 g/mL, 0.89; 95% CI, 0.65–1.24; P = 0.50). Therefore, this parameter was not evaluated in the validation set, nor was it included in the multivariate analyses.
Identification of Independent Predictors of OS Among the PET and Clinical Parameters
The multivariate analysis identified high baseline WB-MATV as a significant independent predictor of OS (HR, 2.46; P < 0.001), together with the following clinical parameters: number of years since diagnosis (HR, 0.86 per 1-y increase; P < 0.001), ECOG PS 1 (HR, 1.67; P = 0.003), and BMI of 25 or more (HR, 0.56; P < 0.001). The prognostic weights of the parameters were 6, −1, 3, and −4, respectively (Table 2).
Independent Predictors of OS with Baseline WB-MATV Included in Multivariate Analysis Along with Commonly Used Clinical Factors
Similarly, the multivariate analysis performed with WB-TLG also showed that high baseline WB-TLG was a significant independent predictor of OS (HR, 2.23; P < 0.001), together with the same clinical parameters as for WB-MATV: number of years since diagnosis (HR, 0.86 per 1-y increase; P < 0.001), ECOG PS 1 (HR, 1.81; P < 0.001), and BMI of 25 or more (HR, 0.53; P < 0.001). The prognostic weights of the parameters were 5, −1, 4, and −4, respectively (Table 3).
Independent Predictors of OS with Baseline WB-TLG Included in Multivariate Analysis Along with Commonly Used Clinical Factors
DISCUSSION
In this pooled analysis of 2 prospective multicenter studies investigating a large cohort of chemorefractory mCRC patients, baseline WB-MATV and WB-TLG were validated as robust pretreatment predictors of OS. Patients with a high WB-MATV or WB-TLG (≥100 cm3 or ≥500 g, respectively) had a significantly worse clinical outcome than patients with a low WB-MATV or WB-TLG.
To the best of our knowledge, neither the WB-MATV nor the WB-TLG parameter has been validated as a prognostic biomarker in mCRC patients. The TLG parameter was recently investigated alongside other metabolic parameters in an exploratory cohort of 40 mCRC patients treated with regorafenib (15). Patients with a TLG40% (TLG with a segmented threshold fixed at 40% of the lesion’s SUVmax investigated on one or several target lesions) lower than the median TLG40% value had a significantly longer median OS (14.2 mo) than patients with a TLG40% above the median (9.1 mo) (15). These results are in complete accordance with our findings for both the WB-MATV and the WB-TLG parameters investigated in our development and validation cohorts.
In this study, the WB-MATV and WB-TLG parameters were strongly consistent for categorizing patients into high or low tumor load according to their respective cutoffs. Only a few discrepancy cases were found in the development set (8%). These cases occurred when the WB-MATV or WB-TLG value was close to the cutoff. Because multivariate analyses showed that the prognostic weight for WB-MATV was slightly higher than that for WB-TLG (6 vs. 5), we recommend choosing WB-MATV in cases of such a discrepancy.
The WB-MATV and WB-TLG parameters also did not have any clinically relevant difference in terms of outcome prediction. The difference between these 2 volume PET-based parameters is the inclusion of the SUVmean in the TLG formula. The SULmean parameter investigated in our study did not show any statistical association with OS. Therefore, in our study, the MATV component of the TLG formula had a dominant impact on the prognostic value of the TLG parameter. However, this does not mean that the 18F-FDG uptake intensity of the lesions, whether expressed as SUVmean or SULmean, has no prognostic importance. Because of our chosen methodology for the selection of target lesions, lesions with a low 18F-FDG uptake (below the PERCIST-based segmenting threshold) were not considered as target lesions and therefore did not contribute to the WB-MATV/TLG. Therefore, it can only be concluded that differences in 18F-FDG uptake intensity were not significantly related to outcome within the selected target lesions, all of which showed intense 18F-FDG uptake.
The WB-MATV and WB-TLG parameters were analyzed among well-known clinical prognostic factors in mCRC, and both were identified as strong independent predictors of OS, with a significantly higher prognostic weight than the clinical factors. Unlike most of the currently accepted non–tumor-specific prognostic factors in mCRC, such as BMI and ECOG PS, all of which primarily represent the general medical condition of the patient, the WB-MATV and WB-TLG parameters represent the viable and aggressive tumor load and thus are less influenced by non-tumoral factors.
These prognostic biomarkers accurately identify patients with a high or low risk of shorter OS and could be particularly useful for determining the optimal therapeutic strategy. In daily clinical practice, knowledge of the estimated prognosis provides an opportunity for the oncologist and patient to reconsider the current risk–benefit balance before initiating a novel line of therapy, especially because available therapeutic agents such as multikinase inhibitors are associated with a high toxicity and limited efficacy (24,25).
In this study, several factors were taken into consideration to allow the most precise and reliable WB-MATV/TLG measurements. To minimize the inclusion of false-positive non-tumoral (e.g., inflammatory) lesions, which would lead to overestimation of tumor load, the observers were selected for their experience in interpreting oncologic 18F-FDG PET/CT images. For the selection of target lesions, observers were recommended to be more specific than sensitive, excluding all hypermetabolic lesions of uncertain origin. A fixed threshold for tumor delineation was determined for each patient based on the patient’s background blood-pool or liver 18F-FDG activity, according to the PERCIST methodology, and not a threshold of 41% of the lesion SUVmax as recommended by the European Association of Nuclear Medicine (18). Such a fixed threshold relative to background applied to every target lesion of a patient limits overestimation of the tumor volume in cases of low or moderately active lesions. This thresholding method also renders the delineation process easier to use in cases of multiple metastases.
In terms of interobserver variability, this analysis showed very good agreement on WB-MATV/TLG measurements (κ = 0.80) in a large subset of patients (n = 100). The 2 observers assigned patients to a different category in 4% and 5% of cases for WB-MATV and WB-TLG, respectively. The Bland–Altman plots revealed no systemic bias in the WB-MATV and WB-TLG measurements. Discrepancies in WB-MATV or WB-TLG values between the 2 observers were mainly due to random errors such as in the selection of target lesions, as illustrated in Supplemental Figure 2. The different placement of the reference volume of interest between observers was not shown to be a major cause of measurement variability (13% of our discrepancy cases between values, and no discrepancy case in the categorization of patients), as is in line with earlier reports (26,27).
Whether WB-MATV/TLG is purely prognostic or can act as a predictive biomarker for multikinase inhibitor response remains uncertain. Determining this would require a prospective trial with a treatment control arm that has similar mCRC patients not treated with multikinase inhibitors to verify whether the treatment effect is identical in both high and low WB-MATV/TLG groups. In the meantime, further ongoing analysis of the current dataset will verify whether early metabolic (with PERCIST) and late morphologic (with RECIST) response rates are related to the tumor load.
Potential limitations of this study were that WB-MATV/TLG were not validated in an independent dataset and that the pooled cohort developed for this study used the data of 2 prospective clinical trials investigating mCRC patients treated with different targeted agents (sorafenib and regorafenib). However, because the multivariate analyses did not identify the use of regorafenib versus sorafenib as an independent prognostic factor, the results of this study can reliably be extrapolated to mCRC patients treated with currently used targeted agents.
CONCLUSION
This study validated baseline WB-MATV and WB-TLG parameters as strong independent predictors of OS in a large cohort of chemorefractory mCRC patients treated with multikinase inhibitors. When compared with well-known clinical prognostic factors in mCRC, these parameters were shown to have the highest prognostic values. On this basis, we recommend the use of one of these two imaging biomarkers to define the optimal care for chemorefractory mCRC patients.
DISCLOSURE
This academic work was supported and sponsored by the Jules Bordet Institute. Bayer Healthcare AG provided sorafenib and regorafenib and a research grant for the SoMore and RegARd-C trials but played no further role in the design and conduct of the study; in collection, management, analysis, or interpretation of the data; or in preparation, review, or approval of the manuscript. No other potential conflict of interest relevant to this article was reported.
Acknowledgments
We thank all physicians who participated in patient recruitment for the SoMore and RegARd-C studies, notably, Amelie Deleporte, MD, Karen Geboes, MD, PhD, Thierry Delaunoit, MD, Gauthier Demolin, MD, Marc Peeters, MD, PhD, Lionel D’Hondt, MD, PhD, Jos Janssens, MD, Javier Carrasco, MD, Stéphane Holbrechts, MD, Jean-Charles Goeminne, MD, PhD, Jean-Luc Van Laethem, MD, PhD, and Philippe Vergauwe, MD. We thank Hugo Levillain, MSc, for his valuable advice on Bland–Altman plots. We thank all staff involved in the 9 PET/CT centers who participated in this study. Finally, we are deeply grateful to the patients and their families who agreed to participate in this project.
Footnotes
Published online Jun. 29, 2018.
- © 2019 by the Society of Nuclear Medicine and Molecular Imaging.
REFERENCES
- Received for publication February 21, 2018.
- Accepted for publication June 11, 2018.


Jump to section
Related Articles
Cited By...
- Combined Metabolically Active Tumor Volume and Early Metabolic Response Improve Outcome Prediction in Metastatic Colorectal Cancer
- Dose-Response and Dose-Toxicity Relationships for Glass 90Y Radioembolization in Patients with Liver Metastases from Colorectal Cancer
- Radiomics Features of 18F-fluorodeoxyglucose Positron-Emission Tomography as a Novel Prognostic Signature in Colorectal Cancer