


Visual Abstract

Abstract
Stratification of metastatic colorectal cancer (mCRC) patients is mostly based on clinical and biologic characteristics. This study aimed to validate the prognostic value of 18F-FDG PET/CT–based biomarkers such as baseline whole-body metabolically active tumor volume (WB-MATV) and early metabolic response (mR) in mCRC. Methods: The development cohort included chemorefractory mCRC patients enrolled in 2 prospective Belgian multicenter trials evaluating last-line treatments (multikinase inhibitors). The validation cohort included mCRC patients from an Italian center treated with chemotherapy and bevacizumab as first-line. Baseline WB-MATV was defined as the sum of metabolically active volumes of all target lesions identified on the baseline 18F-FDG PET/CT. Early mR assessment was performed following usual response criteria (response threshold of 30% [PERCIST–30%], response threshold of 15% [PERCIST–15%], European Organization for Research and Treatment of Cancer) and the so-called CONSIST method, which defines response as a decrease of SULmax ≥ 15% for all target lesions. Baseline WB-MATV and early mR assessment were investigated along with usual clinical factors and correlated with overall survival (OS) and progression-free survival (PFS). Results: Clinical factors, baseline WB-MATV, and early mR were evaluable in 192 of 239 and 94 of 125 patients of the development and validation cohorts, respectively. Except for PERCIST–30%, all response methods were equivalent in terms of outcome prediction, and CONSIST was found to be the most accurate. Baseline WB-MATV and early mR using the CONSIST method were independent prognostic parameters after adjustment for clinical factors in the development and validation sets for both OS (hazard ratio [HR] WB-MATV: 1.87 [95% CI, 1.17–2.97], P = 0.005, and HR early mR: 1.79 [95% CI, 1.08–2.95], P = 0.02 for the validation set) and PFS (HR WB-MATV: 1.94 [95% CI, 1.27–2.97], P = 0.002, and HR early mR: 1.69 [95% CI, 1.04–2.73], P = 0.03 for the validation set). Conclusion: Baseline WB-MATV and early mR are strong independent prognostic biomarkers for OS and PFS in mCRC, regardless of treatment received. Therefore, combining these biomarkers improves risk stratification for OS and PFS in mCRC.
- 18F-FDG PET/CT-based biomarkers
- metabolically active tumor volume
- early metabolic response
- metastatic colorectal cancer
Despite significant improvements over the last 15 y, patients with metastatic colorectal cancer (mCRC) still hold a poor prognosis, with a 5-y survival rate less than 15% (1). Nevertheless, survival differs significantly among patients, creating the need for prognostic biomarkers to improve patient stratification and personalized care.
Baseline whole-body metabolically active tumor volume (WB-MATV), an 18F-FDG PET–based quantitative parameter, has recently been reported by our group to be a strong independent prognostic imaging biomarker in chemorefractory mCRC, with a higher prognostic value than the usual clinical prognostic factors (2). However, these findings still required validation in mCRC patients undergoing first-line treatment.
Early metabolic response (mR) assessment using 18F-FDG PET/CT is a valuable tool for the rapid identification of patients with treatment-resistant tumors, faster than with conventional, morphology-based imaging (CT/MRI). It has also been shown to be a strong predictor of outcome in many tumor types (3,4). The high negative predictive value of early mR assessment (performed as early as after 1 treatment cycle) is a key strength of metabolic imaging, essential to avoid pursuing ineffective and potentially toxic treatments, thereby allowing a rapid and cost-effective way to reallocate societal resources toward more promising therapies (3,5). To our knowledge, no prospective validation study has been reported so far on the predictive value of early mR assessment and its independence from baseline WB-MATV and clinical prognostic factors in mCRC.
Different mR assessment criteria have been explored in many cancer types including mCRC, but until now, no consensus has been reached on which criteria are best to use and whether these different response criteria are equivalent in terms of outcome prediction (6,7).
The aims of this study were first, to validate the prognostic value of baseline WB-MATV and early mR assessment in chemonaïve mCRC patients; second, to assess whether early mR yields additional predictive value when combined with clinical factors and baseline WB-MATV; and last, to evaluate the relative predictive values of the usual mR criteria.
MATERIALS AND METHODS
Study Population
This study included mCRC patients from 3 prospective datasets. The development set was composed of 2 Belgian multicenter single-arm phase II trials: SoMore and RegARd-C, which have already been described in a previous report (2). These trials were conducted in chemorefractory mCRC patients (n = 239) treated with capecitabine/sorafenib (SoMore) or regorafenib (RegARd-C). The external validation set consisted of an Italian monocentric single-arm study. This study investigated the correlation between early mR and survival outcomes (overall survival [OS] and progression-free survival [PFS]) in chemonaïve mCRC patients (n = 125) treated with standard first-line chemotherapy combined with targeted agents (8).
Patient eligibility criteria and study design for the first 2 datasets were previously reported (9,10) but can be described shortly as follows: histologically proven colon or rectum adenocarcinoma; tumor refractory to all standard chemotherapy agents; age greater than 18 y; Eastern Cooperative Oncology Group (ECOG) performance status (PS) of 1 or less; life expectancy greater than 12 wk; a baseline (before treatment start) and an early 18F-FDG PET/CT (after 2–3 wk of therapy) with at least 1 measurable target lesion on the baseline examination; a minimum washout period of 4 wk before inclusion in the trial; and provision of signed informed consent. Eligibility criteria for the external validation set were the same except that all patients were chemonaïve.
Ethics approvals for these 3 trials were obtained from the relevant local ethical committee of each center. All procedures performed in this study involving human participants were in accordance with the ethical standards of the institutional or national research committee and the 1964 Helsinki declaration and its later amendments or comparable ethical standards.
18F-FDG PET/CT Imaging
Eight Belgian EANM Research Ltd. (EARL)–accredited and 1 Italian PET/CT centers were involved in this study, with each following strict procedural guidelines for standardization of patient preparation, scan acquisition, and image processing to ensure the most accurate and reproducible quantitative PET measurements (11,12). In brief, patients fasted 6 h before the radiotracer injection (target serum glucose ≤ 150 mg/dL). A static whole-body (skull to mid-thigh) PET scan was started 60 min (range, 55–75 min) after injection of 18F-FDG (3–4 MBq/kg), with an acquisition time of 90 s per bed position. A low-dose CT was obtained before the PET scan. All PET data were normalized and corrected for scatter and random events, attenuation, and decay.
Quality assessment for patient preparation, imaging protocols, and anonymization for central review of PET/CT images were ensured by an independent dedicated academic PET/CT imaging core lab (ORILaB). Items checked in the quality control analysis were already described in a previous report, and this quality control was applied to all 18F-FDG PET/CT scans of the current study (2). Any violation with respect to uptake time, administered dose, complete image dataset, good quality of images (high statistics suitable for diagnostic interpretation), PET/CT scans of the same patient performed on the same scanner for baseline and early time points, and time between baseline PET/CT and treatment start for all 18F-FDG PET/CT scans of this study led to the exclusion from the central review analysis. None of the nuclear medicine physicians involved in this study had access to the medical records and treatment outcomes. Those were centralized and stored in the data center. All PET measurements were computed on a dedicated workstation (Advantage Workstation; GE Healthcare) using the commercial PETVCAR software, version 4.6 (GE Healthcare).
Target lesions identified for each patient were defined as follows: unequivocal tumor origin, transverse diameter greater than 15 mm on a registered CT image, and an 18F-FDG SUV normalized to lean body mass (SUL) higher than 1.5 × the mean liver SUL + 2 × SD, or in the presence of liver metastasis, 2.0 × mean aorta SUL + 2 × SD, following PERCIST methodology (13). In the case there was no target lesion identified on the baseline PET/CT, the patient was excluded from the baseline WB-MATV and from the response analysis.
The image analysis procedure for the different PET metrics used in this study was as follows: the MATV of a lesion was defined as the volume of tumor tissue demonstrating metabolic activity at or higher than the calculated PERCIST threshold described above. Baseline WB-MATV was calculated as the sum of the MATV values of all target lesions, without a predefined limitation on their number. To minimize overestimation of WB-MATV, volume of interest for each lesion was manually placed so as to exclude both surrounding physiologic uptake and adjacent lesions’ uptake.
Different response criteria were used for the evaluation of the early mR: PERCIST with the usual threshold of 30% (PERCIST–30%), PERCIST with an adapted response threshold of 15% (PERCIST–15%), EORTC?15% (European Organization for Research and Treatment of Cancer, response threshold of 15%), and CONSIST–15% (response threshold of 15%) (5,13,14).
For all these response criteria, the early mR assessment was dichotomized into mR and metabolic nonresponder (mNR). With CONSIST methodology, a patient was classified as nonresponder when there was at least 1 target lesion not reaching an SULmax decrease of > 15% (5,15). With PERCIST and EORTC methodologies, patients who had a complete or partial mR were classified as mR, and patients who had a stable or progressive metabolic disease were classified as mNR. More details on criteria used in this study for the different mR assessment methodologies can be found in Supplemental Table 1 (supplemental materials are available at http://jnm.snmjournals.org).
All PET measurements were normalized to lean body mass except for EORTC measurements, which were normalized to body surface area as required in the guidelines (14).
Statistical Analysis
The baseline clinical characteristics and survival data were collected prospectively. For univariable analyses, survival outcomes were measured from the date of treatment start to death from any cause for OS, and to the point of tumor progression or recurrence (based on radiologic assessment according to RECIST 1.1 with either contrast‐enhanced CT or MRI, which was done at baseline and every 2 cycles [8 wk]) or death from any cause for PFS. For univariable and multivariable analyses of the early mR assessment, survival outcomes were measured from the date of the early mR assessment to death from any cause for OS and to the point of progression or recurrence (according to RECIST 1.1 evaluation, which was done every 2 cycles) or death from any cause for PFS. All patients alive or not progressing at last follow-up were censored.
As the optimal cutoff value for baseline WB-MATV was determined and validated in a recent report to be 100 cm3 in chemorefractory mCRC patients, the same cutoff was applied in the external validation set (2).
The prognostic values of the clinical and PET parameters (baseline WB-MATV and early mR) were assessed using Kaplan–Meier estimation for survival probabilities (OS and PFS), the log-rank test for comparisons of groups, and the Cox proportional hazards regression model for regression analysis to estimate the hazard ratios (HRs) with 95% CIs. In the multivariable Cox model, the following variables were considered for association with OS and PFS: age, sex, body mass index, ECOG PS, KRAS mutational status, primary tumor location (right- versus left-sided colon and rectum), baseline WB-MATV, and early mR following the response criteria as described above. BRAF mutational status was included only in the statistical analyses of the validation set because of the small number of BRAF-mutant patients remaining in last-line of treatment.
The predictive accuracy for OS and PFS of the different early mR methods was assessed by the Harrell’s c-index. P values of < 0.05 were considered statistically significant, and all tests were 2-sided. Statistical analyses were performed using SAS, version 9.4 (SAS Institute), IBM SPSS Statistics 25 (IBM Corp.), and GraphPad Prism, version 7.04 (GraphPad Software Inc.).
RESULTS
Patients
Of 239 mCRC patients included in the Belgian cohort and 125 in the Italian cohort, 224 (94%) and 109 (87%), respectively, were considered suitable for baseline WB-MATV analysis, whereas 192 (80%) and 94 (75%) patients, respectively, were retained for early mR analysis. The reasons for ineligibility are shown in the study flow diagram in Figure 1. Patient and disease characteristics are summarized in Supplemental Table 2.

Study flow diagram of development and external validation sets.
The median durations of follow-up were, respectively, 24.0 mo and 25.1 mo for the development and the validation sets. At the end of the studies of the development and external validation sets, 217 of 224 (97%) and 87 of 109 (80%) patients had died, respectively, and all patients had a progression event. Median OS and PFS for all patients eligible for analysis were 6.9 mo (95% CI, 6.2–8.1 mo) and 3.3 mo (95% CI, 2.2–3.7 mo), respectively, for the development set and 25.2 mo (range, 20.9–27.2 mo) and 9.7 mo (95% CI, 8.4–11.5 mo), respectively, for the validation set.
Baseline Clinical Factors and Patient Outcomes
Among the clinical factors, the following were found to be statistically significant for OS in the development set—ECOG PS (HR, 1.59 [1.21–2.09], P = 0.001) and body mass index (HR, 0.57 [0.43–0.76], P < 0.001)—and for OS in the validation set—BRAF mutational status (HR, 3.43 [1.11–10.54], P = 0.03) and ECOG PS (HR, 1.97 [1.06–3.69], P = 0.03).
Baseline WB-MATV
The median values for baseline WB-MATV in the development and validation sets were 164 cm3 (5th–95th percentiles, 6–1,755 cm3), and 134 cm3 (5th–95th percentiles, 6–1,426 cm3), respectively.
The median values of the number of weeks that have passed between the baseline PET to the start of treatment in the development and validation sets were 1 (range, 0–4) and 1 (range, 0–6), respectively.
Baseline WB-MATV and Patient Outcomes
In the development set, patients with a high baseline WB-MATV (≥100 cm3) had a significantly worse outcome compared with patients with a low baseline WB-MATV (<100 cm3) in terms of both median OS (4.5 mo [95% CI, 3.4–5.5] vs. 11.2 mo [95% CI, 9.4–13.9]; HR, 2.70, P < 0.001) and median PFS (1.9 mo [95% CI, 3.5–5.7] vs. 4.3 mo [95% CI, 9.4–13.9]; HR, 1.98, P < 0.001).
These results were confirmed in the validation set: patients with a high baseline WB-MATV had a significantly worse outcome compared with patients with a low baseline WB-MATV in terms of both median OS (20.9 mo [95% CI, 17.2–24.6] vs. 35.7 mo [95% CI, 22.2–49.1]; HR, 1.93, P = 0.003) and median PFS (9.1 mo [95% CI, 7.4–10.7] vs. 12.4 mo [95% CI, 9.0–15.9]; HR, 1.86, P = 0.002) (Figs. 2A and 2B and Table 1).

Kaplan–Meier estimates of OS (A) and PFS (B) according to baseline WB-MATV in development set (last-line) and validation set (first-line).
Univariable Analyses of Baseline WB-MATV and Early mR According to Different Methods for OS and PFS in Development and Validation Sets
Early mR Following Different Response Criteria and Patient Outcomes
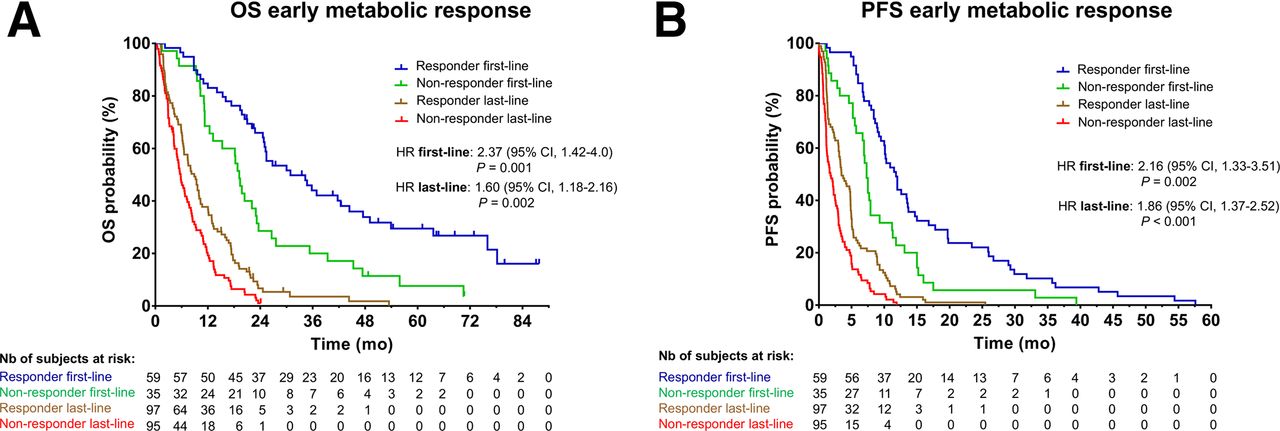
All mR methods applied at an early time point (PERCIST–15%, EORTC, and CONSIST), except for PERCIST–30%, have shown to be highly predictive of OS and PFS in both the development and the validation sets (Figs. 3A and 3B and Table 1).

Kaplan–Meier estimates of OS (A) and PFS (B) according to early mR using CONSIST method in development set (last-line) and validation set (first-line).
In terms of diagnostic performance, the early mR assessment according to the CONSIST criteria was found to be the most predictive method for both OS and PFS in the development and validation sets (Supplemental Table 3). The median values of the number of target lesions per patient evaluated with the CONSIST method in the development and validation sets were 4 (range, 1–35) and 3 (range, 1–21), respectively.
As early mR with PERCIST–30% was not found to be predictive of PFS in the development set and of OS and PFS in the validation set, this method was included only in the multivariable analyses of OS in the development set.
PET images with examples of patients showing low and high WB-MATV associated with response and nonresponse are illustrated in Figure 4. An example of a patient subject to differences in response assessment following PERCIST and EORTC methodologies is shown in Supplemental Figure 1.

Examples of PET maximum-intensity-projection images of patients at baseline and early time points with a low baseline WB-MATV (85 cm3) who respond (A), with a low baseline WB-MATV (30 cm3) who did not respond (resistant lesion shown by red arrows) (B), with a high baseline WB-MATV (2,336 cm3) who respond (C), and with a high baseline WB-MATV (1,065 cm3) who did not respond (multiple resistant lesions) (D).
Independent Predictors of OS and PFS Among PET and Clinical Parameters
After adjustment for clinical parameters, the multivariable analyses identified baseline WB-MATV as a significant independent predictor of OS (HR, 2.56 and 1.87, P < 0.001 and P = 0.005, for the development and validation sets, respectively) and PFS (HR, 2.0 and 1.94, P < 0.001 and P = 0.002) (Table 2).
Multivariable Analyses of Clinical (Age, Sex, ECOG PS, KRAS, BMI) and PET-Based Variables (Baseline WB-MATV and Early mR According to Different Methods) for OS and PFS in Development and Validation Sets
After adjustment for clinical parameters and baseline WB-MATV, early mR according to CONSIST was identified as a significant independent predictor of OS (HR, 1.55 and 1.79, P = 0.005 and P = 0.02) and PFS (HR, 1.64 and 1.69, P < 0.001 and P = 0.03) (Table 2).
Combining Baseline WB-MATV and Early mR Assessment
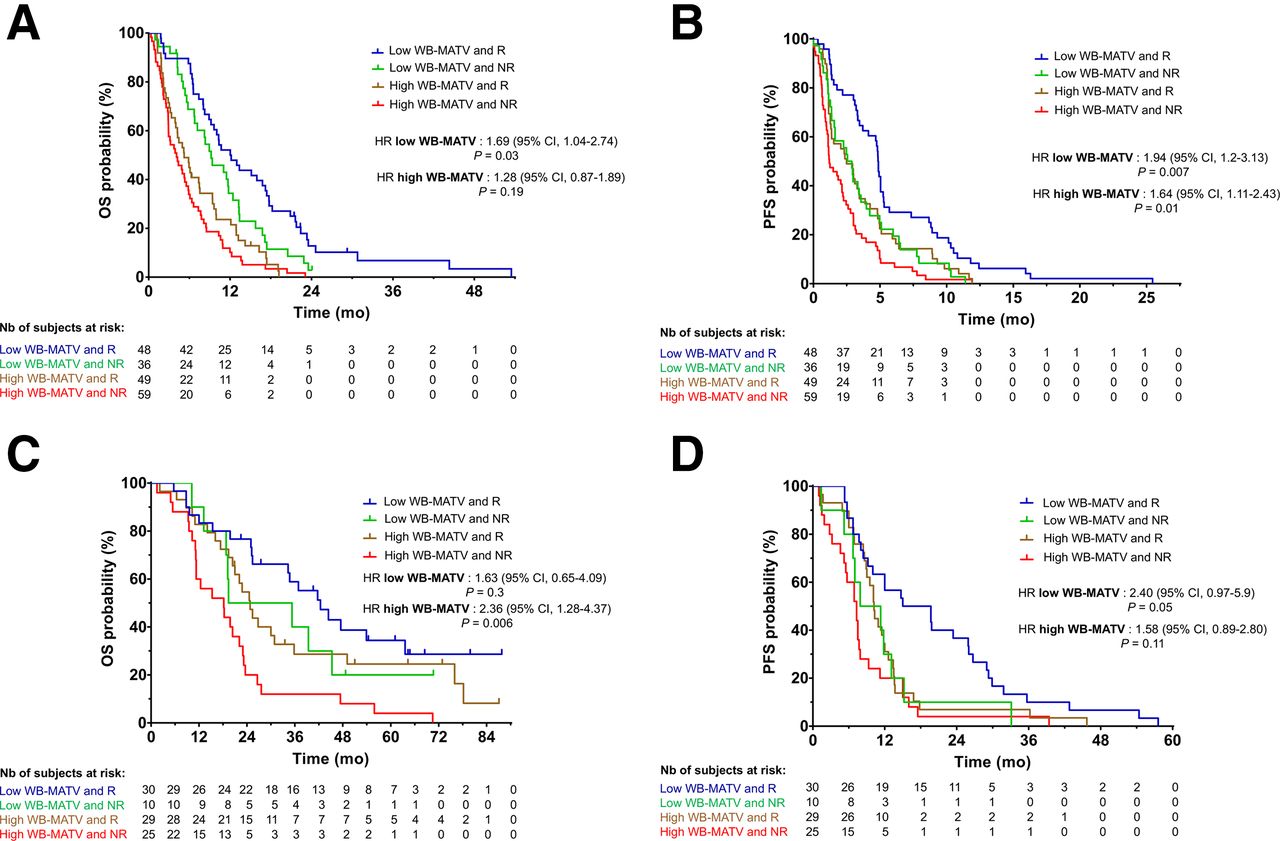
The combination of baseline WB-MATV and early mR according to CONSIST classified the patients into 4 categories. Survival graphs of these 4 risk groups in the development and validation sets for both OS and PFS are shown in Figure 5.

Kaplan–Meier estimates of OS and PFS according to baseline WB-MATV combined with early mR using CONSIST method in development set (A and B) and validation set (C and D) classifying patients into 4 risk groups.
DISCUSSION
This study is the first, to our knowledge, to prospectively validate baseline WB-MATV and early mR assessment as strong 18F-FDG PET/CT–based biomarkers in both chemonaïve (treated with standard first-line chemotherapy combined with targeted agents) and chemorefractory (treated with targeted agents) mCRC patients. This study showed that baseline WB-MATV and early mR performed after 1 treatment cycle (i.e., at 2 wk) were able to identify a subset of high-risk patients. These high-risk patients (high WB-MATV and mNRs) had a risk of experiencing disease progression or dying 3 times higher than low-risk patients (low WB-MATV and mRs). The predictive value of early mR was demonstrated to be independent of baseline WB-MATV and clinical factors in the 2 clinical settings. Moreover, combining WB-MATV and early mR allowed a better risk stratification in identifying distinct patient risk groups in first- or last-line of treatment.
Our study confirmed the added prognostic value of baseline WB-MATV beyond the usual clinical prognostic parameters for both OS and PFS in chemonaïve patients. To the best of our knowledge, this is the first report that investigated baseline WB-MATV as a prognostic biomarker in a first-line setting. Our results have shown that baseline WB-MATV is predictive of survival regardless of treatment administered and, therefore, can be considered as a pure prognostic biomarker (16).
In addition to the validation of WB-MATV as a baseline stratification factor in mCRC in a first-line setting, another important contribution of this study is that it highlighted the predictive value of early mR assessment for OS and PFS in both first- and last-line treatment settings. The predictive values of early mR in the first-line were almost the same as those obtained in the last-line setting and in line with those reported in small case series, which were conducted without clinical validation (5,6,17,18). Conversely, a few studies investigating mCRC patients reported a lack of correlation between early mR and outcomes, but those had several methodologic limitations (19,20). In particular the study of Byström et al. lacked basic conditions of imaging standardization and quality control. The results of our prospective validation study strongly contradict the conclusion made in the study of Byström et al. that “routine monitoring of mCRC patients by PET scans is not recommended due to its too limited clinical value and notably in first-line treatment setting” (19).
Several mR methods applying different criteria were also investigated in the current study. Our findings indicate that the clinical impact of using a mR method or another is minimal in terms of outcome prediction, except for PERCIST.
PERCIST–30% applied in the context of early mR assessment was not predictive of outcomes in both first- and last-line treatment settings, except for OS in last-line. Conversely, PERCIST–15% was found to be a strong predictor of outcomes in both first- and last-line treatment settings. These results suggest that the PERCIST method with the response threshold set at 30% for a response assessment usually performed after 3–4 cycles of therapy has to be adapted in an early response setting with a threshold set at 15%.
Interestingly, the CONSIST method, based on the hypothesis that treatment-resistant emergent clones are reflected by lesions that do not significantly decrease their metabolism under treatment, was shown to have the highest predictive value for OS and PFS. This method, when a response threshold of 15% was applied, was previously reported by our group to have a high negative predictive value (95%) (5). As this response threshold (15%) was also applied in this study to the adapted PERCIST–15% and EORTC and those did not demonstrate a predictive value of outcomes as high as the CONSIST method, the criteria used in this methodology could explain its higher predictive value.
Another major finding of this study in addition to the validation of baseline WB-MATV and early mR as strong predictive biomarkers independently of treatment lines is that the added predictive value of early mR when combined with WB-MATV strongly depends on the baseline tumor load and the treatment line.
In low baseline WB-MATV patients in the last-line of treatment, where OS is the most important endpoint, the combination of the 2 biomarkers has enabled the identification of 2 risk groups of patients with significantly distinct median OS: responders versus nonresponders. A trend, due to the limited number of patients included in the low WB-MATV and nonresponders group (n = 10), was also found in low baseline WB-MATV patients in the first-line of treatment for PFS, as in this setting PFS is the relevant endpoint when a treatment change may be considered. In both settings, for the group of responder patients with low baseline WB-MATV, the prognostic information provided could reinforce the oncologist’s therapeutic decisions. In the group of nonresponder patients with low baseline WB-MATV, the rapid identification of a limited number of nonresponding lesions (oligo-resistance) could lead to treatment adaptation by adding locoregional ablative treatments centered on the PET-resistant lesions. If metabolic treatment resistance is observed in most lesions, rapid shift to an alternative treatment regimen or referral to an appropriate clinical trial could be considered. In patients showing clinical or biologic signs of intolerance, the absence of a mR can be an additional argument for deciding an early treatment adaptation before radiologic progression is documented. Our findings, therefore, support the clinical use of early mR to discriminate the level of risk of low baseline WB-MATV mCRC patients across all treatment lines.
For high baseline WB-MATV patients in both treatment lines, the fact that they are responders or nonresponders does not significantly affect their outcomes. This result suggests that performing an early mR in these high-tumor-load patients is probably not useful. Several factors may explain these results. First, the low mR threshold (minimum 15% SULmax decrease) used by the CONSIST method maximizes the negative predictive value to avoid eliminating a potentially efficient treatment. This low threshold also minimizes the positive predictive value, impairing any distinction on the depth of response. Second, for high baseline WB-MATV patients, the lack of randomized control group precludes knowing whether responders have a survival benefit over untreated patients. Therefore, we can only state that performing an early mR may not be useful in these high-tumor-load patients but we should in no way extrapolate from this finding that treatments are not effective.
A potential limitation of this study is that the population of the development set was already used in a previous study assessing the prognostic value of baseline WB-MATV (population split in 2 sets for internal validation) (2).
In terms of perspectives, PET-driven treatment escalation strategies for high-risk patients, identified at an early time point, might be effective to prolong survival. Further studies would be needed to assess the impact of these adaptive treatment strategies on survival outcomes.
CONCLUSION
This study validates baseline WB-MATV and early mR as strong independent prognostic biomarkers for OS and PFS in first- and last-line mCRC treatment settings—stronger than the relevant usual clinical parameters. Combining these 2 biomarkers significantly increased the overall prognostic accuracy and allowed a better risk stratification in identifying distinct risk groups of patients with significant different median OS and PFS in first- and last-line treatment settings. Therefore, the use of these 2 biomarkers could be proposed as stratification factors in clinical trials. Their use could also be recommended in clinical oncology for risk stratification in mCRC patients.
DISCLOSURE
Francesco Sclafani was a consultant for and on the advisory board of Bayer; he received research funding from AstraZeneca, Bayer, BMS, and Roche and travel grants from Bayer and Lilly. Alain Hendlisz was a consultant for and on the advisory board of Amgen, Bayer, Eli Lilly, Merck, Pierre Fabre, Servier, and Sirtex; he received research funding from Amgen, AstraZeneca, Ipsen, Leo Pharma, Merck, Roche, Sanofi, and Teva Pharma and travel grants from Merck, Roche, and Sirtex. No other potential conflict of interest relevant to this article was reported.
KEY POINTS
QUESTION: Does early mR yield additional prognostic value compared with baseline clinical parameters and WB-MATV in mCRC patients under first- or last-line of treatment?
PERTINENT FINDINGS: This study, including 3 prospective trials (2 development and 1 external validation datasets), validates baseline WB-MATV and early mR as independent prognostic biomarkers for OS/PFS in mCRC, independently of patients’ treatment line. The added prognostic value of early mR assessment was found mostly in those patients with low baseline WB-MATV.
IMPLICATIONS FOR PATIENT CARE: Combining these 2 PET biomarkers should be implemented in future clinical trials and in clinical routine for monitoring mCRC patients under first- or last-line of treatment.
Footnotes
Published online July 29, 2021.
- © 2022 by the Society of Nuclear Medicine and Molecular Imaging.
REFERENCES
- Received for publication February 26, 2021.
- Revision received June 29, 2021.
In this issue


Jump to section
Related Articles
Cited By...
- No citing articles found.