


Abstract
The purpose of this study was to determine which method for early response evaluation with 18F-FDG PET/CT performed most optimally for the prediction of response on a later CT scan in erlotinib-treated non–small cell lung cancer patients. Methods: 18F-FDG PET/CT scans were obtained before and after 7–10 d of erlotinib treatment in 50 non–small cell lung cancer patients. The scans were evaluated using a qualitative approach and various semiquantitative methods including percentage change in SUVs, lean body mass–corrected (SUL) SULpeak, SULmax, and total lesion glycolysis (TLG). The PET parameters and their corresponding response categories were compared with the percentage change in the sum of the longest diameter in target lesions and the resulting response categories from a CT scan obtained after 9–11 wk of erlotinib treatment using receiver-operating-characteristic analysis, linear regression, and quadratic-weighted κ. Results: TLG delineation according to the PERCIST showed the strongest correlation to sum of the longest diameter (R = 0.564, P < 0.001), compared with SULmax (R = 0.298, P = 0.039) and SULpeak (R = 0.402, P = 0.005). For predicting progression on CT, receiver-operating-characteristic analysis showed area under the curves between 0.79 and 0.92, with the highest area under the curve of 0.92 (95% confidence interval [CI], 0.84–1.00) found for TLG (PERCIST). Furthermore, the use of a cutoff of 25% change in TLG (PERCIST) for both partial metabolic response and progressive metabolic disease, which is the best predictor of the CT response categories, showed a κ-value of 0.53 (95% CI, 0.31–0.75). This method identifies 41% of the later progressive diseases on CT, with no false-positives. Visual evaluation correctly categorized 50%, with a κ-value of 0.47 (95% CI, 0.24–0.70). Conclusion: TLG (PERCIST) was the optimal predictor of response on later CT scans, outperforming both SULpeak and SULmax. The use of TLG (PERCIST) with a 25% cutoff after 1–2 wk of treatment allows us to safely identify 41% of the patients who will not benefit from erlotinib and stop the treatment at this time.
Treatment with tyrosine kinase inhibitors (TKIs) has proven to be effective in non–small cell lung cancer (NSCLC) patients, with response rates of 10%–20% in unselected populations. Subgroups of patients have been identified with good and sometimes prolonged results (1–4).
At present, the selection of patients is done by detecting mutations in the epidermal growth factor receptor (EGFR) genes. EGFR mutation–positive patients (EGFR-mut) have higher response rates than EGFR wild-type (EGFR-wt) patients (5–9). However, a subgroup of EGFR-wt patients (1,5,10) also benefits from TKI treatment, suggesting that the selection of patients depending solely on mutation status will exclude some patients from a potential treatment benefit.
At our institution, erlotinib treatment is offered to nonoperable EGFR-mut, NSCLC patients as first-line treatment and to EGFR-wt patients as second- or third-line treatment. An important challenge with this treatment is how to evaluate the response, because TKIs are known to have mostly cytostatic effects (11,12) as opposed to cytotoxic effect. Therefore, a follow-up CT scan is routinely obtained 9–11 wk into the treatment for response evaluation. Considering that stage III–IV NSCLC patients in general have a short remaining life expectancy (4,13,14), it is essential to discontinue a futile treatment course as early as possible.
Preclinical studies have shown that TKI-sensitive cells downregulate their glucose uptake early after exposure to TKI treatment (1,11). Clinically 18F-FDG PET/CT performed early during TKI treatment has shown promise for predicting both anatomic response and survival (1,5,15,16), and for predicting histopathologic response (7,17).
The many methods used for response evaluation with 18F-FDG PET include visual evaluation, change in SUV corrected for body weight (SUV) for maximum-intensity voxels, and mean value in a standardized volume of 1.2-cm (in diameter) volume of interest (SUVmax and SUVpeak), as well as more complex volume-based parameters such as total lesion glycolysis (TLG) with various ways of delineating the lesions.
PERCIST 1.0 from 2009 (18) uses the SULpeak as the standard but also suggests TLG as a supplemental analysis. We have previously shown that percentage change in TLG is a promising predictor of CT response in a subgroup of EGFR-wt patients (10).
The aim of this study was therefore to identify which specific method of a selection of commonly used methods (including the PERCIST 1.0 methods) was the optimal for predicting the CT response, early during erlotinib treatment. We hypothesized that an evaluation of the total disease burden would improve response evaluation compared with single-hottest-lesion evaluation. We focused on safely selecting patients after 7–10 d of treatment, who will not have a treatment effect, enabling us to discontinue futile treatment at this early time point.
MATERIALS AND METHODS
The results are reported as according to Standards for Reporting Diagnostic Accuracy studies (STARDS) 2015.
Patients
This retrospective study evaluated 18F-FDG PET/CT scans, in compliance with the PERCIST 1.0 to ensure comparability of images, from 50 patients enrolled in prospective single-center study originally including 67 consecutive patients with stage III–IV NSCLC between April 2013 and August 2015. The study was approved by the Central Denmark Region Committee on Biomedical Research Ethics (no. 1-10-72-19-12), and subjects signed an informed consent form. The study was reported to ClinicalTrials.gov (NCT02043002). All patients were candidates for palliative erlotinib treatment. Detailed inclusion criteria were previously published (19). The selection of patients included in the present study is presented in Figure 1.

Patient selection.
All patients underwent an 18F-FDG PET/CT scan before (baseline) and 7–10 d after initiation of erlotinib treatment (follow-up). CT scans of the chest and abdomen were acquired before and after 9–11 wk of treatment, or earlier on clinical indication. Testing for EGFR mutations had been performed in all patients with adenocarcinoma as part of the routine diagnostic workup by use of the Therascreen EGFR RGQ PCR kit (QIAGEN) according to the manufacturer’s protocol, and on the basis of this, patients were categorized as either EGFR-wt or EGFR-mut.
18F-FDG PET/CT Acquisition and Evaluation
All 18F-FDG PET/CT scans were obtained on a combined PET/CT scanner (Siemens Biograph TruePoint 40; Siemens Healthcare GMbH) at the Department of Nuclear Medicine and PET-Centre, Aarhus University Hospital, Denmark, using the same scanner type and acquisition and reconstruction protocols as previously published in detail (19). In brief, all patients had a fasting period of at least 6 h, a blood glucose concentration of less than 11 mM, and an uptake time of 60 ± 10 min between injection of 5 MBq/kg ± 10% of 18F-FDG and scan start (3 min per bed position). A whole-body low-dose CT scan (50 mAS, 120 kVp) was acquired.
All 18F-FDG PET/CT scans were evaluated by 1 experienced nuclear medicine physician using Siemens Syngovia software (Siemens Healthcare GMbH). The evaluator was masked to the outcome and the result of the following CT scan. Evaluation of response was performed as visual evaluation described by Mac Manus et al. (20), considering both the overall change in 18F-FDG uptake and the appearance of new 18F-FDG–avid lesions (visual); the percentage change in SULpeak in the lesion with the highest uptake at baseline and follow-up (not necessarily the same lesion) (SULpeak) according to PERCIST 1.0 (18); and the percentage change in global TLG with various delineation methods: at SULmean + 2 SDs in a spheric 3-cm region of interest in the right lobe of the liver (SULmean [liver]) (TLG [PERCIST]) and at 30% (TLG 30), 40% (TLG 40), and 50% (TLG 50) of SULmax. A lesion was considered evaluable for all semiquantitative methods if SULpeak was 1.5 × SULmean (liver) + 2 SDs. Delineation was performed semiautomatically after a manual rough outlining of each lesion, resulting in an SULmean and a metabolic tumor volume for the delineated area. TLG for each lesion was calculated as SULmean × metabolic tumor volume. Global TLG was the sum of all measurable lesions TLGs.
All the methods allocated patients into 4 different response categories: progressive metabolic disease (PMD), stable metabolic disease (SMD), partial metabolic response (PMR), and complete metabolic response. When the classification methods were used, for SULpeak all patients were categorized as PMD, if new lesions had appeared, independent of SULpeak. This was not the case for the TLG categories, because any new lesion was included in the TLG calculations, if measurable. Multiple cutoffs for these response categories were tested. An overview of the methods is presented in Supplemental Table 1 (supplemental materials are available at http://jnm.snmjournals.org). SULmax was measured for comparison but not used for classification into response categories.
CT Evaluation
The radiologic response was evaluated by 1 experienced radiologist on the first CT scan obtained after initiation of erlotinib according to the RECIST (version 1.1). Response evaluation included reporting of percentage change in the sum of the longest diameter (SLD) and the resulting response categories: progressive disease (PD), stable disease, partial response (PR), and complete response. We chose to dichotomize into PD versus non-PD (stable disease + PR) when appropriate, because this is used as the basis criteria to decide whether to continue or discontinue erlotinib treatment.
Statistical Analysis
Comparison of SULpeak, SULmax, and the TLGs to the SLD was performed using linear regression analysis; a significance level of 0.008 (Bonferroni adjustment for 6 methods) was used.
The predictive accuracy of SULpeak, SULmax, and the TLGs was evaluated by receiver-operating-characteristic (ROC) analyses, predicting PD versus non-PD on CT. The optimal cutoff, considering sensitivity and specificity equally important, was identified by visually locating the data point nearest the top left corner on the ROC curve.
To compare the 18F-FDG PET response categories with the CT response categories, quadratic weighted κ-analyses were performed (21). As many patients as practically possible were included; a power calculation was not performed.
Statistical analyses were performed with SPSS statistics for Macintosh (version 23.0; IBM SPSS Statistics).
RESULTS
Scan Times and Standardization Parameters
The time between scans and treatment start is presented in Table 1. The indication for an early CT scan was in all cases suspected clinical progression. Ten patients showed PD and 4 stable disease; the 4 scanned earlier than 4 wk all showed PD on CT and PMD on 18F-FDG PET/CT (TLG [PERCIST (25%)]). Data on injected 18F-FDG activity, glucose level, and uptake time on population basis are presented in Table 2. A full description of glucose, uptake time, and injected 18F-FDG activity is available in Supplemental Table 2.
Time (Days) Between Scans and First Day of Treatment
Compliance with PERCIST 1.0 Standardization Criteria
All patients were analyzable by visual evaluation and SULpeak (and SULmax), whereas the TLG measurements were not feasible to perform in 3–7 patients depending on the delineation method. When the PERCIST delineation method was used, 3 patients were not analyzable: in one patient because of an uptake at follow-up close to the background level; another patient had myriads of small 18F-FDG–avid lesions; and the last patient showed intense, diffuse uptake in the lung tissue impairing delineation of the tumor. TLG (50, 40, and 30) showed in total a further 4 nonevaluable patients because of relatively low uptake or proximity to the liver (higher background level). For 2 patients, SLD was not available (nonmeasurable lesions). None of the patients was classified as complete responders on either CT or 18F-FDG PET/CT.
Comparing of SULpeak, SULmax, and TLGs with SLD
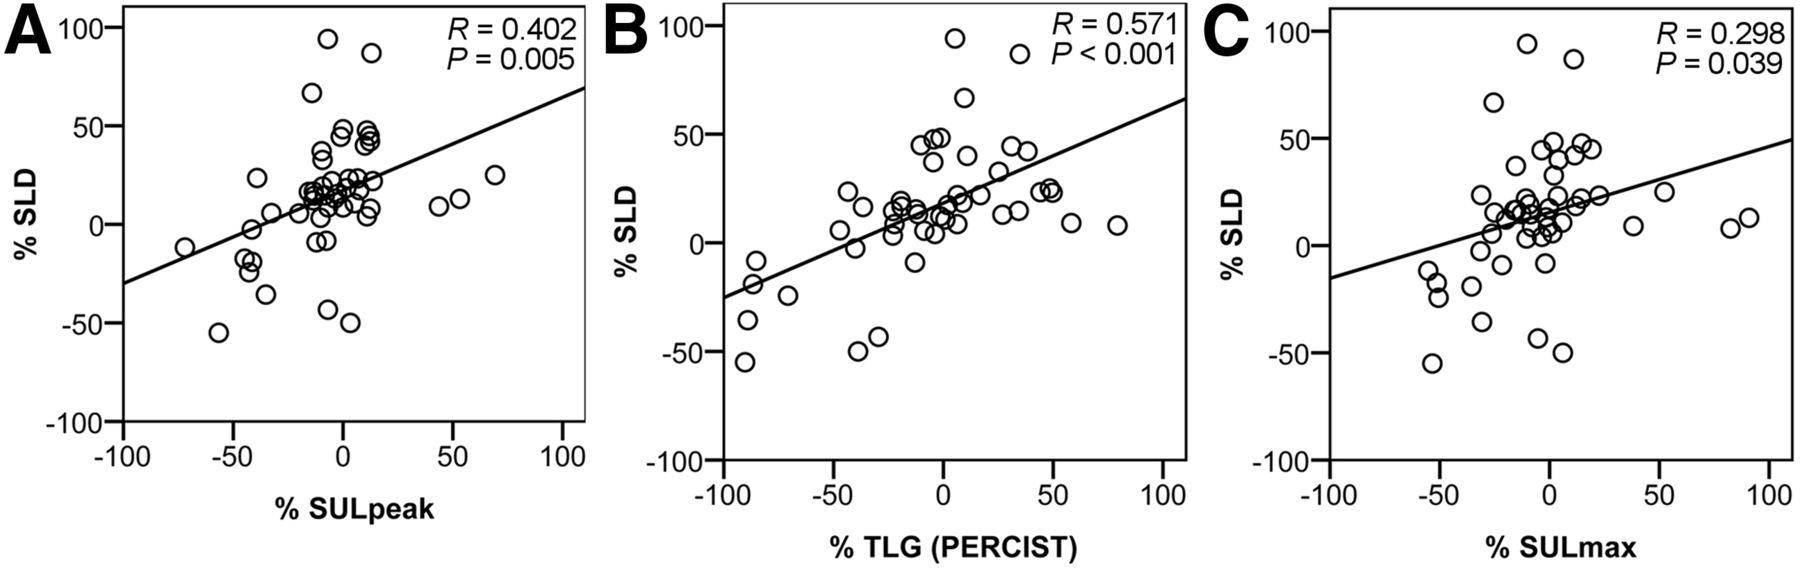
We found that all the measured parameters except SULmax were significantly correlated to SLD, but TLG (PERCIST) showed the strongest correlation with an R of 0.571 (P < 0.001). Plots for SULpeak, TLG (PERCIST), and SULmax are presented in Figure 2; all variables are available in Supplemental Figure 1.

Correlation between SULpeak (A), TLG (PERCIST) (B), and SULmax (C) at 7–10 d and SLD measured on CT scans performed after 9–11 wk.
Dichotomizing the CT response into progression (PD) and non-PD resulted in 28 PD and 22 non-PD patients. For the PET methods involving a continuous variable, the ROC curves for the 43 patients analyzed by all methods are presented in Figure 3. As can be seen, TLG (PERCIST) has the highest AUC of 0.923 (95% confidence interval [CI], 0.840–1.00) (Table 3), although the confidence intervals overlap between methods. TLG (30) had the lowest AUC of 0.790 (95% CI, 0.698–0.949).
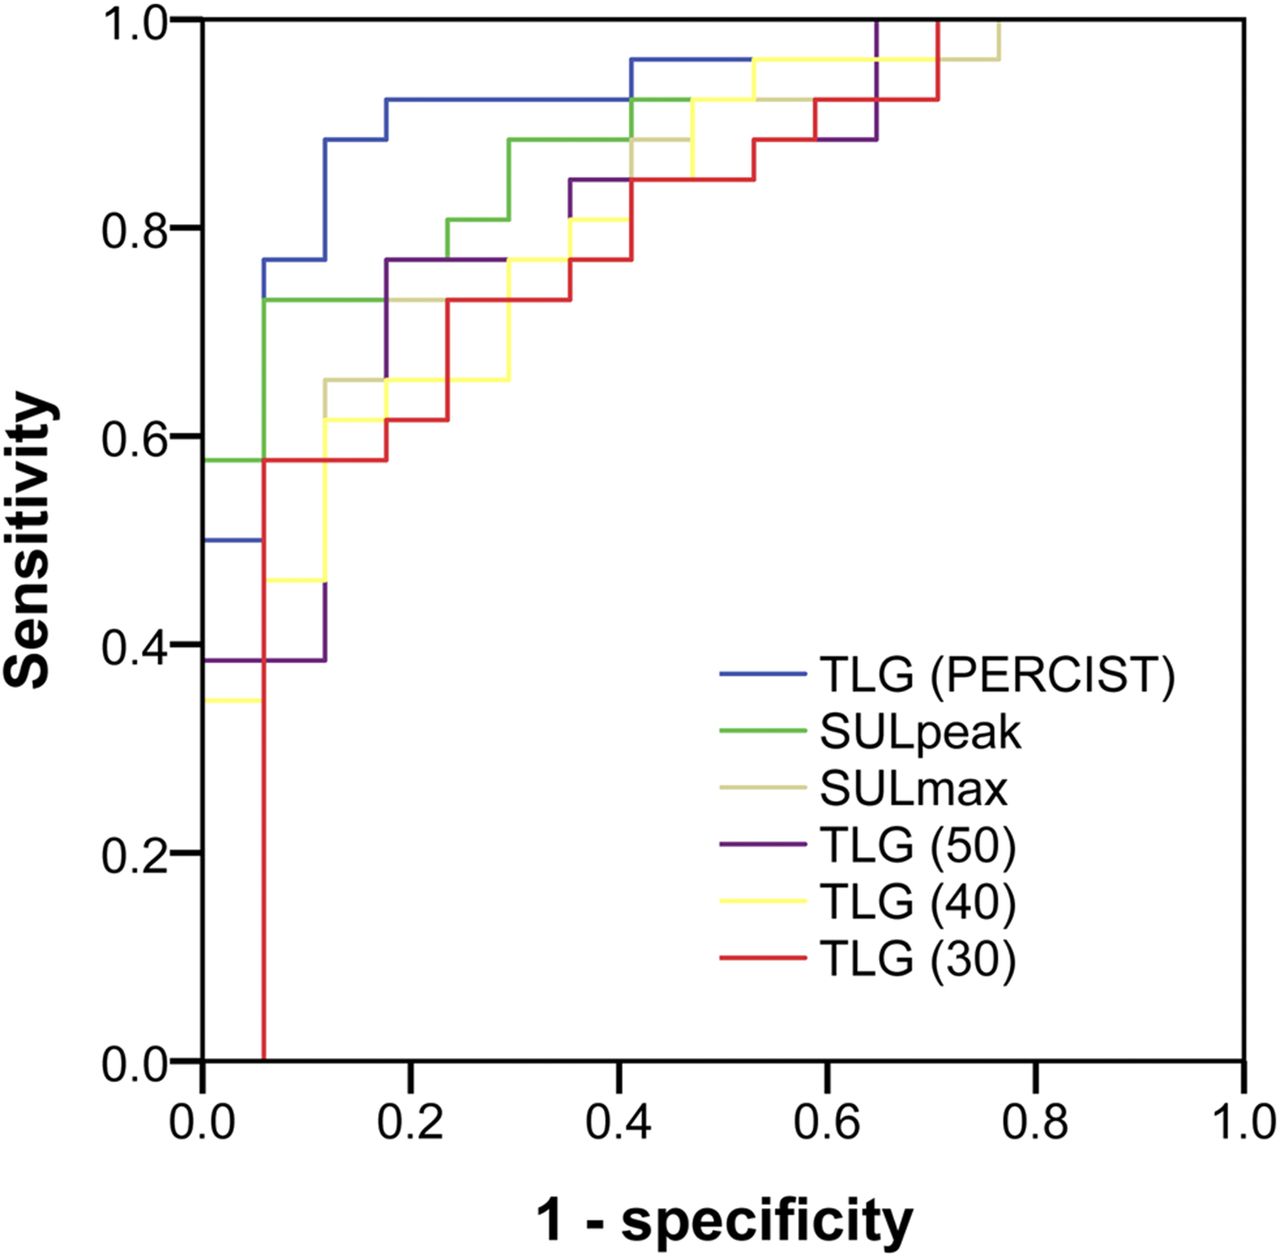
ROC curves for SULpeak, SULmax, and various TLG variations. Curves illustrate parameters’ ability to predict PD on later CT scan obtained after 9–11 wk of treatment. Curves represent data from 43 patients who were analyzable by all methods.
AUCs and Sensitivity and Specificity from ROC Analyses
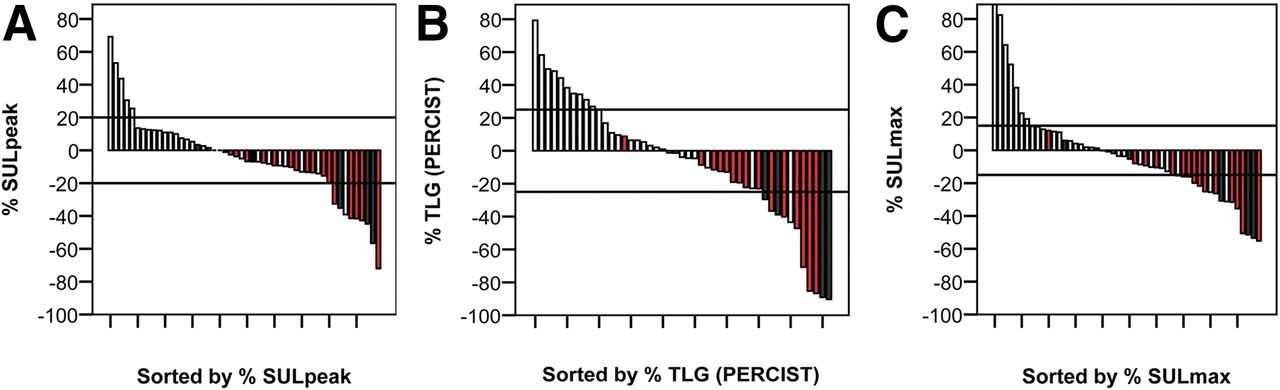
The highest sensitivity and specificity for predicting PD on CT when considering the sensitivity and the specificity equally important (sensitivity of 0.89 and specificity of 0.88) was seen for TLG (PERCIST). For a specificity of 1.00, the sensitivity for TLG (PERCIST) was 0.50, whereas SULpeak had a slightly higher sensitivity of 0.58. Again, TLG (30) showed the lowest values. Interestingly, SULpeak identified more anatomic responders than TLG (PERCIST), but fewer anatomic progressions, as shown in Figure 4. Plots for SULmax and TLG (30–50) are found in Supplemental Figure 2.

Waterfall plots for SULpeak (A), TLG (PERCIST) (B), and SULmax (C) showing distribution of CT categories (light gray = PD, red = SD, and black = PR). Horizontal reference lines represent optimal cutoff for PMR and PMD. For SULmax, the horizontal reference lines represent 15% change suggested by European Organisation for Research and Treatment of Cancer criteria for early evaluation.
Metabolic Response Categories Compared with RECIST
TLG (PERCIST [25%]) resulted in correct classification in 25 of 47 patients (53%) according to the CT response. One patient was classified more than 1 level different (early PMR and later PD on CT). Noticeably, all of the PMDs identified were classified as PD on later CT scans, identifying 11 of 27 PDs (41%). Even though SULpeak provided the highest sensitivity at a specificity of 1 in the ROC analysis and all patients were analyzable by this method, it only identified 23 of 50 patients correctly (46%) when the response categories for the optimal cutoff (20%) were used. The visual method identified 25 of 50 patients correctly (50%), and both SULpeak and visual found one (the same patient) more than 1 level different, possibly because of bone flare. The results for TLG (PERCIST [25%]), SULpeak (20%), and visual evaluation are presented in Table 4.
TLG (PERCIST [25%]), SULpeak (20%), and Visual Response Compared with RECIST 1.1
In general, the κ-values were rather low, ranging from 0.23 to 0.53, presented in Table 5. The method with the highest value 0.53 (95% CI, 0.31–0.75) was TLG (PERCIST [25%]).
κ-Values for All Methods
Dichotomizing the 18F-FDG PET classification into PMD and non-PMD (PMR + SMD) for comparison to the similar dichotomization for CT (PD vs. non-PD) resulted for TLG (PERCIST [25%]) in a sensitivity of 0.41, a specificity of 1.00, a positive predictive value of 1.00, and a negative predictive value of 0.56. For the SULpeak (20%), a slightly lower sensitivity of 0.29, a specificity of 1.00, a positive predictive value of 1.00, and a negative predictive value of 0.52 were found. The categorization tables, sensitivity, specificity, and predictive values for all methods are presented in Supplemental Table 3.
DISCUSSION
This study was performed to identify which PET assessment method was the most optimal for predicting the later CT response early during erlotinib treatment in unselected NSCLC patients. Early assessment of progression would enable discontinuation of nonbeneficial treatment after a few days of treatment (7–10 d).
The main result of this study was that TLG (PERCIST) had the strongest correlation to SLD, statistically significant even when applying a significance level of 0.008. It was the best predictor of PD versus non-PD on CT, though the difference between methods was not statistically significant. A 25% change was the optimal cutoff and avoided false PMDs. It performed better than the PERCIST-suggested 75% increase and 45% decrease, possibly because of the early time point for evaluation.
There are many assessment methods for evaluating the treatment response with 18F-FDG PET/CT. The most commonly used parameter is SUVmax, but SULpeak is also frequently used, especially because this was recommended as the standard method in the PERCIST 1.0 from 2009 (18) and is also recommended for response evaluation in the latest European guidelines, together with the mentioning of the increasing interest of TLG (22). However, few studies have compared the performance of these methods simultaneously.
Previously, a comparison of 6 different parameters including SUVpeak, SUVmax, and SUVmean using different delineation methods was performed for residual activity after 1 wk of erlotinib treatment (23). In this study, SUVs other than SUVmax were not superior at predicting progression on CT but they did not consider the percentage change; moreover, they did not include TLG.
In another study including 34 erlotinib-treated patients, it was demonstrated that percentage change in SUVpeak after 1 wk of treatment was predictive of PD versus non-PD on CT after 6 wk of treatment (5). However, there was no comparison to changes in TLG or other parameters.
Moon et al. compared SUVmax, SUVpeak, and TLG in 52 stage IV NSCLC patients before and after 4 cycles of platinum-based chemotherapy (24); consistent with the results of the present study, they found that change in TLG was a predictor of progression-free survival whereas change in SUVpeak and SUVmax were not, thus supporting our finding that TLG outperforms SULpeak and SULmax.
We found that a 25% change in TLG separated the response categories better than the 45%/75% cutoff from PERCIST 1.0. This is consistent with previous findings by Kahraman et al. demonstrating that a cutoff between 20% and 30% change is superior for predicting progression-free survival (25). Our results suggest that the same is true for predicting PD/non-PD on CT. When using 25% change in TLG (PERCIST), we still identified a large group of SMD patients who later showed PD on CT. To reduce the size of this category, we could use the ROC-determined cutoff value of 9.2% increase (or 10%), which reduced this group from 15 to 12. However, because the cutoff values are determined from the data one must expect the estimated sensitivity and specificity to be too optimistic, and the day-to-day variation (26–28) should also be considered. Taking this into account, we prefer to use the 25% cutoff.
The visual evaluation method performed well and was comparable to the more sensitive of the semiquantitative methods, SULpeak and TLG (PERCIST). We have previously demonstrated in a chemotherapy-treated population of locally advanced NSCLC patients that there is a strong interobserver agreement for this method, but the agreement is stronger for SULpeak change; however, TLG was not included in that study (29). This suggests that visual evaluation is a reliable alternative method for evaluation of the cases that are nonevaluable with the TLG methods.
The strengths of the present study are the strict adherence to standardization as according to PERCIST and the head-on comparison of 6 different methods for evaluating response, including the PERCIST 1.0 recommendations and the analysis on categorization using various cutoff levels, not only dichotomizing by ROC optimization.
The main limitation is the large variation in the interval between treatment and CT scans both at baseline and at follow-up. We find the variation in the time intervals for 18F-FDG PET/CT scans acceptable, and comparable to other studies (5). The early progressions on CT within 4 wk after initiating treatment were considered true progressions and as such should not significantly influence the PET results. The 5 cases of prolonged interval (>4 wk) between the baseline CT and treatment would potentially attenuate the CT response and thereby increase the risk for PET to show a better response than reflected on CT, but in 4 of the 5 cases TLG (PERCIST [25%]) agreed with the CT response. For a comparison of methods, we consider it usable because it applies to all methods. However, it needs closer attention in the future, because standardization is particularly important in the early response evaluation setting.
CONCLUSION
The present study demonstrates that using percentage change in global TLG delineated according to PERCIST tends to be a more sensitive method for early response evaluation of NSCLC patients during erlotinib treatment than highest intensity lesion evaluation (SULpeak) and visual evaluation. The method allows for prediction of a later PD on CT identifying 41% of the PDs. We intend to use this finding in future studies and in the clinical setting, supplementing with visual evaluation in the few cases not evaluable by the TLG method.
DISCLOSURE
No potential conflict of interest relevant to this article was reported.
Footnotes
Published online May 10, 2017.
- © 2017 by the Society of Nuclear Medicine and Molecular Imaging.
REFERENCES
- Received for publication March 20, 2017.
- Accepted for publication April 25, 2017.


