


Abstract
The microPET Focus is the latest generation microPET system dedicated to high-resolution animal imaging and incorporates several changes to enhance its performance. This study evaluated the basic performance of the scanner and compared it with the Primate (P4) and Rodent (R4) models. Methods: The system consists of 168 lutetium oxyorthosilicate (LSO) detectors arranged in 4 contiguous rings, with a 25.8-cm diameter and a 7.6-cm axial length. Each detector consists of a 12 × 12 LSO crystal array of 1.51 × 1.51 × 10.00 mm3 elements. The scintillation light is transmitted to position-sensitive photomultiplier tubes via optical fiber bundles. The system was evaluated for its energy and spatial resolutions, sensitivity, and noise equivalent counting rate. Phantoms and animals of varying sizes were scanned to evaluate its imaging capability. Results: The energy resolution averages 18.5% for the entire system. Reconstructed image resolution is 1.3-mm full width at half maximum (FWHM) at the center of field of view (CFOV) and remains under 2 mm FWHM within the central 5-cm-diameter FOV in all 3 dimensions. The absolute sensitivity of the system is 3.4% at the CFOV for an energy window of 250–750 keV and a timing window of 10 ns. The noise equivalent counting-rate performance reaches 645 kcps for a mouse-size phantom using 250- to 750-keV and 6-ns settings. Emission images of a micro-Derenzo phantom demonstrate the improvement in image resolution compared with previous models. Animal studies exhibit the capability of the system in studying disease models using mouse, rat, and nonhuman primates. Conclusion: The Focus has significantly improved performance over the previous models in all areas evaluated. This system represents the state-of-the-art scintillator-based animal PET scanner currently available and is expected to advance the potential of small animal PET.
Recent advances in small animal imaging have provided new ways to perform biologic research. These nondestructive, in vivo imaging techniques permit longitudinal studies of the same animals over an extended period of time. With individual animals serving as their own control, the number of animals required for a study can be significantly reduced while the intersubject variability is minimized. Animal models may be studied with higher accuracy in less time, providing critical advantages for biomedical research and pharmaceutical development (1). Among the myriad of imaging techniques, PET provides quantitative measurements of the spatial and temporal distributions of radiolabeled molecules within living subjects. Its ability to track trace amounts of molecules within small animals offers tremendous opportunities for researchers to study normal development of biologic systems, initiation and progression of disease states, gene expression, and the pharmacokinetics or pharmacodynamics of new drugs (2,3).
Advancements in molecular biology have made genetically modified mice the animal of choice to study models of human disease. By inserting or knocking out specific genes, these transgenic mice exhibit phenotypes that are susceptible or immune to human disease. Individual risk factors can be studied to establish disease correlation as well as to develop new treatments. To better study laboratory mice using PET, researchers continue to develop new techniques to improve the performance of animal scanners, with particular emphasis on the image resolution and system sensitivity (4–15).
The microPET Focus is the latest generation of commercial microPET scanner from Concorde Microsystems, Inc. This system incorporates several changes in design that significantly improve its performance compared with previous models (16,17). This work presents an investigation into the improvement in technology and performance of the Focus system compared with the previous microPET systems.
MATERIALS AND METHODS
System Description
The Focus inherits the fundamental design and geometry of its predecessor, P4 (Primate model), with particular efforts devoted to the redesign of detector modules and pulse processing electronics. The system consists of 168 lutetium oxyorthosilicate (LSO) detectors arranged in 4 contiguous rings with a ring diameter of 25.8 cm and an axial extent of 7.6 cm. Each detector consists of a 12 × 12 array of LSO crystal elements coupled to a position-sensitive photomultiplier tube via an optical fiber bundle. Each LSO crystal measures 1.51 × 1.51 × 10.00 mm3. Thin reflective material envelops the LSO crystals on all, but one, sides to improve the light collection efficiency and to provide better optical isolation between adjacent elements. The crystal pitch is 1.59 mm in both axial and transverse directions, resulting in a packing fraction of over 91% for a detector block.
The fiber optic bundle consists of 8 × 8 elements of square, multiclad plastic fibers each measuring 2.2 × 2.2 × 100.0 mm3. The same reflective material is also placed between individual fibers to provide optical isolation and to improve light collection efficiency. The use of optical fibers of cross-section greater than that of the LSO elements improves the light collection efficiency. These design changes were critical for good energy resolution as the LSO crystals have a relatively small cross-section that limits the light collection efficiency (18,19).
The position-sensitive photomultiplier tube continues to be the Hamamatsu R5900-C12. A simple resistor network was used to convert the 12 anode outputs to 4 position-encoded signals (20). These 4 signals are fed into the pulse processing circuits and subsequently sent to the coincidence processor for coincidence determination. To improve the linearity of the analog-to-digital converters, each event is digitized twice and averaged for event positioning and energy determination. The new electronics doubles the data transfer speed and effectively doubles the counting capability of the system under high counting rate situations.
The system acquires data in list mode to permit maximum flexibility in the postprocessing and reconstruction. Coincidence events can be sorted into 3-dimensional (3D) sinograms with different combinations of span and ring differences (21) or directly into 2-dimensional (2D) sinograms by single-slice rebinning (SSRB) (22). Images can be reconstructed using filtered backprojection (FBP) or ordered-subsets expectation maximization (23) (OSEM) algorithms.
The system is equipped with a point source rotating mechanism that is used to acquire a normalization scan for system calibration and transmission scans for attenuation correction. The horizontal and vertical motion of the animal bed is computer controlled, and there is a laser-positioning marker. The animal port has an opening of 22 cm to accommodate laboratory primates. The system occupies a small footprint (130 × 140 cm2) and comes on casters so that it can be easily moved between laboratories. Table 1 summarizes the system parameters of the Focus scanner as well as the previous microPET systems for comparison.
Specifications of microPET Systems
Energy Resolution
The system was set to acquire data in singles mode with its energy window wide open (153–814 keV). A 68Ge point source was placed at the center of the field of view (CFOV) to acquire a 2D position histogram of each detector. Lookup tables that map locations in the flood images into crystal identifications in LSO arrays were created using system software. The same 68Ge source was used to acquire 500 million events (∼20,000 per crystal element) that were sorted by pulse height and crystal identification to provide energy spectra of individual crystals. The energy resolution, defined as the full width at half maximum (FWHM) of the photopeak divided by the energy corresponding to the center of photopeak, was determined for each crystal in the system and the average energy resolution was calculated.
Spatial Resolution
All spatial resolution measurements were acquired with an energy window of 250–750 keV and a timing window of 6 ns using a 22Na point source with a nominal size of 0.5 mm, embedded in a Lucite disk (North American Scientific). 22Na has emission energy (Eaveβ+ = 250 keV) and positron range (∼0.23 mm) similar to 18F, the most widely used positron-emitting isotope. Results of the spatial resolution measurements were not corrected for source dimension, positron range, or acolinearity of positron annihilation.
The point source was attached to the animal bed, positioned at the CFOV, and moved radially toward the edge of the gantry opening in steps. List mode data at each location were sorted into 3D sinograms with the delayed events subtracted from the prompt events to correct for the random coincidences, followed by normalization to compensate for the differences in detection efficiency. The corrected 3D sinograms were Fourier rebinned (FORE) (24) to form 2D sinograms and subsequently reconstructed using 2D FBP with a ramp filter cutoff at the Nyquist frequency and a 10× image zoom. Tangential and radial resolutions were estimated from the horizontal and vertical profiles through the pixel with maximum intensity. Axial resolution was estimated from oversampled axial profiles by interleaving 4 measurements with the source stepped along the axial direction with a step size of 0.2 mm. The FWHM and full width at tenth maximum (FWTM) were measured from the extracted profiles by linear interpolation between 2 nearest pixels bracketing the half-values and one-tenth values, respectively.
Sensitivity
The absolute sensitivity of the camera was measured using a 68Ge point source encapsulated in a stainless steel sleeve. All positrons emanating from the source were assumed to annihilate in the surrounding metallic sleeve. The activity of the point source was 1.52 MBq (41 μCi) directly measured in a dose calibrator (Capintec CRC-10). The system was set to coincidence mode with an energy window of 250–750 keV and a timing window of 6 ns. The source was stepped across the entire axial FOV in 4-mm steps. At each axial location, the source was first positioned at the center of the transverse plane and then stepped toward the edge of the gantry opening in 4-mm steps, data were acquired for 60 s, and true coincidence events were sorted into 2D sinograms. The number of true coincidences was normalized to the scan duration (60 s), divided by the source activity, and corrected for the branching ratio (0.89) of 68Ge. Attenuation of the stainless steel casing was not compensated for as the activity was referenced to the dose calibrator measurement. The results were plotted against the source locations to obtain the system sensitivity profile as a function of the axial and transverse locations. The same experiment was repeated under 2 other system conditions, 250–750 keV with 10 ns and 350–650 keV with 6 ns.
Counting Rate Performance
The counting rate performance of a PET system depends on the source distribution as well as the object dimension. Since the size of animals can vary drastically in different types of studies, counting rate performance was evaluated using phantoms that simulate the geometries of a mouse, a rat, and a monkey, the most commonly studied animals in our laboratory. The design of the phantoms was based on the National Electrical Manufacturers Association (NEMA) NU2-2001 Performance Measurements of Positron Emission Tomographs (25), with the phantom dimension scaled down to reflect the relative difference in object size between human and animal. Although these phantoms are an oversimplified representation of real source distributions in animals, they do cover the extreme distributions where most activity is within the imaging FOV (in a mouse study) and most activity is outside the imaging FOV (as in a monkey study).
All 3 phantoms were solid cylinders made of high-density (0.96 g/cm3) polyethylene. The mouse-like phantom was 3 cm in diameter and 7-cm long with a 3-mm hole drilled along the entire length at a radial offset of 0.75 cm from its central axis. The rat-like phantom was similarly constructed but 6 cm in diameter and 15 cm in length, and the hole was drilled at a 1.5-cm offset from the central axis. The monkey-like phantom was 10.1 cm in diameter and 40 cm in length and had a 4.8-mm-diameter hole drilled at 2.5-cm offset from the central axis. The activity was enclosed in glass tubing to have the exact same length as the respective phantoms.
For each phantom experiment, the corresponding line source was filled with >296 MBq (8 mCi) of 11C before insertion into the phantom. The phantoms were centered in the tomograph and data were collected every 2–3 min for 200 min (10 half-lives) at 2 energy windows (250–750 and 350–650 keV) and 2 coincidence timing windows (6 and 10 ns). The SSRB algorithm was used to sort the list mode data into 2D sinograms. The random coincidences were measured by the delayed window technique.
The noise equivalent count (NEC) was calculated using the following formula (26):
 Eq. 1 where T is the number of true coincidences (including the scattered coincidences) calculated from the number of prompts minus the number of delayed coincidences, α is the fraction of the object in the FOV, and Sf is the fraction of events included in the trues due to scatter.
Imaging Studies
All emission studies were collected in coincidence mode using 250- to 750-keV energy and 6-ns timing window. Random coincidences were subtracted and the detector efficiencies were normalized. List mode data were sorted into 3D sinograms with a span of 3 and a maximum ring difference of 47, followed by the FORE algorithm before the reconstruction using 2D FBP. The filter used was a ramp filter cutoff at the Nyquist frequency, unless otherwise specified.
Phantom Studies.
A custom-made, micro-Derenzo hot rod phantom was scanned in the Focus and the R4 (Rodent model) to visualize the improvement in image resolution. The phantom has an inner diameter of 32 mm and contains fillable hot rods of different sizes (0.80, 1.00, 1.25, 1.50, 2.00, and 2.50 mm) arranged into 6 segments. The spacing between adjacent rods in each segment is twice the rod diameter. The length of the rods is 25 mm. The phantom was filled with 18.5 MBq (0.5 mCi) of 18F-FDG and scanned for 20 min in each scanner.
Animal Studies.
An 18.7-g mouse was positioned in the gantry with its head centered in the FOV. A catheter was inserted into the jugular vein through which 17.8 MBq (0.48 mCi) of 2β-11C-carbomethoxy-3β-(4-fluorophenyl)tropane (11C-CFT) (27), in a specific activity >37 MBq/nmol (28), were injected. List mode data were acquired for 120 min and sorted into 35 dynamic frames before the images were reconstructed.
A 363-g Sprague–Dawley rat was injected with 35.7 MBq (0.97 mCi) of 18F-FDG via tail vein and 110 min was allowed for uptake before the rat was positioned in the scanner. Pediatric pads of an electrocardiogram-monitoring device, AccuSync 71 (AccuSync Medical Research Corp.), were connected to the paws of the rat. The AccuSyncs’s standard transistor–transistor logic pulses were fed into the “Gating Input” of the Focus so that the trigger time would be inserted into the list mode data stream. The data were subsequently sorted into eight 3D sinograms representing 8 gates of the cardiac cycle. The images were reconstructed with a zoom of 3 using the OSEM algorithm. The same list mode data were also sorted into a single 3D sinogram without the gating option and reconstructed with the same parameters.
A 5.4-kg macaque monkey was positioned in the scanner with its brain centered in the FOV. The scanner was set up in singles mode using a 460- to 560-keV energy and 6-ns coincidence timing window. A 52-min transmission scan was acquired using a 68Ge point source. Immediately after the start of a 120-min dynamic scan, 166 MBq (4.5 mCi) of 6-18F-fluoro-l-dopa (18F-FDOPA) (29,30) were injected intravenously. List mode data of the emission scan were sorted into 31 dynamic frames. The transmission data were sorted using the SSRB algorithm and reconstructed with a Hanning filter cutoff at 50% of the Nyquist frequency. The choice of the Hanning filter over a ramp filter is 2-fold: to avoid amplification of statistical noise typically seen in transmission studies, and the resolution requirement for transmission images is not as high as that for emission images. Regions of interests were drawn on the transmission images to calculate the calibration factor that will scale down the linear attenuation coefficient of soft tissues to 0.095 cm−1. The calibrated transmission images were forward projected to form 2D sinograms followed by inverse Fourier rebinning to generate a 3D attenuation correction file. The emission sinograms were normalized, corrected for attenuation and scatter (31), and reconstructed using FORE and 2D FBP.
All animal experiments were conducted in compliance with the Guidelines for the Care and Use of Research Animals established by the Animal Studies Committee at Washington University School of Medicine in St. Louis.
RESULTS
Energy Resolution
Energy resolution of the 511-keV photopeak averages 18.5% for the entire system (24,192 LSO crystals). Compared with the previously reported 26% (16) and 23% (17) for the microPET P4 and R4, the energy resolution of the Focus is significantly improved despite its smaller crystal dimension.
Spatial Resolution
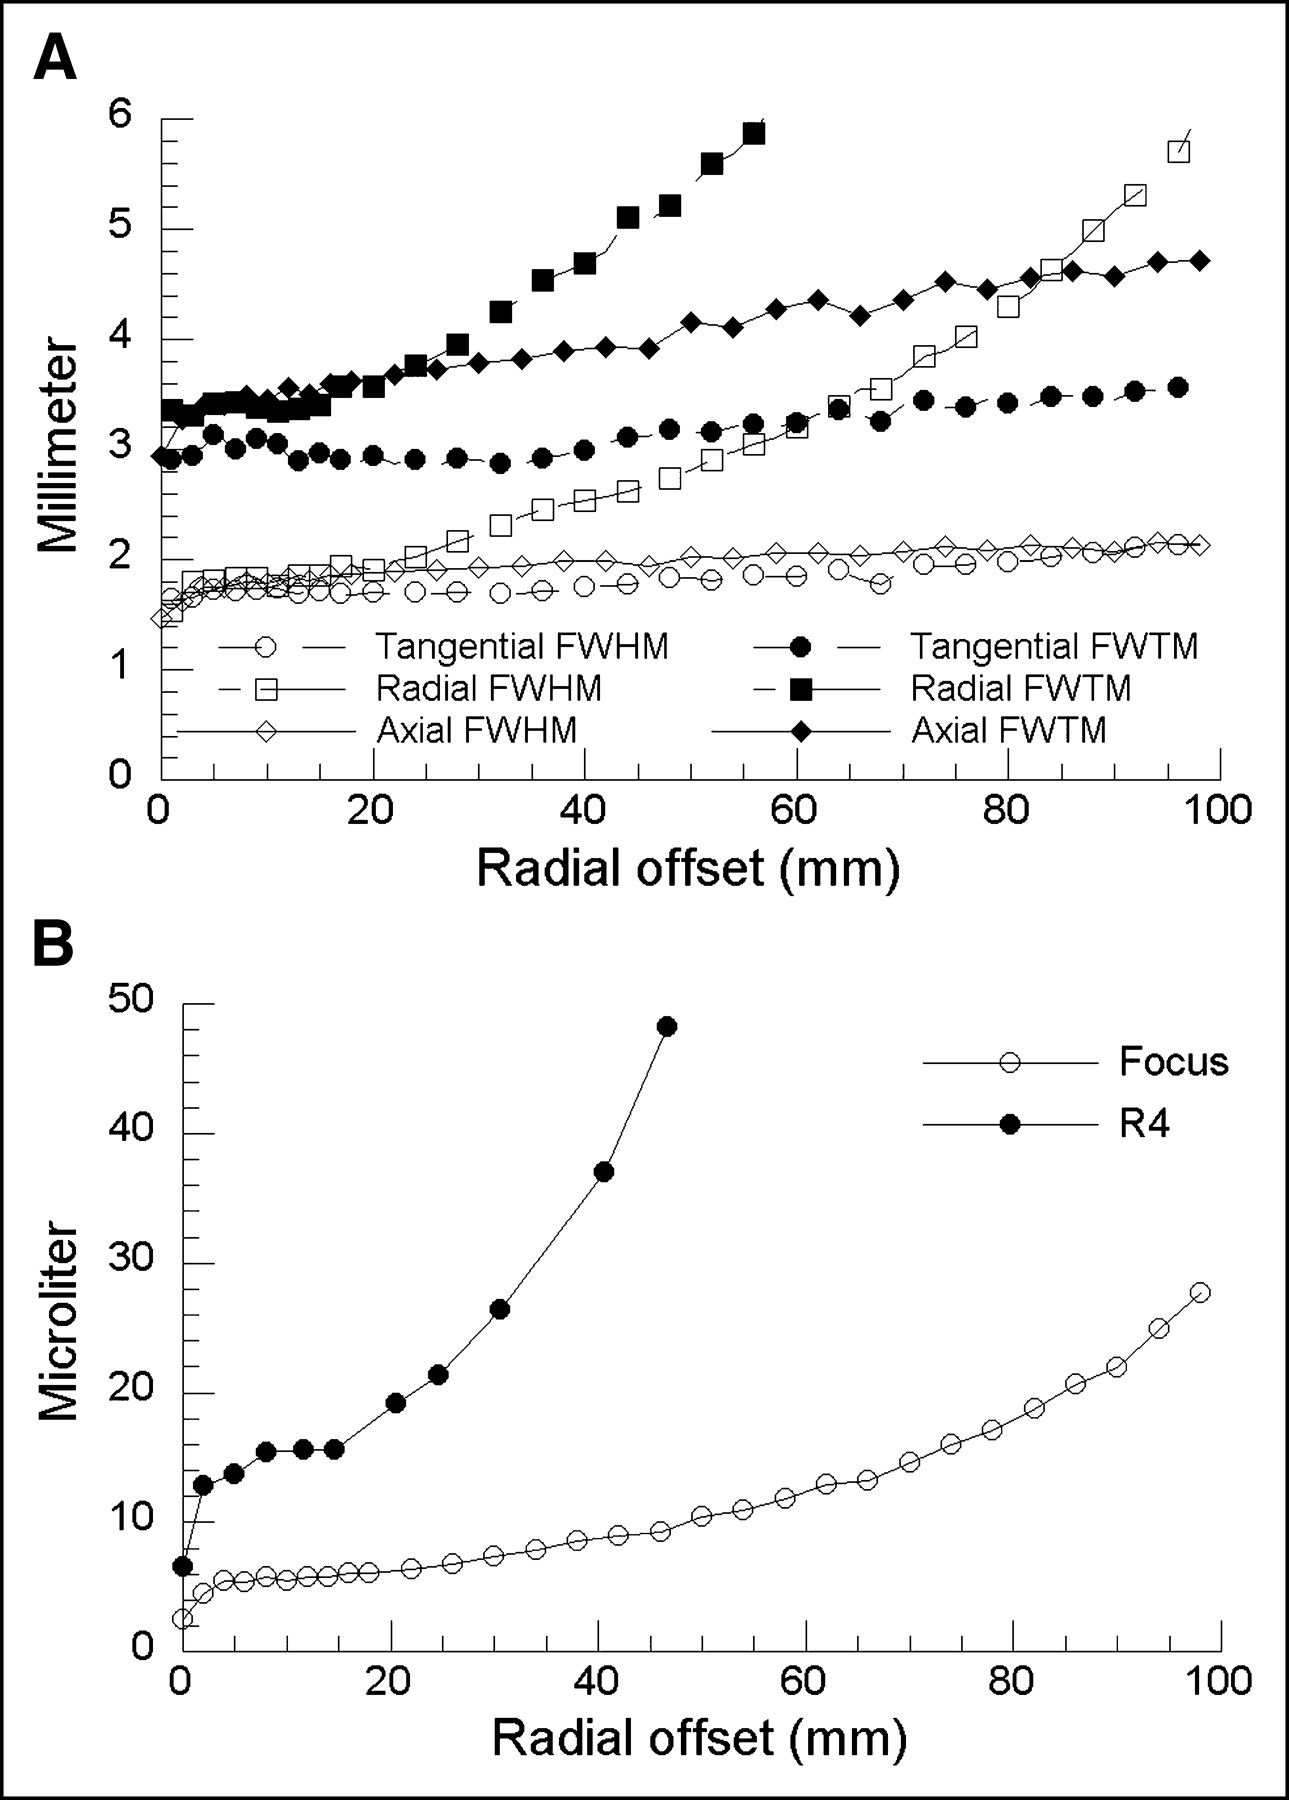
Figure 1A shows the radial, tangential, and axial components of the reconstructed image resolution. At the CFOV, the image resolution is 1.30-mm FWHM for both radial and tangential directions and 1.46-mm FWHM for the axial direction. All 3 components remain well under 1.80-mm FWHM within 1.0-cm radial offset (2-cm FOV). The tangential component remains below 1.86-mm FWHM throughout the central imaging FOV up to a radial offset of 60 mm. The axial component remains below 2.06-mm FWHM up to a radial offset of 60 mm. The radial component increases at a higher rate, due to depth of interaction effects, to 1.90-, 2.53-, and 3.21-mm FWHM at 20-, 40-, and 60-mm radial offsets, respectively. Volumetric resolution, defined as the product of all 3 image resolution components of a system, is shown in Figure 1B and compared with that of the R4. The improvement of the Focus over the R4 ranges from 2.6-fold at the CFOV (2.5 μL vs. 6.6 μL) to 3-fold at 2-cm radial offset (6.3 μL vs. 19.2 μL). At 60-mm radial offset, the Focus still has a volumetric resolution of 12.3 μL, which is better than the volumetric resolution of the R4 everywhere except at the very center.

Reconstructed image resolution of microPET Focus system as function of radial offset from CFOV. (A) FWHM and FWTM of radial, tangential, and axial image resolutions were calculated by linear extrapolation of corresponding profiles extracted from point source images. (B) Volumetric resolution of the Focus compared with the R4.
Sensitivity
The sensitivity of the system as a function of transaxial and axial locations has a profile resembling a horse saddle shape, as reported previously (32). Changing the system energy and timing windows from 250–750 keV and 10 ns to 250–750 keV and 6 ns and, finally, to 350–650 keV and 6 ns, a drop in the peak absolute system sensitivity at the CFOV is seen: 3.4% to 3.0% to 2.1%, respectively.
Counting Rate Performance
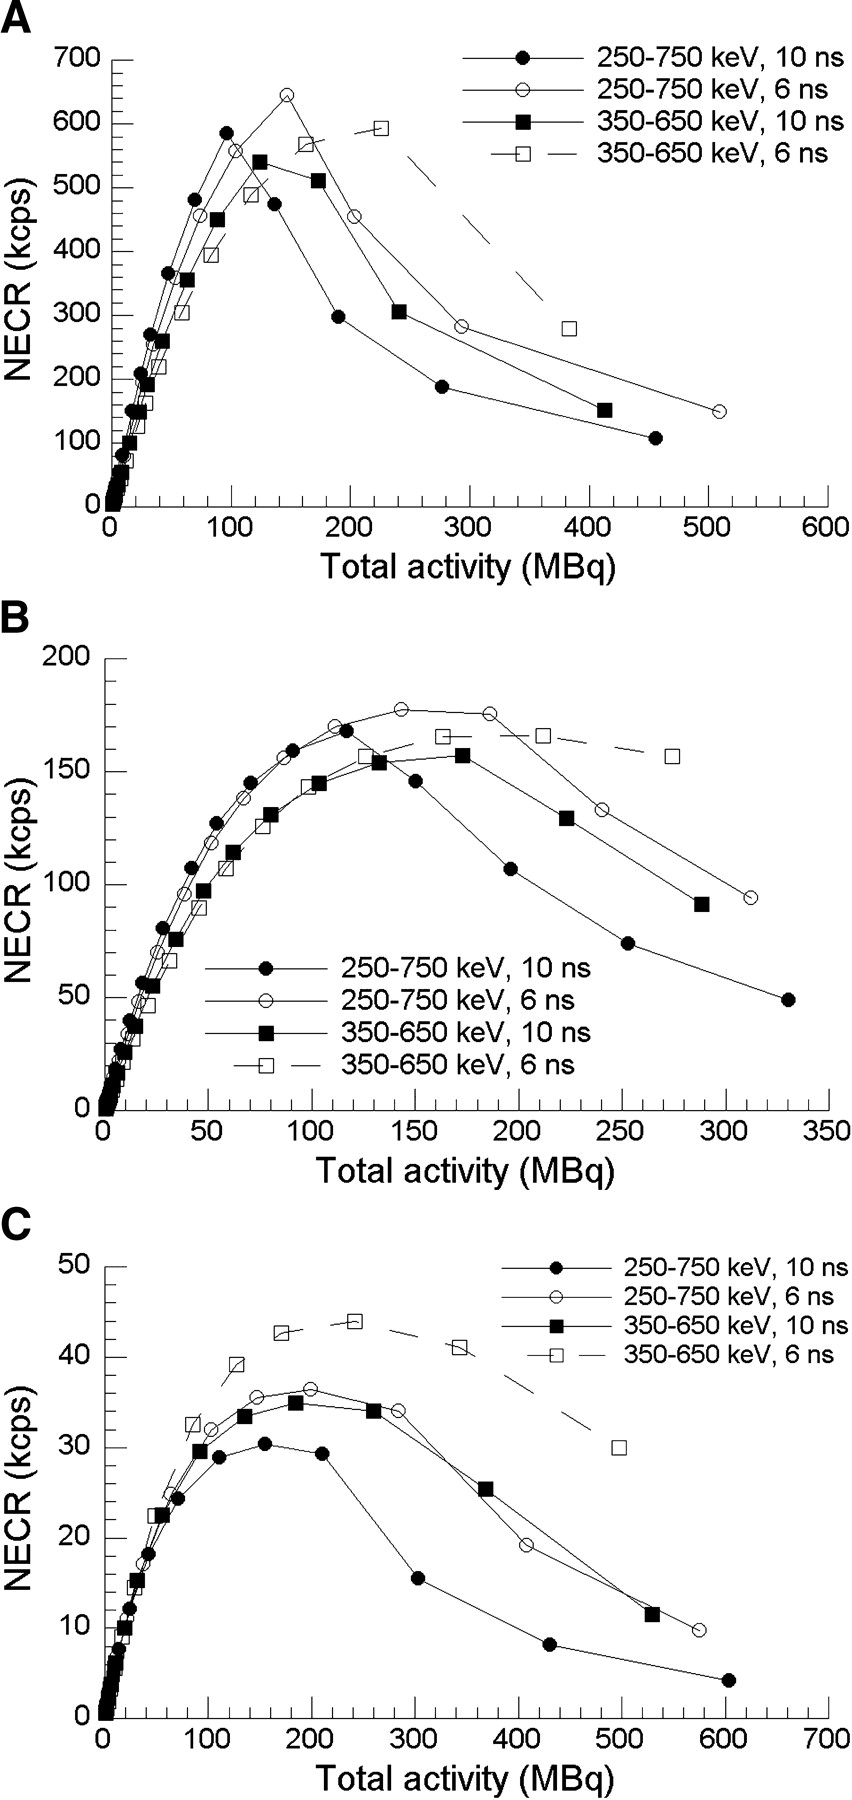
The projection fraction (α) of the mouse, rat, and monkey phantoms is 0.128, 0.256, and 0.430, respectively. The average scatter fraction of all 12 experiments calculated from the sinogram slices within the central 6-cm section of the axial FOV is listed in Table 2. The scatter fraction of the mouse, rat, and monkey phantoms ranges from 12.7% to 19.0%, from 27.4% to 36.5%, and from 40.9% to 58.1%, respectively.
Average Scatter Fraction of Mouse, Rat, and Monkey Phantoms
The NEC rates of the 3 phantoms are plotted against total activity in Figure 2 for different energy and timing windows. The system reaches its peak NEC rate of 645 kcps at 146.7 MBq (3.96 mCi) of activity in the mouse-size phantom using an energy window of 250–750 keV and a timing window of 6 ns. The peak NEC rate for the rat-size phantom is 177 kcps with a 250- to 750-keV energy window and 6-ns timing window when 143 MBq (3.87 mCi) of activity remained in the 15-cm tube. The peak NEC rate for the monkey-size phantom is 44.0 kcps with a 350- to 650-keV energy window and 6-ns timing window when 242 MBq (6.54 mCi) of activity remained in the 40-cm tube.

NEC rate of mouse (A), rat (B), and monkey (C) phantoms. Peak NEC rate of 645 kcps is reached with setting of 250–750 keV and 6 ns for mouse phantom. With rat phantom, peak NEC rate is 177 kcps with 250–750 keV and 6 ns. With monkey phantom, peak NEC rate is 44 kcps with 350–650 keV and 6 ns. NECR = NEC rate.
Imaging Studies
Phantom Studies.
Figure 3 shows the emission images of the micro-Derenzo hot rod phantom measured by the Focus (Fig. 3A) and the R4 (Fig. 3B) systems. All 1.5-mm rods are clearly separated in the image obtained on the Focus. Rods of 1.25 mm can also be identified, although the separation between adjacent rods is less distinct. Limited by its 2-mm resolution, the R4 is not able to separate the 1.5-mm rods.
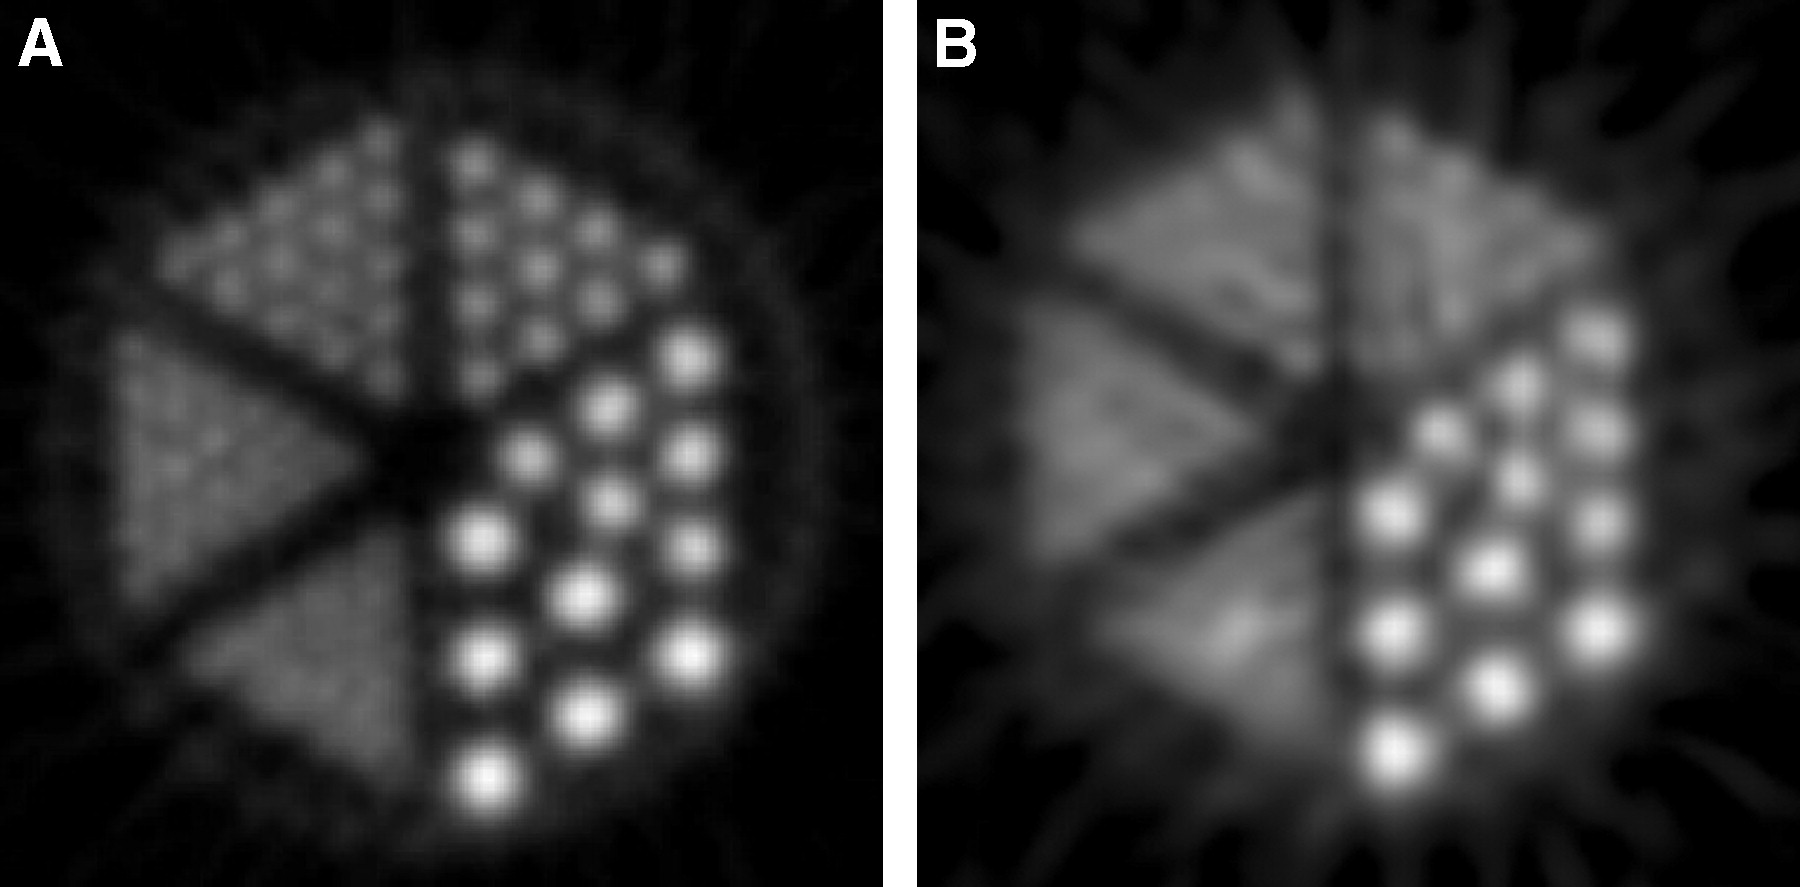
(A) Emission image measured by the Focus. (B) Same phantom as in A scanned by the R4. Diameter of rods was 0.80, 1.00, 1.25, 1.50, 2.00, and 2.50 mm, respectively. Center-to-center distance between adjacent rods was 2 times the rod diameter.
Animal Studies.
Figure 4 shows the coronal image of a mouse brain using 11C-CFT. The images were summed over the last 10 frames that correspond to 70–120 min after injection when most of the activity was cleared from the blood. The striatum can be clearly separated from the rest of the brain, suggesting that the resolution of the Focus might be adequate for studying the brains of transgenic mice as a model of human neurodegenerative disease.
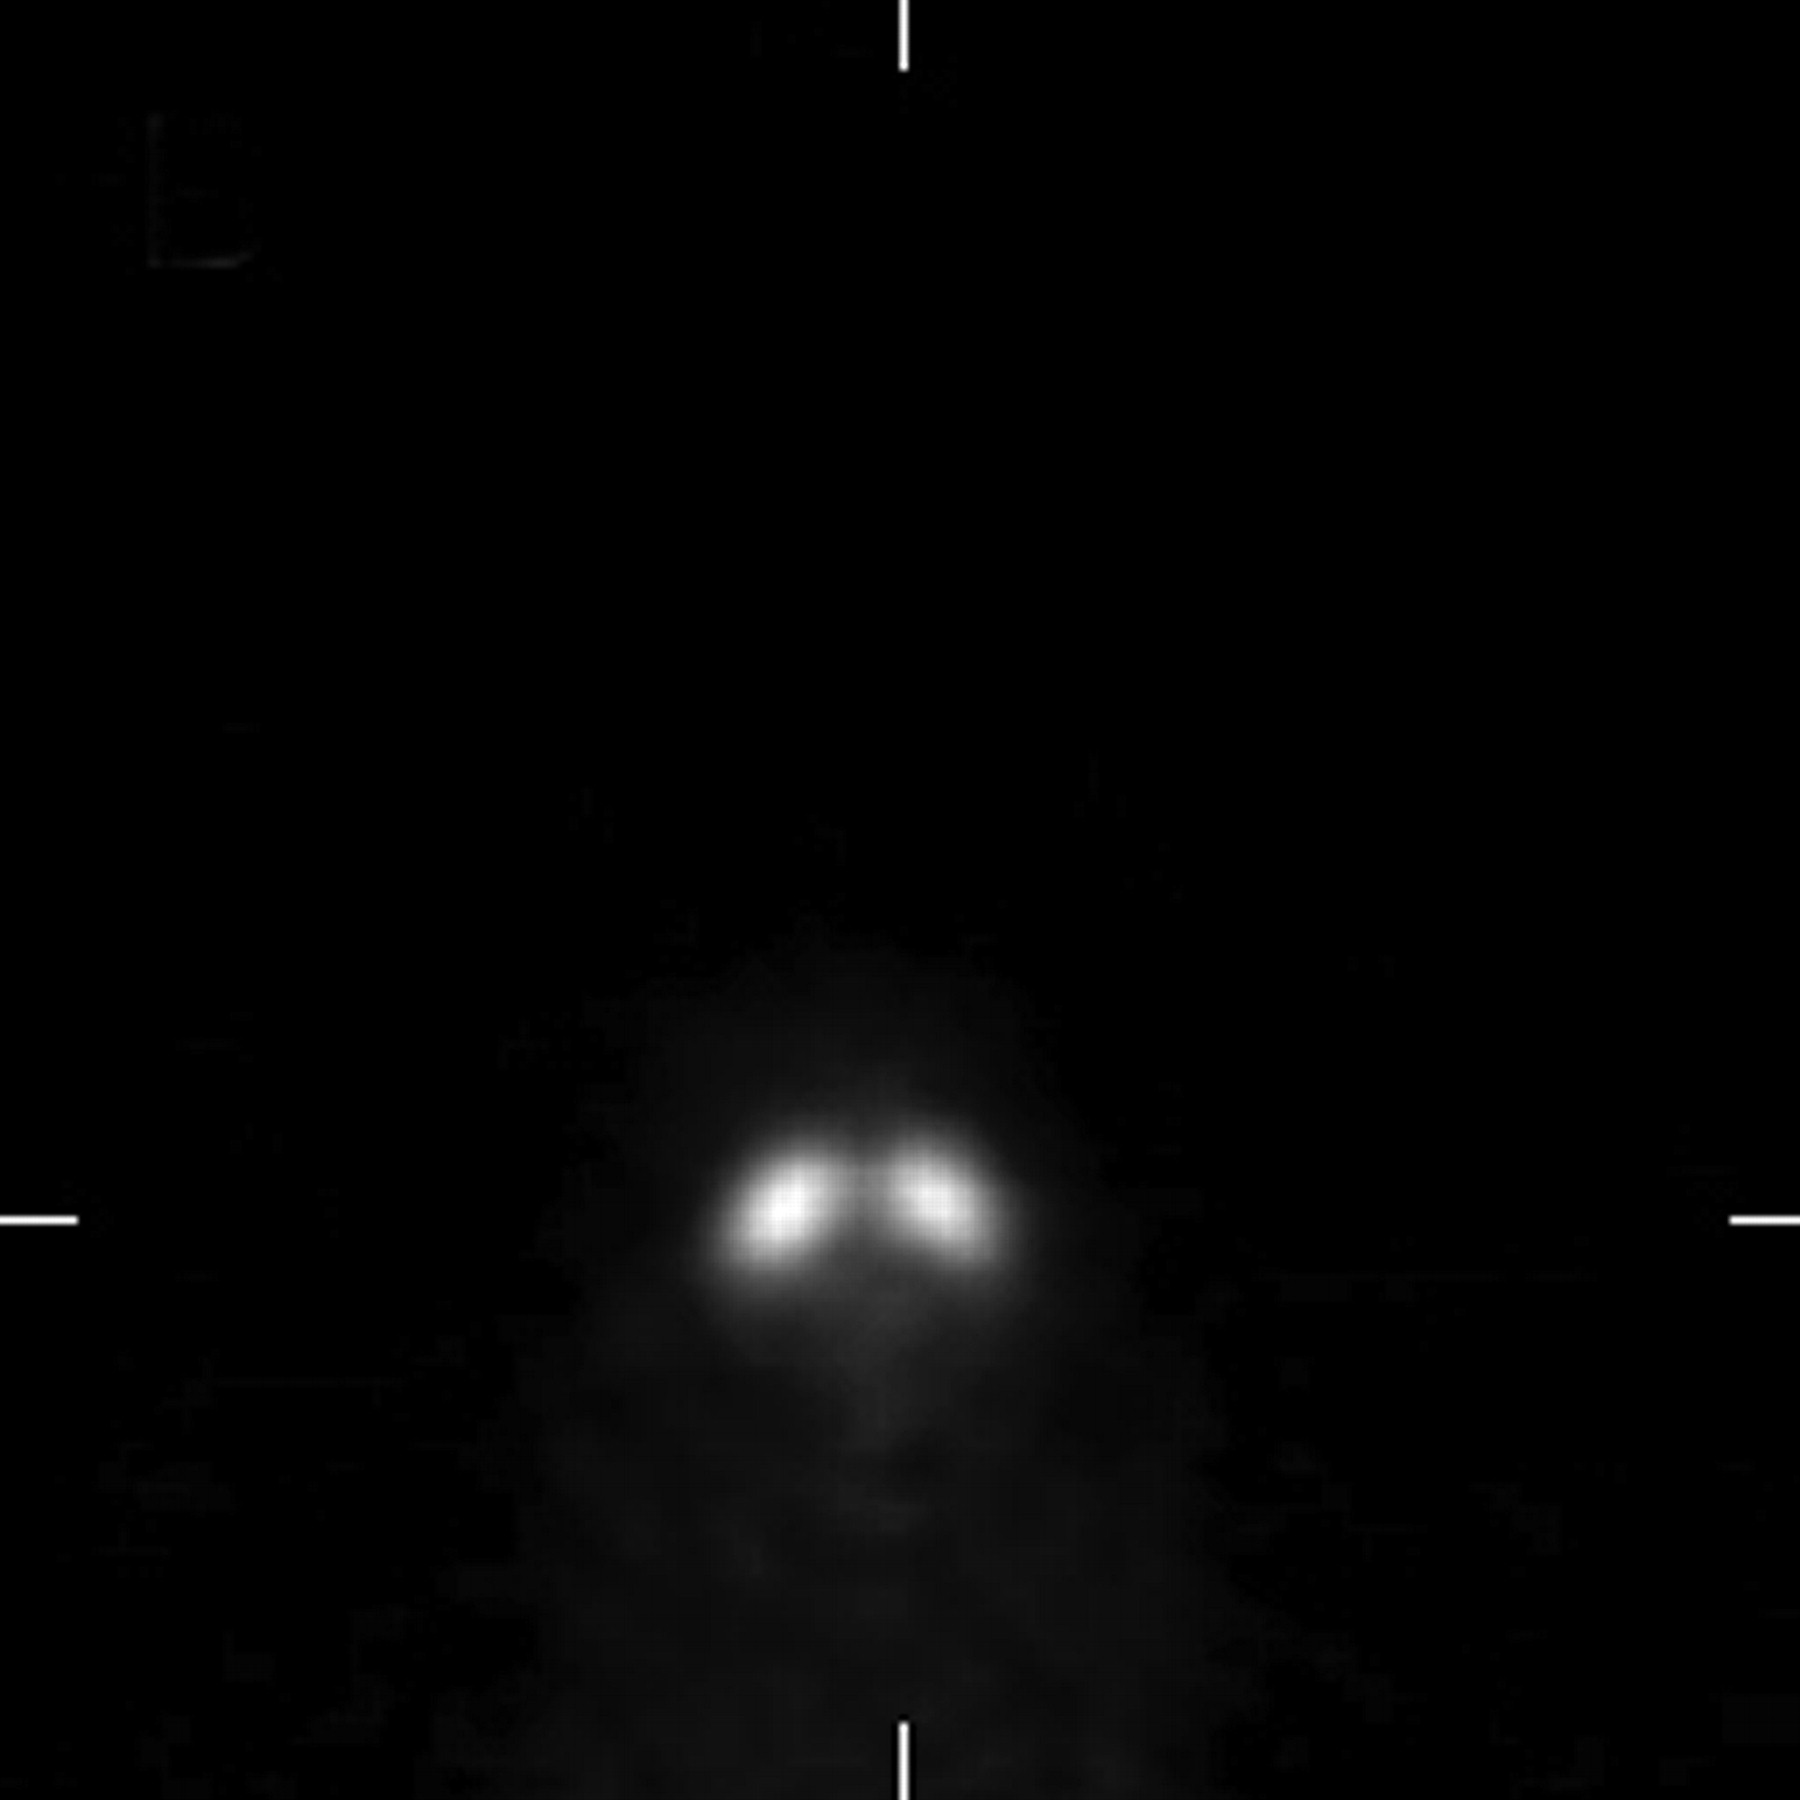
Coronal image of 18.7-g mouse injected with 17.8 MBq (0.48 mCi) of 11C-CFT. Image corresponds to 50-min acquisition starting at 70 min after injection by summing the last 10 frames of 2-h dynamic study.
Figure 5 shows the coronal images of a rat cardiac study with the gating feature turned on (Figs. 5A and 5B for end-diastole and end-systole, respectively) and turned off (Fig. 5C). The left and right ventricles can be identified in the nongated image with the improved resolution of the system. The gated images provide better definition of the cardiac chambers despite lower counting statistics (approximately one eighth of the nongated images) in individual gates. Clear definition of cardiac chambers can be crucial in estimating the uptake of tracers into the myocardium, the ejection fraction of the left ventricle, and the blood input function from the left ventricle.

Cardiac-gated study of 363-g Sprague–Dawley rat injected with 35.7 MBq (0.97 mCi) of 18F-FDG. Acquisition time was 30 min started 110 min after injection. Coronal image of heart: (A) gated at end-systole, (B) gated at end-diastole, and (C) nongated.
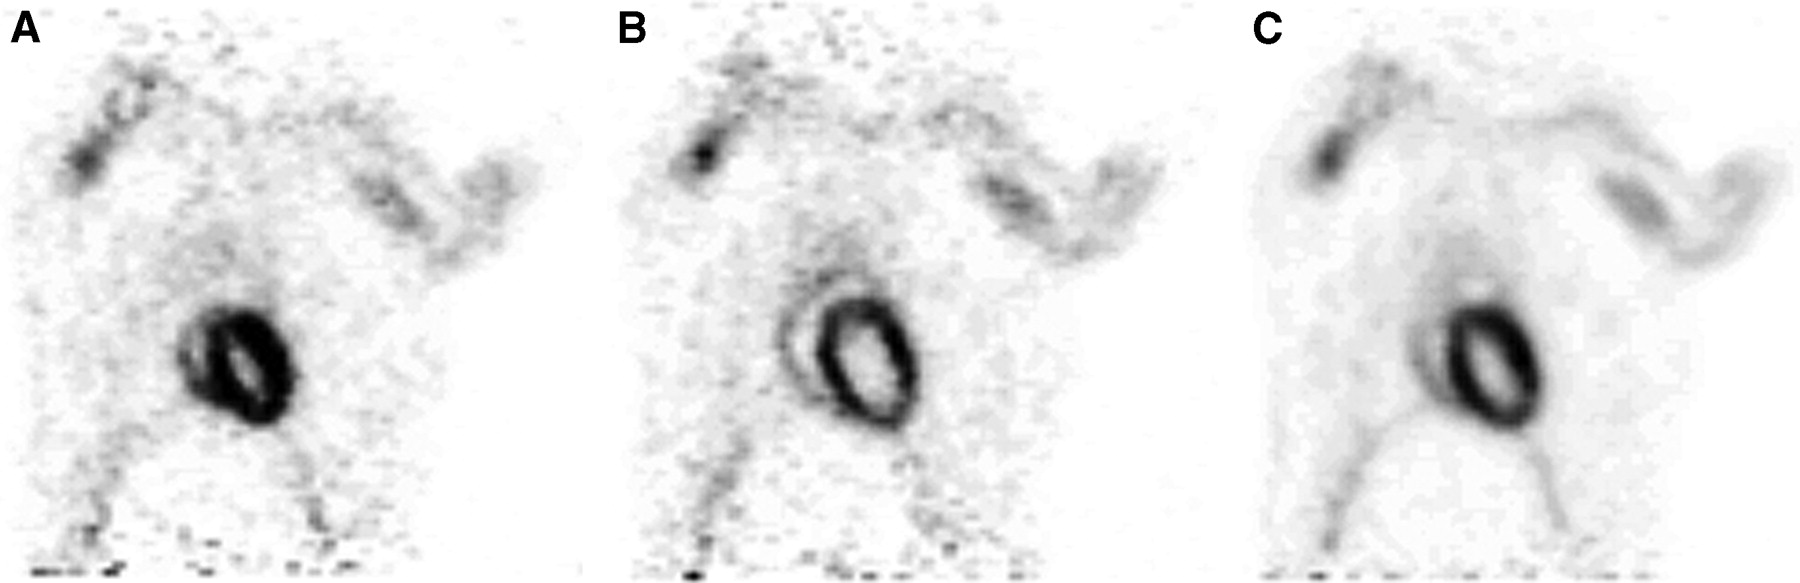
Figure 6 shows the transverse and coronal views of the emission (Fig. 6A) and transmission (Fig. 6B) images of a 5.4-kg macaque monkey brain using 18F-FDOPA. The emission images were summed over frames 15–30 that corresponded to 40–120 min after injection. The caudate nucleus and putamen can be clearly delineated in these images. Transmission images show the air cavity in a monkey head, which cannot be estimated without a measured transmission scan.
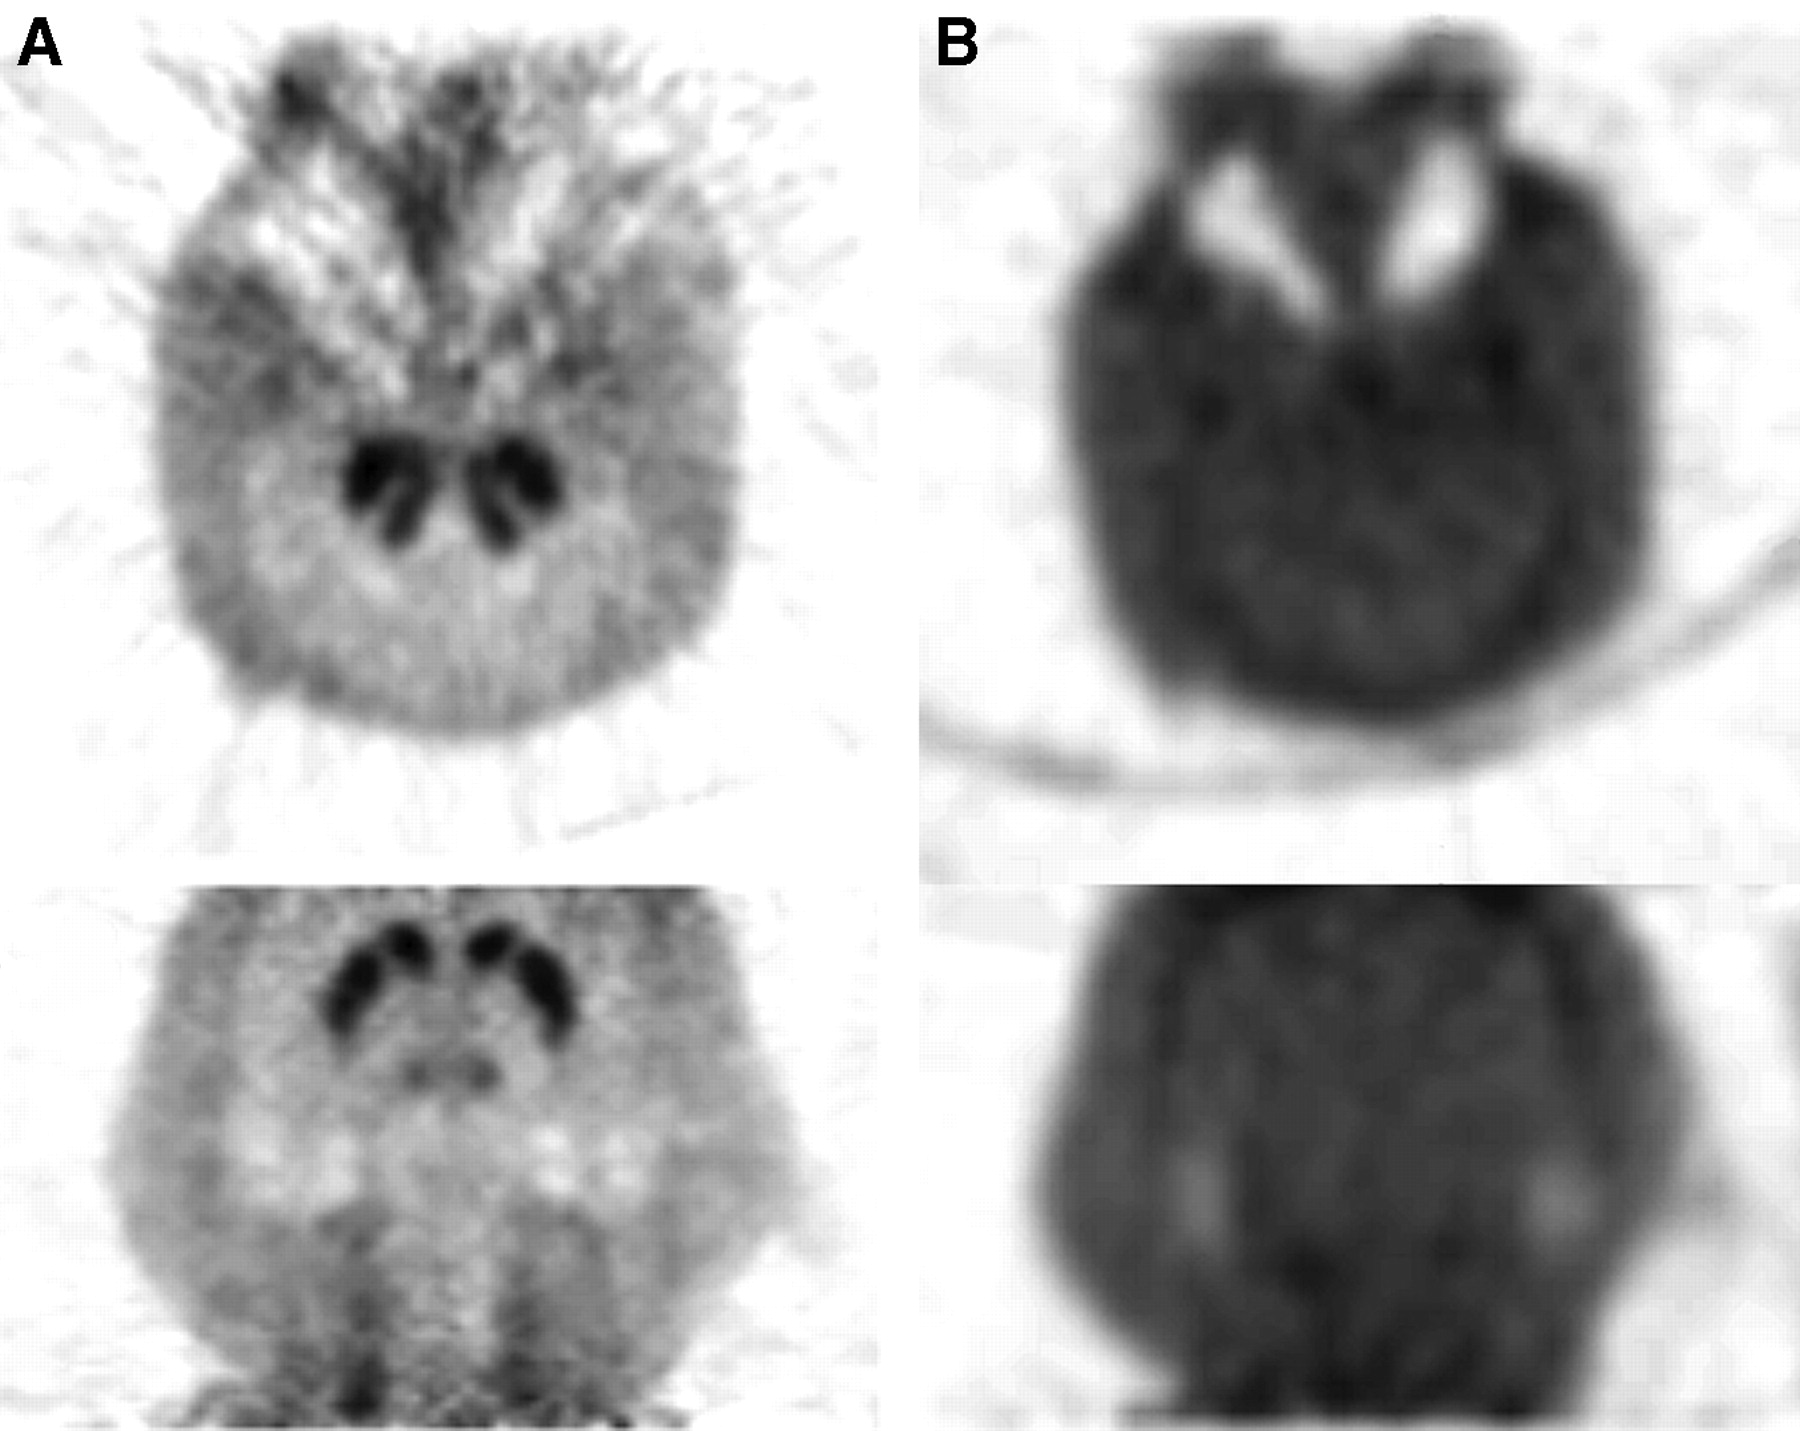
Two-hour dynamic imaging of 5.4-kg macaque monkey injected with 166 MBq (4.5 mCi) of 18F-FDOPA. (A) Transverse (top) and coronal (bottom) views of emission images correspond to summed frames of 15–30 (40–120 min after injection). (B) Transmission images of monkey head of same transverse and coronal slices.
DISCUSSION
In the design of a high-resolution animal PET system, there is often a compromise between good image resolution and high system sensitivity. Common approaches to increase the system sensitivity include the reduction of ring diameter and the use of longer detector crystal. Both approaches are subject to more severe depth-of-interaction effects that limit the usable imaging FOV or reduce the image resolution. The finer sampling and higher packing fraction of the Focus detector improve both image resolution and sensitivity compared with previous microPET models. This increase in sensitivity is critically important to support the improved image resolution in order to preserve good counting statistics without extending the acquisition time.
The option of adjusting the energy window according to the animal size permits the user to optimize the acquisition protocol for different types of studies. For a rodent study that has a small amount of intrasubject scatter, the energy window can be set wider to accept events that undergo a single Compton interaction in the LSO crystals but still describe the correct line of response. When the subject is a primate, the amount of intrasubject scatter may be high enough to warrant a narrower energy window to reduce the scatter contribution to the final image. This is reflected in the system counting rate performance study using a monkey phantom where the highest NEC rate is achieved with a tighter energy window (350–650 keV) and a tighter timing window (6 ns).
Due to the attenuation of the source housing, the effective activity of the 68Ge point source used in the calculation of system sensitivity was measured directly in a dose calibrator instead of decay corrected from the assayed value. The γ-rays scattered in the source housing have a good chance of being recorded in the dose calibrator but may escape when imaged by the PET scanner. The activity presented to the PET camera may be less than that reported by the dose calibrator; therefore, the reported system sensitivity may be slightly underestimated.
For small animals such as mice, the amount of attenuation is fairly small and does not change significantly due to intersubject variability. Transmission scans are not typically performed for mouse studies at our institution. Instead, the amount of attenuation is assumed to be a constant for mouse-size objects and is factored into the system calibration to scale up the measured activity concentration. For studies involving large animals, such as primates, where the attenuation correction is critical for quantitative accuracy, we perform a transmission scan in singles mode using a smaller energy window (460–560 keV). For the medium-size animals such as rats, we are still evaluating the trade-offs between the use of measured attenuation correction and the use of a predetermined amount of attenuation. If the accuracy of the attenuation correction using a short transmission scan can be further improved, the measured attenuation correction may be extended to the studies using medium-size animals.
Data management is an important issue for practical use of the Focus system. A typical 30-frame dynamic study may require 13 GB of disk storage for sinograms, whereas the list mode data may only take up 1–2 GB. This has forced us to change our data archival strategy from sinograms to list mode data for all dynamic studies. To further reduce the volume of data, 2 strategies can be applied: (a) reduce the transverse imaging FOV and (b) use a larger span (21) when sorting the data into 3D sinograms. The transverse imaging FOV can be reduced by software trimming when the list mode data are sorted into sinograms. The use of larger span is known to create axial blurring toward the edge of the transverse FOV. However, if the object is a mouse or a rat centered in the gantry, the loss in resolution may be negligible.
On measuring the axial resolution as a function of radial offset using a span of 7 when sorting the 3D sinograms, the axial resolution degrades by <5% within the central 50-mm-diameter FOV compared with a span of 3. This compromise reduces the size of a 3D sinogram to less than one half that of a file rebinned using a span of 3. If we limit the transverse FOV to 5 cm and use a span of 7, then the file size drops to one tenth of the original with little degradation. This is of benefit to users who have a large number of dynamic studies using mice.
The 3D reprojection (33), 3D OSEM, and maximum a posteriori (MAP) (34) reconstruction algorithms became available from the manufacturer after this study was completed. It is expected that the more sophisticated statistical reconstruction algorithms, along with improved modeling of the physical characteristics of the system, will further improve the resolution and noise properties of the reconstructed images. Evaluation of the improvement in image resolution using these algorithms is not included in this work and will be studied in the future.
When the system was released, the calculation of the normalization file was based on a direct inversion of 3D sinograms acquired from a rotating 68Ge point source. For a typical 3D sinogram that has >100 million lines of response, it is difficult to obtain high-quality normalization files with good statistics. Even with 100 GB of list mode data, the average number of counts per line of response is only slightly more than 100. Poisson statistics dictate that the variance may then be as high as 10%. A new component-based normalization procedure has been released by the manufacturer to improve the accuracy of the normalization. An initial evaluation indicates improved uniformity using this new method. The quantitative accuracy of both normalization methods, along with the accuracy of attenuation, scatter, and dead time corrections, will require further investigation.
CONCLUSION
This study has evaluated the basic performance of the microPET Focus system and its improvement over previous models. Our results indicate a significant improvement in nearly all aspects of typical PET system characteristics compared with the P4 and R4 models. The energy resolution of the system averages 18.5% for the 511-keV photopeak. The volumetric image resolution remains under 12.3 μL within the central 12-cm diameter FOV, a >2.6-fold improvement compared with the P4 and the R4. The peak sensitivity is 3.4% with a 250- to 750-keV energy window and 10-ns timing window, >50% improvement over the P4. The peak NEC rate is 645 kcps with 146.7 MBq (3.96 mCi) of activity in the mouse-size phantom, >2-fold improvement over both the P4 and the R4. Imaging studies of phantoms show clear improvement in image resolution. The transmission imaging capability is now established and can be used for primate studies. The selected animal studies demonstrate that the system is capable of neurologic and cardiac studies using small rodents, as well as brain imaging of nonhuman primates. Given the improved transmission image quality, the system is expected to achieve appropriate levels of quantitation after all corrections are validated and applied.
Acknowledgments
The authors thank Michael J. Welch, Arion F. Chatziioannou, Stephen Moerlein, Joel Perlmutter, Robert Mach, Terry Sharp, John Engelbach, Nicole Mercer, Lori Strong, Jerrel Rutlin, Bill Margenau, the cyclotron facility staff of Washington University School of Medicine, and Robert Nutt, Rhonda Goble, Anne Smith, Charles Landen, Aaron McFarland, R. Scott Beach, and Michael Tjon of Concorde Microsystems for valuable discussions and technical support. This work was supported by grants from the National Institutes of Health (P01-HL13851), National Cancer Institute (WUSAIR R24-CA83060 and R24-CA92865), and the Department of Energy (DE FC03-02ER63420).
Footnotes
Received Apr. 5, 2004; revision accepted Oct. 8, 2004.
For correspondence contact: Yuan-Chuan Tai, PhD, Washington University School of Medicine, Campus Box 8225, 510 S. Kingshighway Blvd., St. Louis, MO 63110.
E-mail: taiy{at}wustl.edu
REFERENCES
In this issue


Jump to section
Related Articles
Cited By...
- Metabolic resistance of A{beta}3pE-42, a target epitope of the anti-Alzheimer therapeutic antibody, donanemab
- Submillimeter-Resolution PET for High-Sensitivity Mouse Brain Imaging
- Evaluation of Candidate Theranostics for 227Th/89Zr Paired Radioimmunotherapy of Lymphoma
- High-resolution positron emission microscopy of patient-derived tumor organoids
- Performance Evaluation of a High-Resolution Nonhuman Primate PET/CT System
- Reproducibility and Comparability of Preclinical PET Imaging Data: A Multicenter Small-Animal PET Study
- Cell-Proliferation Imaging for Monitoring Response to CDK4/6 Inhibition Combined with Endocrine-Therapy in Breast Cancer: Comparison of [18F]FLT and [18F]ISO-1 PET/CT
- Noninvasive Interrogation of DLL3 Expression in Metastatic Small Cell Lung Cancer
- Preclinical Evaluation and Quantification of 18F-FPEB as a Radioligand for PET Imaging of the Metabotropic Glutamate Receptor 5
- Imaging the Norepinephrine Transporter in Neuroblastoma: A Comparison of [18F]-MFBG and 123I-MIBG
- Evaluation of Frame-Based and Event-by-Event Motion-Correction Methods for Awake Monkey Brain PET Imaging
- Performance Evaluation of the Small-Animal nanoScan PET/MRI System
- Quantitative PET Imaging Detects Early Metabolic Remodeling in a Mouse Model of Pressure-Overload Left Ventricular Hypertrophy In Vivo
- VECTor: A Preclinical Imaging System for Simultaneous Submillimeter SPECT and PET
- In Vivo Measurement of the Affinity and Density of Metabotropic Glutamate Receptor Subtype 1 in Rat Brain Using 18F-FITM in Small-Animal PET
- Small-Animal PET: What Is It, and Why Do We Need It?
- NEMA NU 4-2008 Comparison of Preclinical PET Imaging Systems
- Assessment of PET Tracer Uptake in Hormone-Independent and Hormone-Dependent Xenograft Prostate Cancer Mouse Models
- Gastric Cancer Growth Control by BEZ235 In Vivo Does Not Correlate with PI3K/mTOR Target Inhibition but with [18F]FLT Uptake
- Whiskers Area as Extracerebral Reference Tissue for Quantification of Rat Brain Metabolism Using 18F-FDG PET: Application to Focal Cerebral Ischemia
- Simplified Quantification of Myocardial Flow Reserve with flurpiridaz F 18: Validation with Microspheres in a Pig Model
- In Vivo Positron Emission Tomographic Imaging of Glial Responses to Amyloid-{beta} and Tau Pathologies in Mouse Models of Alzheimer's Disease and Related Disorders
- Establishment of In Vivo Brain Imaging Method in Conscious Mice
- Dynamic PET Denoising with HYPR Processing
- Delivery of Na/I Symporter Gene into Skeletal Muscle Using Nanobubbles and Ultrasound: Visualization of Gene Expression by PET
- Efficacy of PHA-848125, a Cyclin-Dependent Kinase Inhibitor, on the K-RasG12DLA2 Lung Adenocarcinoma Transgenic Mouse Model: Evaluation by Multimodality Imaging
- NEMA NU4-2008 Image Quality Performance Report for the microPET Focus 120 and for Various Transmission and Reconstruction Methods
- In Vivo Metabolic Phenotyping of Myocardial Substrate Metabolism in Rodents: Differential Efficacy of Metformin and Rosiglitazone Monotherapy
- Quantification of Cerebral Glucose Metabolic Rate in Mice Using 18F-FDG and Small-Animal PET
- A Novel Technology for the Imaging of Acidic Prostate Tumors by Positron Emission Tomography
- Recent Advances in Small-Animal Cardiovascular Imaging
- Performance Evaluation of the Inveon Dedicated PET Preclinical Tomograph Based on the NEMA NU-4 Standards
- In Vivo Biodistribution, PET Imaging, and Tumor Accumulation of 86Y- and 111In-Antimindin/RG-1, Engineered Antibody Fragments in LNCaP Tumor-Bearing Nude Mice
- Neuroimaging and Physiological Evidence for Involvement of Glutamatergic Transmission in Regulation of the Striatal Dopaminergic System
- Derivation of a Compartmental Model for Quantifying 64Cu-DOTA-RGD Kinetics in Tumor-Bearing Mice
- Engineered Antibody Fragments with Infinite Affinity as Reporter Genes for PET Imaging
- In Vitro and In Vivo Evaluations of a Hydrophilic 64Cu-Bis(Thiosemicarbazonato)-Glucose Conjugate for Hypoxia Imaging
- Impact of Contamination from Scattered Photons in Singles-Mode Transmission Data on Quantitative Small-Animal PET Imaging
- Micro Insert: A Prototype Full-Ring PET Device for Improving the Image Resolution of a Small-Animal PET Scanner
- PET/MRI Dual-Modality Tumor Imaging Using Arginine-Glycine-Aspartic (RGD)-Conjugated Radiolabeled Iron Oxide Nanoparticles
- Time Course of Alterations in Myocardial Glucose Utilization in the Zucker Diabetic Fatty Rat with Correlation to Gene Expression of Glucose Transporters: A Small-Animal PET Investigation
- A Prototype PET Scanner with DOI-Encoding Detectors
- Changes in Tumor Metabolism as Readout for Mammalian Target of Rapamycin Kinase Inhibition by Rapamycin in Glioblastoma
- Initial Characterization of an 18F-Labeled Myocardial Perfusion Tracer
- Virtual-Pinhole PET
- 1-11C-Acetate as a PET Radiopharmaceutical for Imaging Fatty Acid Synthase Expression in Prostate Cancer
- A Feasibility Study of a Prototype PET Insert Device to Convert a General-Purpose Animal PET Scanner to Higher Resolution
- Longitudinal, Quantitative Assessment of Amyloid, Neuroinflammation, and Anti-Amyloid Treatment in a Living Mouse Model of Alzheimer's Disease Enabled by Positron Emission Tomography
- Performance Measurement of the microPET Focus 120 Scanner
- Synthesis and Biologic Evaluation of 64Cu-Labeled Rhenium-Cyclized {alpha}-MSH Peptide Analog Using a Cross-Bridged Cyclam Chelator
- Fabrication and Characterization of a 0.5-mm Lutetium Oxyorthosilicate Detector Array for High-Resolution PET Applications
- 64Cu-Azabicyclo[3.2.2]Nonane Thiosemicarbazone Complexes: Radiopharmaceuticals for PET of Topoisomerase II Expression in Tumors
- Performance Evaluation of the GE Healthcare eXplore VISTA Dual-Ring Small-Animal PET Scanner
- Monitoring Tumor Glucose Utilization by Positron Emission Tomography for the Prediction of Treatment Response to Epidermal Growth Factor Receptor Kinase Inhibitors.
- Noninvasive Measurement of Cardiovascular Function in Mice with High-Temporal-Resolution Small-Animal PET
- Assessment of Myocardial Metabolism in Diabetic Rats Using Small-Animal PET: A Feasibility Study
- Performance Test of an LSO-APD Detector in a 7-T MRI Scanner for Simultaneous PET/MRI
- Assessment of Myocardial Blood Flow Using 15O-Water and 1-11C-Acetate in Rats with Small-Animal PET
- Reproducibility of 3'-Deoxy-3'-18F-Fluorothymidine MicroPET Studies in Tumor Xenografts in Mice