


Abstract
The aim of this study was to explore the feasibility of determining parameters of cardiovascular function in mice noninvasively by high-temporal-resolution imaging with a dedicated small-animal PET system. Methods: Twenty-five anesthetized mice (28.8 ± 4.6 g) were injected via an intravenous catheter with a 30-μL bolus of 18F-FDG (8–44 MBq). The first 9 s of data were reconstructed into 30 frames of 0.3 s using filtered backprojection. The time–activity curve derived from a left ventricle volume of interest was corrected for tracer recirculation and partial volume. Cardiac output was calculated by the Stewart-Hamilton method, in which cardiac output is total injected activity divided by the area under the left ventricle time–activity curve. Cardiac output divided by body weight was defined as cardiac index; cardiac output divided by heart rate yielded the stroke volume. In 5 mice, measurements were repeated 2–4 times to assess reproducibility. In 4 mice, the hemodynamic response to dobutamine was examined by measuring heart rate, cardiac output, and stroke volume. Results: The cardiac output averaged 20.4 ± 3.4 mL/min; in the repeated measurements, the parameter displayed a mean percentage SD per mouse of 10% ± 6%. The cardiac index averaged 0.73 ± 0.19 mL/min/g and the stroke volume 45.0 ± 6.9 μL, and both correlated with heart rate (r = 0.53, P = 0.007, and r = 0.49, P = 0.01, respectively). During dobutamine stress, heart rate increased from 423 ± 50 to 603 ± 30 beats/min (P = 0.002) and cardiac output increased from 18.5 ± 1.9 to 32.0 ± 4.2 mL/min (P = 0.008). Conclusion: Parameters of cardiovascular function can be measured in mice noninvasively by radionuclide angiography using high-temporal-resolution small-animal PET. Measured values of cardiac output and stroke volume are reproducible and comparable to those obtained with MRI. The approach permits the monitoring of changes in cardiovascular function in response to pharmacologic intervention.
Compared with invasive and terminal ex vivo and in vitro tissue assays, noninvasive, nonterminal, in vivo imaging approaches such as PET are important research tools because they allow repeated studies in the same living animal. Repeated evaluations of the same animal reduce the number of experiments and animals needed to achieve statistical significance and permit longitudinal investigations for determining changes in biologic parameters, including blood flow, substrate metabolism, receptor binding, and gene expression (1,2). Previous studies have demonstrated the feasibility of quantitative measurements of the cardiovascular system with small-animal PET (3–11). However, most of these investigations were confined to the rat, whereas many investigators prefer mouse models because of the large number of available gene knockout models and the fast reproduction and easy handling of mice, compared with larger animal models. Mice are also suitable models for designing and exploring gene therapy approaches, for investigating the phenotypic consequences of gene manipulations, and for studying myocardial repair (12–14). Accordingly, there is considerable demand for in vivo assays of cardiovascular pathophysiology in mice. Yet, PET of the mouse heart has remained challenging because of its small size relative to the spatial resolution of available small-animal PET systems (15,16). The current study explored the feasibility of noninvasively determining cardiovascular function in mice by high-temporal-resolution imaging with a dedicated small-animal PET system.
MATERIALS AND METHODS
Study Design
In a group of 25 anesthetized mice, cardiac output, cardiac index, and stroke volume were determined. Five mice of this group were studied a second time to assess the reproducibility of PET measurements of cardiac output. In 4 mice, changes in cardiac output from baseline in response to positive inotropic stimulation with dobutamine were determined. This was done to assess whether the approach accurately measures changes in cardiovascular function in response to known pharmacologic interventions. The validity of the virtual phantom-based correction for partial volume of the left-ventricle (LV) blood-pool activity was evaluated with arterial blood sampling in 6 additional mice.
Animals and Imaging Protocol
Twenty-five 10- to 24-wk-old male CL57BL/6 mice (28.8 ± 4.6 g) were studied. Anesthesia was induced by inhalation of 1.5%–2% isoflurane in 100% oxygen. The animals were placed in an imaging chamber specifically designed for small-animal PET and small-animal CT studies (17) to allow for temperature control and monitoring, reproducible positioning, and anesthesia delivery. A 29-gauge needle connected to a 3- to 5-cm-long polyethylene catheter (PE20; Intramedic, Clay-Adams) was inserted into the tail vein for radiotracer injection and for drug administration. 18F-FDG (30 μL, 8–44 MBq) was injected manually within less than 1 s and without an additional saline flush. Heart rates were monitored electrocardiographically.
Measurements were repeated in 5 mice as often as 4 times but at least 2 d apart to allow sufficient time for the animals to recover. For the pharmacologic intervention studies, 4 mice were studied twice, first at baseline and then again shortly after infusion of dobutamine. The agent is known to increase cardiac output significantly in mice (18,19). The dobutamine (12.5 mg/mL; Ben Venue Laboratories, Inc.) was diluted in normal saline solution and infused intravenously with an infusion pump through the tail vein catheter. Beginning with 6 μg of dobutamine/min/kg of body weight, the infusion rate was increased in steps of 6 μg/min/kg every 2 min until a rate of 24 μg/min/kg was reached. That rate was maintained for at least 3 min. Immediately after the dobutamine infusion had been discontinued, the 30 μL bolus of 18F-FDG was injected through the tail vein. The 110-min half-life of 18F precluded performance of baseline and dobutamine studies during the same study session. Therefore, the animals were allowed to recover after the baseline study for at least 2 d, after which the dobutamine stimulation studies were performed. For the same reason, reproducibility measurements were performed on separate days.
Electrocardiograms were recorded with 2 neonatal carbon electrodes (3M Health Care) attached to the shaved upper right and lower left back of the mouse and connected to a multichannel amplifying and analyzing system (MP 150; Biopac Systems, Inc.) and a laptop computer (iMac; Apple Computer, Inc.) (20).
Small-Animal PET
A microPET Focus 220 system (Siemens Preclinical Solutions) was used. The body of a mouse fits in the axial field of view of 7.6 cm. The sensitivity of the system is 3.4% at the center of the field of view, and the spatial resolution with filtered backprojection reconstruction approaches 1.75 mm in full width at half maximum (21). Data were corrected for radioactive decay, random coincidence counts, and dead-time losses.
The 10-min list-mode image acquisition was started 1–4 s before the 18F-FDG bolus injection. After image acquisition, the animal bed with the mouse positioned inside was transferred to a small-animal CT scanner (microCAT II; Siemens Preclinical Solutions) used to generate CT-derived attenuation maps for correction of the PET data (22). Special care was taken to prevent any movement of the mouse on the bed during the switch from PET to CT. After image reconstruction, the small-animal PET and small-animal CT studies were coregistered using a previously published method in which a known translational offset can be applied to align the images (22). Alignment accuracy between the PET and CT images was also monitored and verified visually.
Image Reconstruction
The first 9 s of list-mode data after radiotracer injection were binned into 30 frames of 0.3 s each. An attenuation map was generated from the acquired small-animal CT dataset (22). PET data were reconstructed using the filtered backprojection algorithm with a pixel size of 0.4 mm and an interplane distance and thickness of 0.8 mm in a 128 × 128 matrix with 95 transverse slices. Scatter and attenuation correction was applied (microPET Manager, version 2.1.5.0; Siemens Preclinical Solutions).
Analysis of PET Data
For image display and assignment of volumes of interest (VOIs), the public domain program AMIDE was used (23). Three-dimensional cylindric and elliptic VOIs were placed in the right ventricle (RV) and LV based on the first-pass images, and over the whole body of the mouse using all views: transverse, coronal, and sagittal. The VOIs were then copied to the rebinned, serial 0.3-s frames of the first 9 s after tracer injection. Proper positioning was verified visually. VOIs were 1.3 mm3 for the RV and 2.6 mm3 for the LV for all animals. Depending on the angulation of the heart relative to the imaging planes, the VOIs extended over 2–3 imaging planes. Three-dimensional volume, rather than 2-dimensional planar regions of interest were used to obtain better count statistics. Late-phase images were not used for VOI assignment because only early-phase data, from the first passage of the radiotracer through the circulatory system, were required for this study. Counts derived from the VOIs were expressed as mean PET counts/cm3/s and were used for generating time–activity curves. The whole-body activity derived from the whole-body VOI was expressed as counts/s.
The cardiac output was calculated by the Stewart-Hamilton indicator-dilution method (24–26), in which blood flow through a vessel (or cardiac output) is derived from the integral of the first-pass indicator (or radiotracer) concentration curve and the amount of indicator (or radiotracer) introduced into the blood vessel by Eq. 1where CO is cardiac output (in mL/min), A the total activity of radiotracer injected (counts/s), and C the concentration of radiotracer (counts/mL/s) in blood in the LV at time t (in min). During the time of measurement (i.e., the initial transit of the tracer through the central circulation), the indicator (or radiotracer) is assumed not to be trapped in tissue between the tail vein injection site and the LV chamber, and the first-pass radiotracer concentration curve is assumed to be free of recirculating radiotracer activity.
The injected dose of radiotracer A was assumed to equal the counts in the whole-body VOI (PET counts/min). The radiotracer concentration in the blood during the initial bolus transit was derived from the LV time–activity curve corrected for the partial-volume–related underestimation of the true activity and is expressed in counts/s/mL. The downslope of the time–activity curve was fitted exponentially and extrapolated over 8 s to remove contamination by recirculating activity from the tail end of the time–activity curve (Fig. 1). The integral of the first-pass radiotracer time–activity curve was then expressed as the product of counts/s/mL and time t.
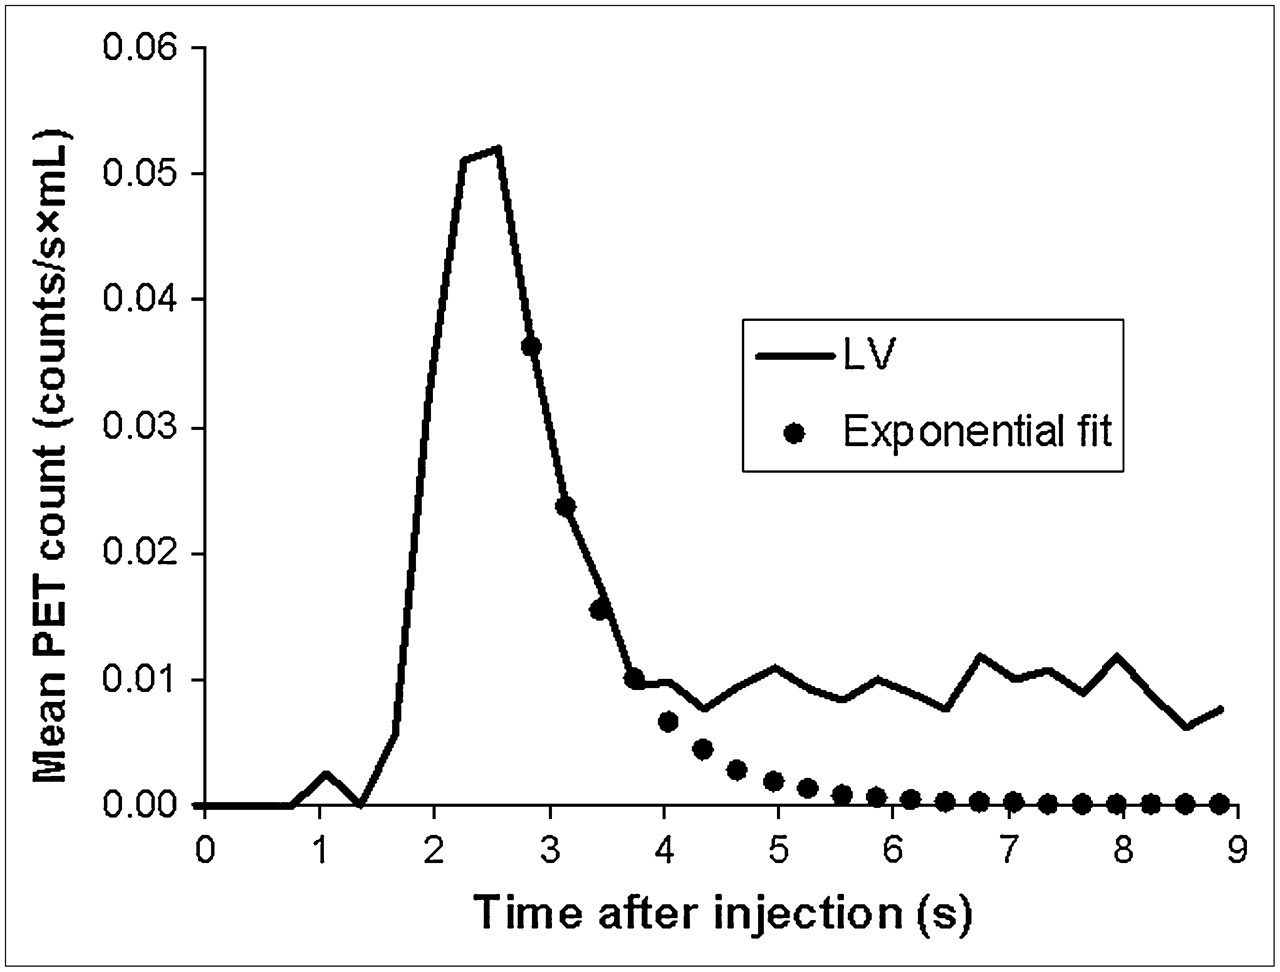
Example of LV time–activity curve and exponential fit correcting for recirculation. Area under upslope of LV time–activity curve and exponentially fitted downslope is finite.
The recovery coefficient, needed for correction of the partial-volume–related underestimation of the true blood tracer concentration, was estimated using the 4-dimensional virtual mouse phantom as reported by Segars et al. (27), which incorporates the image data obtained in a 16-wk-old CL57BL/6 mouse. The approach takes into account the physiologic changes in LV blood-pool size and location with heart motion and respiration and differs from the conventional method used to determine the recovery coefficient by imaging volumes of various diameters.
The recovery coefficient for this study was determined by setting the value for the blood pool of the 4-dimensional phantom to 100 arbitrary units and the values for other structures to zero. A heart rate of 460 beats/min and respiratory rate of 150 breaths/min, reflecting normal values for mice, were simulated. The image data of the animal's chest were reconstructed into 75 slices using a voxel size of 0.2 mm and a transaxial matrix size of 128 × 128. In order to account for the lower resolution of small-animal PET, a Gaussian filter (1.75 mm in full width at half maximum) was applied to the 3-dimensional dataset. The recovery coefficient was determined by placing the same-sized VOI as was used for the mouse studies on the LV blood pool of the phantom image data. In this way, a recovery coefficient of 0.76 was obtained and subsequently applied to the count activities derived from the LV blood-pool VOI.
The cardiac index was derived from cardiac output divided by body weight and stroke volume by dividing cardiac output by heart rate as determined from the electrocardiogram.
Comparison of In Vivo PET-Derived Blood-Pool Counts with Blood Sampling
In 6 additional mice, a polyethylene catheter (PE10; Intramedic, Clay-Adams) was inserted under isoflurane anesthesia into the femoral artery. Multiple blood samples (<15 μL) were obtained manually during the 1-h PET study. The counts, measured by a high γ-counter (Packard Cobra II Auto Gamma; Perkins Elmer Inc.), were corrected for dead time, scatter, and decay and were then converted to PET-equivalent counts/mL using a calibration factor derived from a mouse-sized cylinder.
Because blood samples could not be obtained rapidly enough to determine the radioactivity concentrations during the initial bolus transits through the central circulation, we selected an early time point, 20–35 s after injection, for the comparison between in vivo and blood-sampling–derived values. At this time, equivalent to several circulation times, the 18F-FDG concentration is relatively constant and 18F-FDG uptake in the myocardium is still minimal. Assignment of VOIs in this group of mice was the same as in the cardiac output group. The mean counts detected by the LV blood-pool VOI were corrected for partial volume using the previously determined recovery coefficient of 0.76 and were compared with the arterial blood-sampling data.
Data Analysis
Mean values are given with SD. Linear regression analysis was used for correlating cardiac output, cardiac index, stroke volume, and heart rate. The variability of the repeated measurements was expressed as the ratio of the SD to the mean value of all measurements (percentage SD). A paired 2-tailed Student t test was used for comparing the baseline and dobutamine-stress measurements and then again for the repeated measurements in the same mouse. A P value of less than 0.05 indicated statistical significance.
RESULTS
Quality of Small-Animal PET Images
Despite the short frame duration of only 0.3 s, the acquired images were of good visual quality. As shown in Figure 2, the images depicted the initial transit of the 18F-FDG bolus through the central circulation of the mouse. The coronal and transverse views displayed progression of the tracer bolus from the RV into the lungs and further into the LV. In all cases, VOIs could be assigned to the RV or LV using only the early-phase PET images.

Consecutive 0.3-s frames show passage of tracer bolus through RV cavity, lungs, and LV chamber of mouse on coronal and transverse slices. Times are those after start of image acquisition. For better anatomic orientation, PET scan is overlaid with coregistered CT scan.
Quality of Time–Activity Curves and Quantitative Data
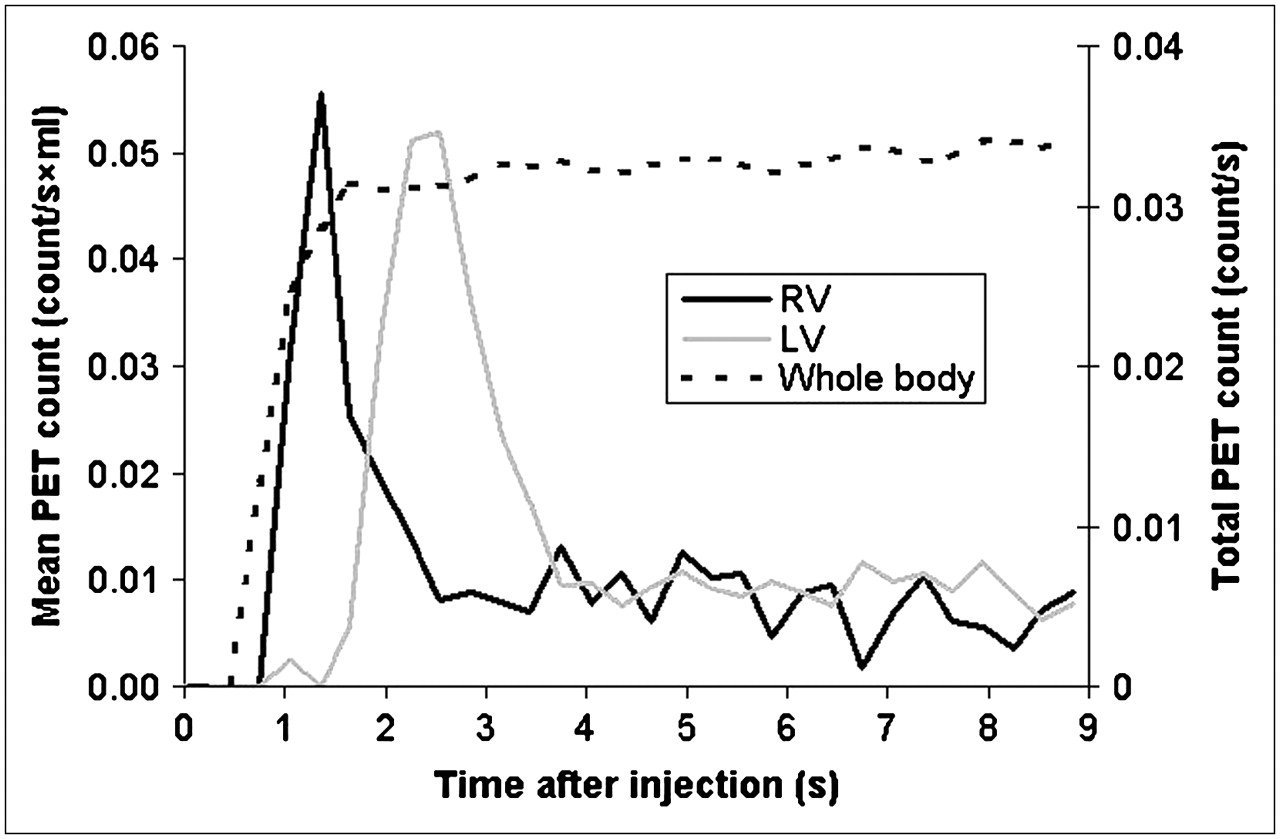
Time–activity curves derived from the RV, the LV, and the whole-body VOIs from one of the mice are depicted in Figure 3. The whole-body counts began to rise shortly after the intravenous radiotracer injection into the tail vein. The time–activity curve derived from the RV displayed a distinct peak and appeared to be free of activity from the LV. Notably, almost no activity was detected in the LV time–activity curve during the peak of the RV time–activity curve, indicating a negligible spillover of activity between the 2 VOIs. The RV time–activity curve was already sharply declining when the activity in the LV began to rise. The peaks of the RV and LV time–activity curves were well separated by 1 s (3 frames apart). This was the case in all studies. The total counts derived from the whole-body VOI plateaued within 2–3 s and showed only a minimal increase over time, most likely because of residual tracer temporarily trapped in the venous system or soft tissue of the tail.

Time–activity curves derived for VOIs placed in RV and LV chamber and over whole body (total count on secondary y-axis).
After applying the phantom-derived recovery coefficient, we found a close agreement between the LV blood-pool counts obtained by in vivo PET and those obtained by blood sampling in the group of 6 mice with an arterial catheter (0.0085 ± 0.0041 counts/mL/s and 0.0082 ± 0.0040 counts/mL/s, respectively). The difference between the 2 methods per mouse averaged 13.7% ± 12.6%.
Cardiac Output, Cardiac Index, and Stroke Volume
Cardiac output at baseline averaged 20.4 ± 3.4 mL/min in the 25 mice studied, and the average cardiac index was 0.73 ± 0.19 mL/min/g. Heart rate positively correlated with both cardiac output and cardiac index (respectively, r = 0.53, P = 0.007, and r = 0.49, P = 0.01; Fig. 4). The stroke volume averaged 45.0 ± 6.9 μL.

Correlations between cardiac output, cardiac index, and heart rate.
In the repeated measurements, cardiac output averaged 19.1 ± 1.9 mL/min in the first study and 19.8 ± 2.3 mL/min in the second study (P = 0.59); in a per-mouse analysis, the second measurements differed on average by 13.1% ± 10.7% from the first measurements. Mean heart rate, an indicator of the physiologic condition of the animal at the time of the study, also tended to be higher during the second than during the first study (429 ± 43 beats/min vs. 444 ± 51 beats/min, P = 0.63); the mean difference between the second value and the first was 15.4% ± 10.4%. In contrast, the stroke volumes were nearly identical (44.5 ± 2.0 μL vs. 44.8 ± 3.7 μL, P = 0.87), with a mean difference of 4.8% ± 3.3%.
The percentage SDs normalized to the mean cardiac output, cardiac index, and stroke volume were 10% ± 6%, 8% ± 5%, and 4% ± 2%, respectively (Fig. 5), when all measurements, up to 4 per mouse, were included. The heart rate displayed a mean percentage SD of 13% ± 9%.

Results of repeated measurements of heart rate (A), cardiac output (B), and stroke volume (C) in 5 mice.
Dobutamine stimulation produced, as anticipated, a statistically significant increase in heart rate, from 423 ± 50 beats/min to 603 ± 30 beats/min (mean increase, 43.4% ± 12.2%, P = 0.002; Fig. 6A). This increase was less pronounced than the increase in cardiac output, from 18.5 ± 1.9 mL/min at baseline to 32.0 ± 4.2 mL/min during dobutamine stress (mean increase, 74.1% ± 24.9%, P = 0.008; Fig. 6B). The average stroke volume increase, from 43.8 ± 2.3 μL to 53.1 ± 6.3 μL, was not statistically significant (P = 0.08; Fig. 6C).

Individual changes in heart rate (A), cardiac output (B), and stroke volume (C) from baseline to dobutamine stress in 4 mice.
DISCUSSION
The findings of the current study demonstrate that high-temporal-resolution PET affords the use of well-established concepts such as the Stewart-Hamilton tracer dilution principle to the study of the cardiovascular system in mice. Furthermore, estimates of cardiovascular function, such as cardiac output and LV stroke volumes, are reproducible and accurately identify changes in LV function in response to known pharmacologic interventions.
Technical Considerations
Rebinning of the list-mode image data into only 0.3 s image frames produced several images that clearly depicted the first transit of the radiotracer through the central circulation in mice. Radiotracer activities as high as 44 MBq or as low as 8 MBq of 18F-FDG yielded images of good diagnostic quality and concurrently allowed the generation of first-pass radiotracer blood concentration curves for the RV and LV.
Instead of reconstructing the images with the maximum a posteriori algorithm (28,29), we used filtered backprojection in the current study, for 2 reasons: First, reconstruction of 30 serial image sets is computationally highly intensive and requires less time with filtered backprojection than with iterative algorithms. Second, the spatial resolution achieved with filtered backprojection was adequate in the current study. As evident on the serial images, there was relatively little cross contamination of radioactivity between the RV and the LV time–activity curves.
Critical for the measurement of cardiac output in the current study were the amount of radiotracer injected and the radiotracer concentrations in blood. Different from the standard approach of determining the injected radioactivity in a dose calibrator, the total injected radioactivity was determined in the current study from the whole-body counts derived from the cylindric VOI covering the entire 7.6-cm-long field of view of the small-animal PET scanner and thus the whole body of the mouse. The maximum activity recorded within the first 2–4 s after radiotracer injection reflected the tracer activity delivered into the circulation and was used as the estimate of the total injected dose. By using this approach, we eliminated the need for corrections of residual activity in the intravenous injection system or for conversion of well counter–derived ex vivo counts into PET counts.
In some studies, we observed that whole-body activity continued to increase, though only slightly, after the early “plateau.” This increase was most likely related to radiotracer infiltration at the site of the tail vein injection. Because the tail of the mouse was outside the field of view, this activity was registered by the whole-body VOI only after its release from soft tissue into the circulation. Because cardiac output was determined from the amount of radiotracer injected into the vascular system at the time of the initial bolus transit, the delayed rise in total recorded activity was unlikely to have affected the measurements.
Determination of the radiotracer concentrations in blood during the bolus transit required correction for partial-volume–related underestimation. This correction can be achieved through measurements of the LV via echocardiography or MRI. Cardiac and respiratory motion, however, limits the accuracy of these measurements for partial-volume correction. The recovery coefficient was therefore estimated in the current study from a 4-dimensional phantom that accounts for cardiac and respiratory motion and that simulated the “effective” partial volume in a 16-wk-old male C57BL/6 mouse. Because heart volumes tend to vary only slightly among adult mice older than 2 mo (30), the application of the phantom-derived recovery coefficients to the animals in the current study seems justified. The close agreement between the in vivo PET-measured blood concentrations and the ex vivo–measured blood concentrations supports the validity of the phantom-based corrections of LV blood-pool activity for partial volume.
The procedure and measurements are independent of the radiolabeled compound injected; therefore, any imaging probe could potentially be used to obtain these measurements. Other isotopes, with a greater positron range (such as 11C or 13N), or with multiple emission characteristics (such as 124I or 64Cu), could potentially be used. Further investigations are warranted on the effect on the quantitative data of using isotopes with a greater positron range to decrease image resolution. When repeated injections of isotopes with a physical half-life shorter than that of 18F were used, the variability of measurements could be determined in a single imaging session.
Parameters of Cardiovascular Function
Although the estimates of cardiac output and stroke volume were not independently validated in this study, they were consistent with those derived from gated MRI in the same strain of animals of similar body weight (19). Cardiac output and stroke volumes in those studies averaged 19.1 ± 1.1 mL/min and 40.0 ± 2.2 μL, as compared with 20.4 ± 3.4 mL/min and 45.0 ± 6.9 μL in the current study. They were, however, higher than those in other MRI investigations or in studies using intraventricular conductance catheters and flow probes (18,30,31). Besides being related to differences in body weight, strain of animals, and anesthesia, the lower values in those studies may have been related also to the invasiveness of intraventricular conductance catheters and perivascular flow probes.
An important aspect of the current study is the reproducibility of the measurements of cardiac output and stroke volumes, which is important for long-term longitudinal studies. Because of the 110-min physical half-life of 18F, measurements could not be repeated in same study session but were repeated 2–14 d later. The observed differences between measurements included both measurement errors and changes in the physiologic state of the animals as indicated by differences in heart rate. When the cardiac output was normalized for heart rate, the resulting stroke volumes varied less. The stroke volume displayed a mean percentage SD of only 4%, compared with a 10% SD for cardiac output, indicating a significant influence of heart rate variability on the variability in measurements of cardiac output. When the different physiologic conditions of the animals were considered, the measurement variability of cardiac output and index was acceptable and in the range of echocardiography in mice (32).
Infusion of dobutamine in the current study raised the cardiac output by an average of 74% ± 25% from baseline. This increase was considerably higher than the 37.5% increase observed by Gao et al. (18) by perivascular flow probe. This lower increase in cardiac output might be explained by a lower dobutamine dose of only 18 μg/kg of body weight intravenously over 60 s. Also, the lower dose led to a lower increase in heart rate, from 417 ± 11 to 518 ± 15 per minute, or 24%, as compared with 43% in this study. The use of a type of anesthesia different from that used in our study may also have played a role.
Wiesmann et al. (19) found a 24% increase in cardiac output as determined by MRI and a 33% increase in heart rate after intraperitoneal injection of a relatively high dose of 1,500 μg/g. Here, the bioavailability of dobutamine and the effect of high amounts of dobutamine on adrenergic receptors other than β1 remain unclear. Using an administration protocol similar to that in this study, with a maximum dose of 24 μg/min/kg of body weight, Naumova et al. (33) found a similar 39% increase in heart rate from baseline to stress. The cardiac output was not determined.
CONCLUSION
In this study, we demonstrated that it is possible to noninvasively determine parameters of cardiovascular function in mice from the first 9 s of dynamic small-animal PET list-mode data. The method requires only a bolus injection of a tracer into the tail vein after the start of image acquisition, with image reconstruction involving short frames of 0.3 s. We were able to determine cardiac output, cardiac index, and stroke volume as important parameters of cardiovascular function. Significant changes in cardiac output and cardiac index in response to dobutamine infusion were measured. Because the method described is conceptually independent of the tracer used, it is possible to add information about cardiovascular parameters to the metabolic and molecular information obtained by small-animal PET without involving other imaging modalities such as MRI and echocardiography.
Acknowledgments
This work was partly supported by the Department of Energy cooperative agreement DE-FC03-02ER63420 and by the National Institutes of Health grants RO1-EB001943 and R24 CA 92865. We acknowledge the contributions of Dr. Nagichettiar Satyamurthy at the UCLA cyclotron unit for FDG preparation and Patrick Chow, Judy Edwards, and Victor Dominguez at the UCLA Crump Institute for Molecular Imaging for technical assistance. We also thank David Truong and Dat Vu for handling and archiving the data.
References
- Received for publication September 2, 2005.
- Accepted for publication March 3, 2006.


Jump to section
Related Articles
Cited By...
- Haptenic adducts of {beta}-lactam antibiotics elicit antibody responses with narrow clonality and specificity
- Measuring kinetics and metastatic propensity of CTCs by blood exchange between mice
- The HMGB1-RAGE axis mediates traumatic brain injury-induced pulmonary dysfunction in lung transplantation
- Small-Animal Molecular Imaging Methods
- Quantification of Left Ventricular Volumes and Ejection Fraction in Mice Using PET, Compared with MRI
- Estimation of the 18F-FDG Input Function in Mice by Use of Dynamic Small-Animal PET and Minimal Blood Sample Data