


Abstract
PET has become an important noninvasive imaging technique in cardiovascular research for the characterization of mouse models in vivo. This modality offers unique insight into biochemical changes on a molecular level, with excellent sensitivity. However, morphologic and functional changes may be of equal importance for a thorough assessment of left ventricular (LV) pathophysiology. Although echocardiography and MRI are widely considered the imaging techniques of choice for the assessment of these parameters, their use with PET considerably increases study complexity and decreases cost- and time-efficiency. In this study, a novel method for the additional quantification of LV volumes and ejection fraction (EF) from PET was evaluated using cardiac MRI as the reference method. Methods: The radiolabeled glucose derivative 18F-FDG was injected into 33 mice (6 mice with previous permanent occlusion of the left anterior descending artery [LAD], 15 mice with a temporary 30-min occlusion of the LAD, and 12 mice without previous surgery). 18F-FDG uptake within the LV myocardium was measured using a dedicated small-animal PET scanner. After we reconstructed the images into 16 electrocardiogram (ECG)-gated frames, we determined the LV cavity volumes in end-diastole (EDV) and end-systole (ESV) and the EF using a semiautomatic segmentation algorithm based on elastic surfaces. A 6.3-T cardiac MRI examination was performed in the same animals using an ECG-triggered and respiratory-gated multislice cine sequence. The MR images were segmented with a semiautomatic algorithm using commercially available software. Results: Overall, measurements from PET agreed well with those obtained by MRI. Mean EDV and ESV were slightly overestimated by PET (86 ± 43 μL and 44 ± 42 μL), compared with MRI (73 ± 44 μL and 41 ± 46 μL); mean (±SD) EF was similar (PET, 55 ± 19 μL; MRI, 54 ± 18 μL). Correlation between PET and MRI was excellent for EDV (0.97) and ESV (0.96) and good for EF (0.86). The slope of the regression line was nearly perfect for EDV (0.98) and EF (1.01) and slightly below 1 for ESV (0.90), indicating a good separation of abnormal and normal values with PET. The y-intercept was above zero for EDV (15 μL) and ESV (7 μL) and near to zero for EF (0.2%). Conclusion: The quantification of LV volumes and EF in mice with PET is both efficient and accurate. This method allows for combined molecular and functional imaging of the left ventricle within a single scan, obviating additional sophisticated MRI in many cases.
- cardiology (basic/technical)
- correlative imaging
- animal imaging
- cardiac function
- magnetic resonance imaging
- mice
- murine
- positron emission tomography
Mouse models of cardiovascular diseases are important to the study of phenotypic expression of gene defects and to the study of the effects of interventions and therapy. PET offers the unique opportunity to assess changes of biochemical processes on a molecular level, with high sensitivity. Myocardial perfusion, metabolism, innervation, and gene expression count among the many biochemical systems accessible with PET (1). Despite the challenges posed by the small body size of a mouse, several cardiac studies assessing the left ventricular (LV) myocardium have been successfully performed in these animals, using dedicated high-resolution small-animal PET systems (2–4).
However, in many cases the additional evaluation of changes of LV anatomy and function are of equal importance for the understanding of heart disease. Important global parameters are end-diastolic and end-systolic volumes of the LV cavity (EDV and ESV, respectively) and the LV ejection fraction (EF). Although imaging modalities such as echocardiography and MRI are widely considered to be the techniques of choice for the evaluation of LV anatomy and function, their use, combined with molecular imaging with PET in the same animals, increases study complexity and decreases efficiency. Therefore, the assessment of LV anatomy and function with PET would be highly desirable.
Computer programs for the accurate evaluation of EDV, ESV, and EF in humans with electrocardiogram (ECG)-gated SPECT and, to a lesser extent, with PET have been developed and validated in recent years (5–10). First results in rats and mice have also been reported for SPECT (11–13). A proof-of-principle study in 2 mice with PET has been reported by Yang et al. (14). However, a thorough validation study for the accurate assessment of global functional parameters such as EDV, ESV, and EF in mice with PET has not yet been reported.
This work investigated the efficiency and accuracy of a PET-based method for the assessment of LV volumes and EF in mice. Cardiac 6.3-T MRI, using an ECG-triggered and respiratory-gated, fast-low-angle-shot cine sequence, served as the reference method. MRI is regarded by many as the current gold standard for functional cardiac assessment. The PET-based methodology consisted of ECG-gated image acquisition, together with an automated segmentation algorithm based on an elastic surface model. Among the mice included in the study were those with a varying degree of myocardial infarction, which is known to pose a challenge to LV segmentation algorithms used on PET images.
MATERIALS AND METHODS
Animals
Three groups of mice with identical genetic background (C57Bl6; n = 33 animals) were scanned with both PET and MRI. The mice were assigned to groups as follows: those mice that had undergone permanent ligation of the left anterior descending (LAD) branch of the left coronary artery (group 1, 6 animals), those mice that had undergone a temporary 30-min occlusion of the LAD (ischemia–reperfusion; group 2, 15 animals), and those mice that had undergone no prior intervention (group 3, 12 animals). Mice underwent surgery at 2.5 mo old, and imaging started 12–14 d later. The MRI examination was performed first, followed by PET within 2–4 d. The animals were kept on a normal diet suitable for mice.
The local ethics committees and the local authorities of both institutes approved the study, which was conducted in compliance with institutional guidelines.
Data Acquisition
PET.
PET was performed using a near-millimeter–resolution dedicated small-animal PET system (32-module quadHIDAC; Oxford Positron Ltd.), which uses wire chamber detectors and offers an almost uniform spatial resolution (15–17). The quadHIDAC scanner consists of 4 stacks of 8 detector modules each, positioned perpendicularly to each other and enclosing a cuboid field of view. Additionally, this setup rotates around the axial direction to improve homogeneity; a 180° rotation takes 6 s before the direction of rotation is reversed for the next 6 s. All emission data were recorded and stored as a stream of list-mode data that preserved detailed information about each detected coincidence event, such as time of occurrence and location of impact on the detectors for both emitted photons.
Data were acquired with the mouse in a prone position on a heating pad, to maintain a body temperature within the reference range. Cardiac excitation was recorded and stored throughout the scan, with precise time synchronization toward the emission data. All vital parameters were measured with a dedicated system (BioVet, Spin Systems Pty Ltd.). The temperature was measured rectally, ECG electrodes were placed on both forepaws and the left hindpaw, and respiration was measured with a small pressure detector attached to the mouse. The nonfasted animals were anesthetized by inhalation of isoflurane (1.5%) and then intravenously injected with 18F-FDG (∼10 MBq) in 100 μL of saline solution. Under these conditions, a good myocardial radiotracer uptake can be expected (18).
One hour after the 18F-FDG injection, data acquisition was started. List-mode data were acquired for 30 min. After acquisition, all image data were sorted into 16 gates of equal length, representing the different phases within the cardiac cycle determined from the ECG (19). Abnormal cardiac beats, caused either by arrhythmia or by insufficient ECG signal quality, were discarded from reconstruction. All gates were separately reconstructed into an image volume of 110 × 60 × 20 mm and a voxel size of 0.4 × 0.4 × 0.4 mm, using a resolution recovery reconstruction algorithm (20) leading to an effective resolution of 0.7 mm (full width at half maximum).
MRI.
An MRI scan was performed on a 6.3-T horizontal-bore small-animal scanner (BioSpec; Bruker BioSpin MRI GmbH) equipped with 400 mT/m gradients, using the manufacturer-supplied Paravision 3.0.2 software. A quadrature-driven birdcage coil (Rapid Biomedical), with an inner diameter of 3.2 cm, was used for transmission and reception. After we anesthetized the mice, they were placed in a supine position in a dedicated mouse cradle that contained the anesthesia mask, the ECG leads, the respiratory sensor, and a heating pad.
A stack of short-axis slices covering the heart from the apex to the base and 2 orthogonal long-axis slices were acquired with an ECG-triggered and respiratory-gated cine gradient-echo fast-low-angle-shot sequence with the following parameters: gaussian-shaped 300-μs radiofrequency pulse; flip angle, 15°; repetition time, 7 ms; echo time, 2.3 ms; sample rate, 100 kHz; echo position, 30%; field of view, 3 × 3 cm; matrix size, 192 × 192; in-plane pixel dimensions, 156 × 156 μm; slice thickness, 1 mm; 6 averages. Depending on heart rate, this resulted in 14–20 frames per cardiac cycle for the short-axis and long-axis cine acquisitions. The resulting acquisition time per slice was approximately 5 min. Seven short-axis slices were acquired from the apex to the base to cover the whole heart.
Data Processing
PET.
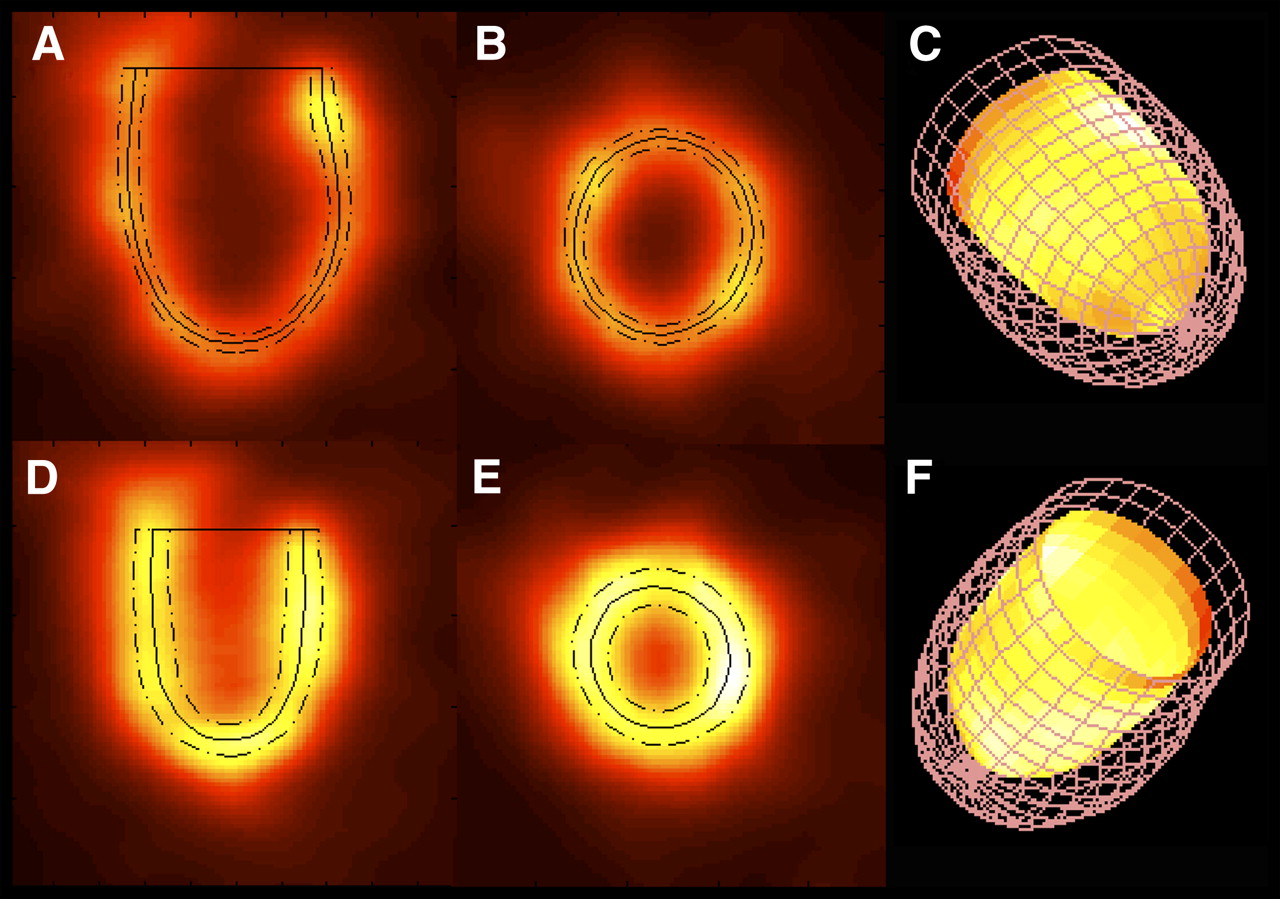
The PET images were processed using in-house software programmed in MATLAB (The Mathworks) and in C programming language to obtain EDV, ESV, and EF values. The automated 3-dimensional segmentation algorithm used to identify the endocardial contours as the basis for the volume calculations is described in detail elsewhere (9,10,21,22). In brief, the LV long-axis orientation and the locus of the valve plane have to be specified interactively. The valve plane is perpendicular to the LV long-axis orientation and axially located at the basal onset of myocardial activity. Specification requires less than 30 s for an experienced user. Subsequent calculations are performed without user interaction. The mid-myocardial contour for every gate is mathematically represented in 3 dimensions as an elastic surface whose shape is governed by the distribution of tracer activity within the PET image data. Myocardial tracer activity is the origin of a field of force that regionally attracts the contour toward the center of the myocardium. Gaps in tracer distribution are bridged by means of model-inherent constraints. The regional thickness of the myocardium is calculated similarly for every gate. Now the attractive field of force emanates from the activity gradient in relation to the already determined mid-myocardial contour. That the total myocardial volume has to be the same for all gates serves as an additional constraint. The endocardial contour was calculated from the mid-myocardial contour and the regional wall thickness for end-diastole and end-systole to give EDV and ESV in microliters and EF in percentage. Myocardial contours as derived by the segmentation algorithm are shown in Figure 1 for a mouse from the nonintervention group.

Mid-ventricular (solid line) and endo- and epicardial contours (dashed lines) derived by LV segmentation algorithm are superimposed on end-diastolic and end-systolic long-axis (A and D, respectively) and short-axis (B and E) PET images. Additionally, 3-dimensional representation of endocardial contour at end-systole (solid surface with color-coded 18F-FDG uptake) and at end-diastole (meshgrid) is shown from inferior (C) and anterior (F) views.
Additionally, transmural infarct size in relation to myocardial surface area (MSA) was determined for all mice from the PET data, as described previously (22).
Statistics
Analysis was performed using standard statistical software (JMP 5.1; SAS Institute Inc.). Mean values for EDV, ESV, and EF obtained by either PET or MRI are given together with the SD. Values obtained by PET and MRI were compared by using the paired Student t test. The agreement of the PET- and MRI-based calculation of the above parameters was additionally analyzed by calculating the Pearson correlation coefficient (R) and orthogonal regression (equal variances). Intercept and slope were calculated according to the method of Cornbleet and Gochman (25), using orthogonal regression. Orthogonal regression finds a line of best fit for a set of related data and accounts for error in both the abscissa and the ordinate. The ratios of the mean difference of paired measurements over their averages were calculated to test the agreement between the 2 measurements according to Bland and Altman (26).
RESULTS
Animal Characteristics
Animal weight, heart rates during MRI and PET, and infarct sizes as measured by PET are given in Table 1. Animal weight was slightly higher at the time of the PET measurement than at the time of MRI measurement for all 3 groups of mice. Heart rates were comparable.
Animal Characteristics
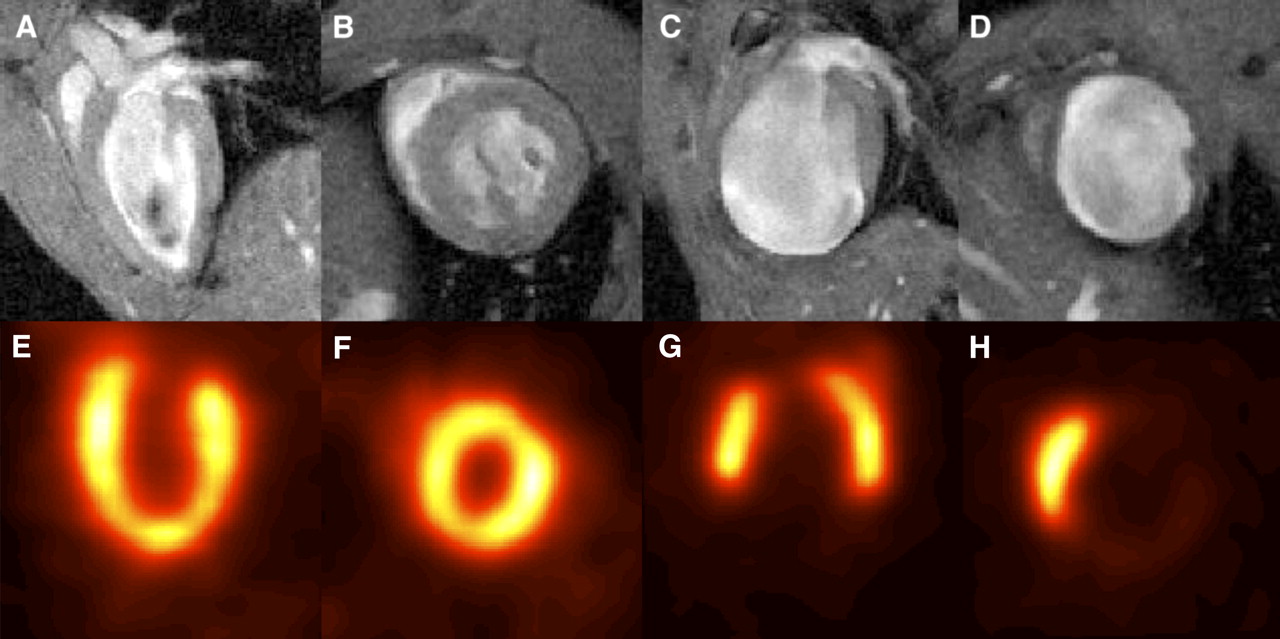
Relevant transmural infarctions ranging up to 60% of the MSA developed in animals from the occlusion group, except for 1. In this case, surgical occlusion proved to be ineffective. In 2 mice from the ischemia–reperfusion group, relevant transmural infarctions (>40% MSA) developed, and the other animals showed no relevant transmural infarction (<4% MSA). No animal of the control group revealed transmural infarction, as was expected. PET and MR images of mice with and without a transmural infarction are shown in Figure 2.

MRI (top) and PET (bottom) images of mouse without infarction (A, B, E, and F) and of mouse with extended infarction (C, D, G, and H). Shown are mid-ventricular long-axis (A, C, E, and G) and short-axis (B, D, F, and H) images. One end-diastolic gate was used for PET image reconstruction.
Comparison of Mean Values for PET and MRI
EDV, ESV, and EF mean values as derived by PET and MRI are given in Table 2 (for the complete group of animals and for the 3 subgroups separately).
Mean Values for EDV, ESV, and EF Measured with PET, Compared with MRI
EDV and ESV mean values as obtained from PET were somewhat higher than the MRI-based values (in the case of EDV, this difference is statistically significant), except for the occlusion group, in which ESV measured by MRI was marginally higher.
The EF mean values as obtained by PET were comparable to the MRI-based values for EF.
Correlation and Regression Analysis
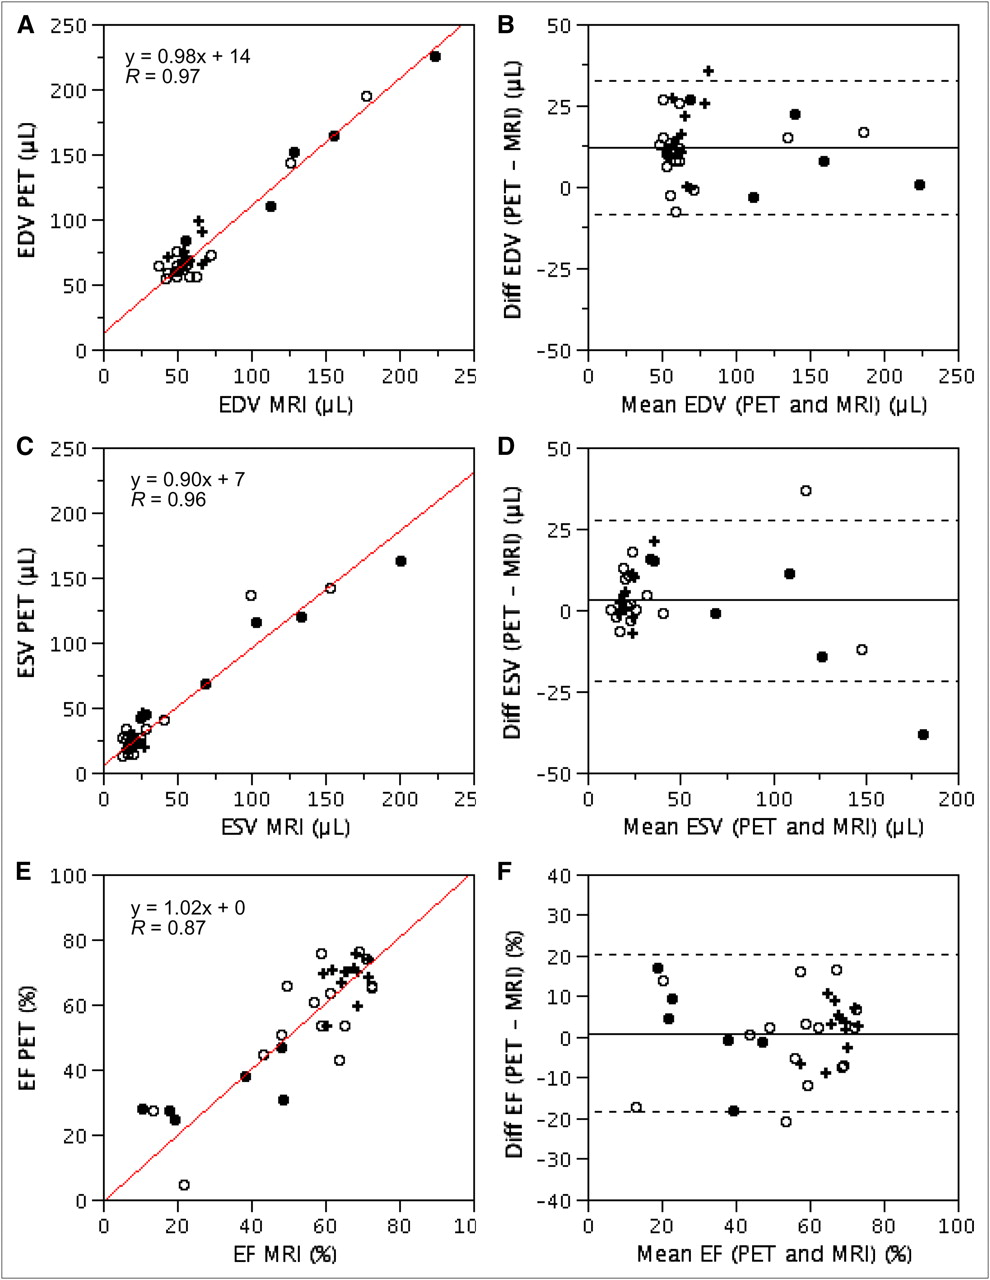
In Figure 3, the individual values for EDV, ESV, and EF derived by PET and MRI are displayed as a scatter plot. Results from correlation and regression analyses are provided also. Analysis for the agreement of measurements according to Bland and Altman (26) is displayed in Figures 3B, 3D, and 3F. The results from all 33 animals are included. The scatter around the regression line is tight for EDV and ESV over the whole range of values. Correlation between PET and MRI was good for both EDV and ESV, the slope of the regression curve was nearly 1 (EDV) or slightly lower (ESV), and the y-intercept was above zero in all cases. Most difference values lie within ±2 SDs around the mean in the Bland–Altman plot. Scatter around the regression line was considerably higher for EF. Especially low EFs, which correspond to hearts with large infarctions, are overestimated by PET. Correlation between PET and MRI was good, and the slope and y-intercept of the regression curve were nearly optimal.

Correlation and orthogonal regression analysis for EDV (A), ESV (C), and EF (E) calculated by PET and MRI. Scatter plot and regression line are displayed; slope and y-intercept of regression curve and R value are provided in inserts. Values are shown for occlusion group (•), for ischemia–reperfusion group (○), and for control group (+). Agreement analysis of PET and MRI according to Bland–Altman for EDV (B), ESV (D), and EF (F) is displayed. Difference (diff) of measurements obtained by PET and MRI is plotted against mean. Solid horizontal line is located at mean value; dashed lines are located 2 SDs above and below mean.
DISCUSSION
The objective of this study was to determine the applicability and accuracy of ECG-gated 18F-FDG PET for the assessment of global LV function in mice. ECG-gated 18F-FDG PET would enable a time- and cost-efficient evaluation of both molecular and anatomic–functional parameters with a single imaging modality and, additionally, under the same physiologic conditions.
The results of this study clearly show that EDV, ESV, and EF measurements in mice can be obtained accurately with PET over a wide range of values (MRI is taken as the gold standard). We used groups of mice that are a particular challenge to image with gated PET. The mice were small and had, in part, large transmural myocardial infarctions. Left ventricles with extended infarctions may not leave enough signal for an accurate determination of the myocardial contours, so that an error is to be expected. Nevertheless, these hearts were classified as highly enlarged and with poor function by both PET and MRI. Functional evaluation with PET is fast, requiring only several seconds of additional processing time without lengthening the scan, which was in strong contrast to the considerable time requirement of an additional MRI scan. The mean values for EDV, ESV, and EF; R values; and parameters of the lines of regression obtained for mice compare favorably with values obtained in patients using SPECT with the same segmentation algorithm and with the 2 commercially available analysis software packages, 4DM-SPECT and QGS (10). The segmentation algorithm showed a slight overestimation of EDV and ESV in comparison to MRI, similar to the patient data, and a near-optimal correspondence to MRI for the evaluation of EF. PET in general, and especially in mice, is hampered by a relatively limited resolution in comparison to the LV wall thickness (27). This effect is likely a contributing factor to the deviation between PET and MRI in this study. It would be possible to adjust wall-thickness calculations within the segmentation algorithm to the resolution of the imaging equipment in comparison to myocardial thickness; however, adjustment is not warranted given the small deviation and the additional complexity that this would introduce into the analysis. It is a general consensus for human studies that values obtained with different segmentation algorithms are not interchangeable, and separate adapted normal values should be used (28). Also, EDV, ESV, and EF values obtained with gated PET in mice cannot be interchanged with those obtained with MRI, as was shown in this study. This result, again, is not surprising, given the results of studies performed in humans.
Even though MRI is often considered the gold standard for the assessment of LV volumes and function, measurements of EDV, ESV, and EF are not without error and depend on the analysis software (23,29,30). Because MRI works on a stack of 2-dimensional slices and not on a true 3-dimensional dataset, the assessment of LV shortening can be a problem. Because both PET- and MRI-derived data are associated with a measurement error, orthogonal regression—instead of the simpler linear regression—was used for the analysis in this study. The relative variances of the PET-based analysis methodology and MRI are unknown and were assumed equal in this study. This assumption may not be correct and may be an oversimplification. However, a deviation from this assumption would change only the slope and y-intercept of the regression curve, leaving the findings of this study intact, even if the ratio of variances of PET and MRI approaches infinity (i.e., assuming zero variance for MRI). In that case, the orthogonal regression is identical to the linear regression.
In this study, MRI and PET were performed sequentially and not simultaneously as would be possible with integrated PET and MRI devices. Therefore, the pathophysiology of the animals may have been different between the 2 scans, even though every effort was made to obtain comparable study conditions (e.g., by using a common anesthesia protocol). First, animals were older (2–4 d at the time of PET) and slightly heavier, which might be a physiologic reason that accounts for part of the larger EDV and ESV measured by PET. Second, ongoing remodeling after myocardial infarction between the MRI and PET measurements may have altered LV size and function; however, MRI and PET were performed at a time after surgery when these changes can be considered small (31). The use of an integrated PET and MRI device would be an improvement in the future. The device must, however, have a resolution similar to the high-resolution PET scanner used in this experiment to yield similar data quality.
To our knowledge, this is the first study to validate the PET-based assessment of LV volumes and EF in a relevant number of mice. Yang et al. have used gated PET for the calculation of LV volumes and EF in 2 mice as a proof-of-principle study (14). Kreissl et al. have used dynamic PET with a bolus injection of 18F-FDG for the assessment of cardiac output and stroke volume in mice using the Stewart–Hamilton method, an approach that can be an alternative to gated PET with LV segmentation for the analysis of cardiac function (32). Croteau et al. have validated gated PET against echocardiography in rats, a considerably bigger animal (33). Pinhole-gated SPECT with imaging of the myocardium or the blood pool has been used in both rats and mice for this purpose (11–13).
The potential of MRI for analysis of cardiac function reaches far beyond the global parameters (LV volumes and EF) evaluated within this study. As an example, tagging techniques can reveal complex regional contraction patterns. Additionally, regional blood flow as another important parameter of cardiovascular function can be visualized and even quantified with MRI. Therefore, a combination of PET and MRI can still provide far more information than can PET alone. Thus, the choice between the efficient PET-only technique and the highly sophisticated but time-consuming PET and MRI method for molecular-functional imaging will have to based on the aims and design of an experiment.
CONCLUSION
Accurate determination of end-diastolic and end-systolic LV volumes and EF with PET in mice is possible. A combination of molecular and functional data can be derived from a single PET study, leading to a time- and cost-efficient evaluation of the LV status. PET-based functional analysis can be a valuable alternative to an additional sophisticated MRI scan, especially for serial scanning of a larger number of animals in which time efficiency is crucial.
Acknowledgments
We thank Dr. Gregor Theilmeier, Institute of Anatomy and Department of Anaesthesiology, University of Münster, Germany, for his assistance in preparation for the animal surgery and Dirk Bürger of the Institute of Anatomy, University of Münster, Germany, and Peter Leenders, Department of Pharmacology and Toxicology, Cardiovascular Research Institute Maastricht, Maastricht University, the Netherlands, for performing the animal surgery. We also thank Dr. Uta Schnöckel, Dr. Sven Hermann, Christine Bätza, Anne Kanzog, and Sandra Schröer of the Department of Nuclear Medicine, University Hospital Münster, Münster, Germany, for help with the animal handling and PET image acquisition; Katharina Büscher and Thorsten Budumlu for data processing; and the staff of the cyclotron and radiochemistry facilities, University Hospital Münster, Münster, Germany, for radiotracer preparation. This work was supported by grants from the Deutsche Forschungsgemeinschaft (DFG), Sonderforschungsbereich 656 Münster, projects B3, PM3, and Z2; the Besluit Subsidies Investeringen Kennisinfrastructuur (BSIK) program, entitled “Molecular Imaging of Ischemic Heart Disease” (project number BSIK03033); and the European Union sixth framework Network of Excellence Diagnostic Molecular Imaging (DiMI), contract LSHB-CT-2005-512146.
Footnotes
-
↵* Contributed equally to this work.
-
COPYRIGHT © 2009 by the Society of Nuclear Medicine, Inc.
References
- Received for publication July 21, 2008.
- Accepted for publication October 23, 2008.


Jump to section
Related Articles
Cited By...
- Imaging Reveals the Connection Between Spontaneous Coronary Plaque Ruptures, Atherothrombosis, and Myocardial Infarctions in HypoE/SRBI-/- Mice
- In Vivo Labeling of Serum Albumin for PET
- Evaluation of Mouse Tail-Vein Injections Both Qualitatively and Quantitatively on Small-Animal PET Tail Scans
- Isochronous Assessment of Cardiac Metabolism and Function in Mice Using Hybrid PET/MRI
- Small-Animal Molecular Imaging Methods
- Molecular Magnetic Resonance Imaging of Myocardial Angiogenesis After Acute Myocardial Infarction