


Abstract
The ability to trace or identify specific molecules within a specific anatomic location provides insight into metabolic pathways, tissue components, and tracing of solute transport mechanisms. With the increasing use of small animals for research, such imaging must have sufficiently high spatial resolution to allow anatomic localization as well as sufficient specificity and sensitivity to provide an accurate description of the molecular distribution and concentration. Methods: Imaging methods based on electromagnetic radiation, such as PET, SPECT, MRI, and CT, are increasingly applicable because of recent advances in novel scanner hardware and image reconstruction software and the availability of novel molecules that have enhanced sensitivity in these methodologies. Results: Small-animal PET has been advanced by the development of detector arrays that provide higher resolution and positron-emitting elements that allow new molecular tracers to be labeled. Micro-MRI has been improved in terms of spatial resolution and sensitivity through increased magnet field strength and the development of special-purpose coils and associated scan protocols. Of particular interest is the associated ability to image local mechanical function and solute transport processes, which can be directly related to the molecular information. This ability is further strengthened by the synergistic integration of PET with MRI. Micro-SPECT has been improved through the use of coded aperture imaging approaches as well as image reconstruction algorithms that can better deal with the photon-limited scan data. The limited spatial resolution can be partially overcome by integrating SPECT with CT. Micro-CT by itself provides exquisite spatial resolution of anatomy, but recent developments in high-spatial-resolution photon counting and spectrally sensitive imaging arrays, combined with x-ray optical devices, hold promise for actual molecular identification by virtue of the chemical bond lengths of molecules, especially biopolymers. Conclusion: Given the increasing use of small animals for evaluating new clinical imaging techniques and providing more insight into pathophysiologic phenomena as well as the availability of improved detection systems, scanning protocols, and associated software, the sensitivity and specificity of molecular imaging are increasing.
Molecular imaging of the cardiovascular system, especially the heart wall, has long been the purview of radionuclide-based imaging. Applying imaging modalities in small animals can accelerate the development of new imaging markers and drugs as well as increase our understanding of pathophysiologic processes. Imaging in mice is important because of the widespread use of genetically engineered mice in biomedical research and the need to measure the in vivo anatomic and functional phenotypes of the mouse cardiovascular system. Advanced technologies developed for imaging in small animals can generally be translated directly for application to clinical scanners. High-resolution PET detectors and reconstruction methods are migrating from animal to human whole-body scanners and back again. Molecular probes developed and evaluated in small animals can typically be applied easily in large animal species and humans with similar injected activities. However, despite its exquisite sensitivity, PET has limited spatial and temporal resolution as well as poor anatomic context when the radionuclide accumulates selectively in one pathophysiologic compartment. Other imaging techniques, such as CT and MRI, have higher spatial and temporal resolution but are less sensitive and convey less specific molecular information. The following sections address approaches to improving the resolution, specificity, and context of several imaging modalities.
Advances in resolution are described first, and then a description of how multimodality imaging can enhance the accuracy and context of the resulting image data is provided.
ADVANCES IN SMALL-ANIMAL PET
PET is being used increasingly to advance the understanding of cellular and molecular processes that are altered in cardiovascular disease. Compared with other molecular imaging technologies, PET enables highly sensitive and quantitative measurements of biologic or biochemical processes in vivo through the specific labeling of organic compounds (or close analogs) with positron emitters, such as 11C and 18F (for OH−).
Currently, accurate attenuation correction with isotope transmission or CT (1,2) and list-mode acquisition allows the simultaneous reconstruction of subsecond-resolution first-pass dynamic (3) respiratory and electrocardiography (ECG) gated images in mice with a volumetric imaging field of view of greater than 10 cm and a reconstructed resolution close to 1 μL (4–6), as shown in Figure 1.
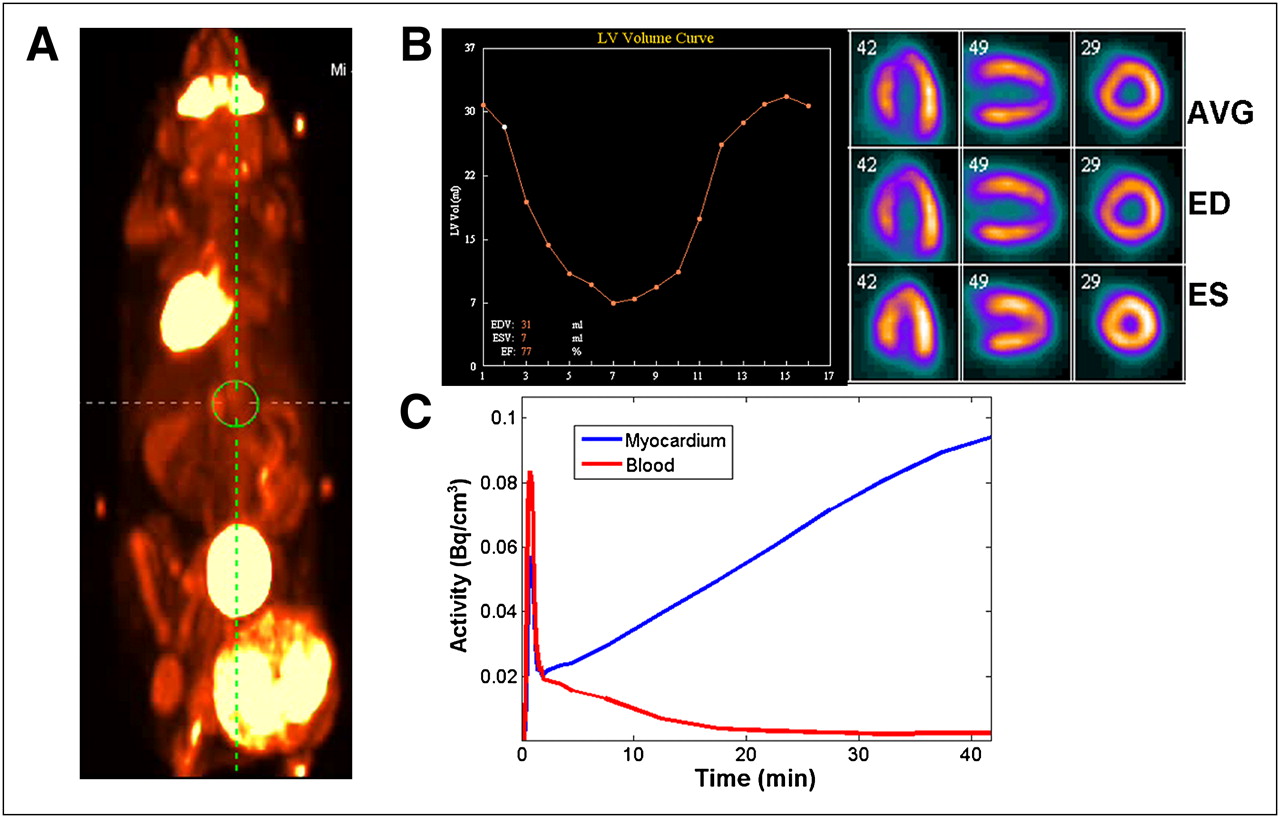
Small-animal PET images of 18F-FDG distribution in 25-g mouse. Whole-body (A), cardiac ECG gated (B), and cardiac dynamic (C) distributions can be obtained simultaneously with list-mode imaging. AVG = average; ED = end-diastole; EDV = end-diastolic volume; EF = ejection fraction; ES = end-systole; ESV = end-systolic volume; LV = left ventricular; Vol = volume. Whole-body image and cardiac dynamic data were from Inveon dedicated PET system (Siemens AG). ECG gated images from LabPET (Advanced Molecular Imaging) were provided courtesy of Roger Lecomte, Université de Sherbrooke.
New Detectors Improving Sensitivity and Dynamic Range
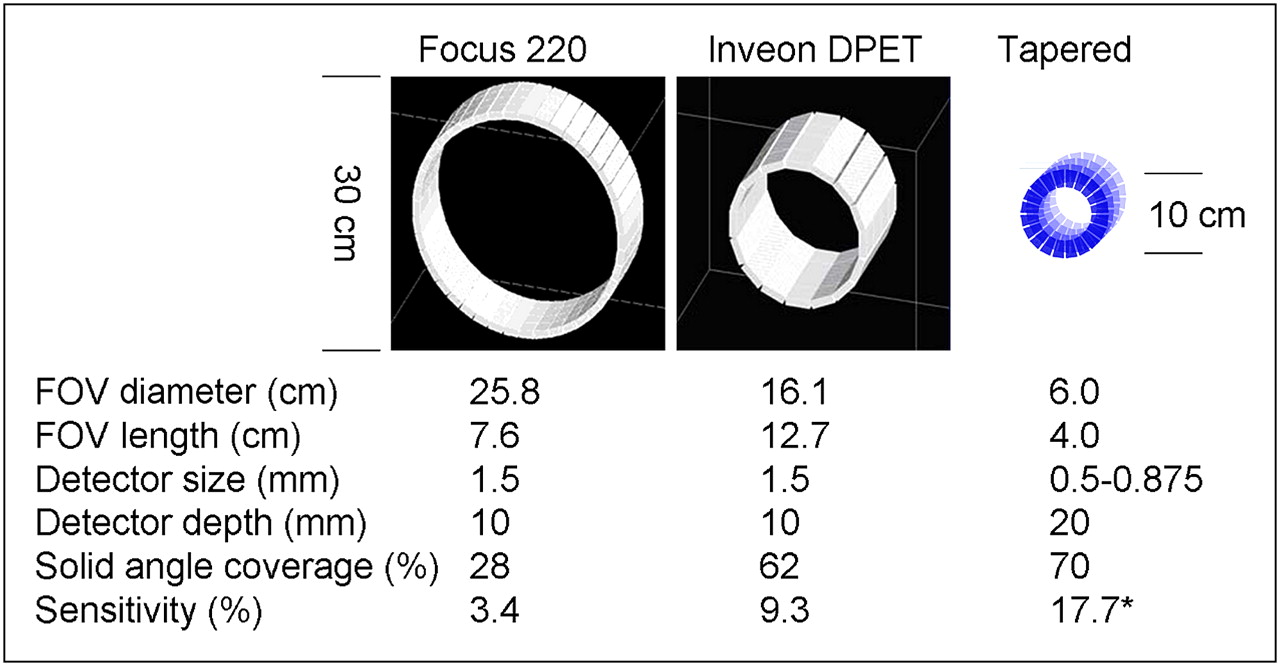
The image quality or signal-to-noise ratio (SNR) of reconstructed PET images is improving primarily through an increase in the number of recorded counts. A smaller detector ring diameter and a longer axial bore result in large solid-angle coverage, with approximately 10% absolute sensitivity available currently (4); this value is expected to increase in the next generation of scanners, as shown in Figure 2. Novel detector geometries, such as long tapered crystals (7), thick monolithic detectors (8), or edge-on designs (9), are increasing the detector packing fraction and photon absorption efficiency, with depth-of-interaction encoding for more accurate positioning and high-resolution image reconstruction. For optimal dynamic imaging of tracer kinetics, detectors with better timing resolution and faster decay, such as lanthanum bromide, lutetium aluminum perovskite, and lutetium fine silicate, coupled with avalanche photodiode (APD) or silicon photomultiplier parallel detector readouts (10), will help to maintain this sensitivity at high counting rates by minimizing random coincidences, detector dead time, and multiplexing losses (such as during first-pass dynamic imaging with subsecond temporal resolution).

Evolution of small-animal PET scanners for mouse imaging. Sensitivity is increased with solid-angle coverage and detector depth. *Value was based on simulation. FOV = field of view. Tapered detector design was provided courtesy of Sara St. James and Simon Cherry, University of California, Davis. (Focus 220 and Inveon dedicated PET [DPET] images reprinted with permission of (12).)
Advanced Image Reconstruction Improving Spatial Resolution
Spatial resolution is determined by detector size, ring diameter, positron range, detector interactions, and reconstruction smoothing (11) Submillimeter detectors are proposed for the next generation of small-animal PET systems, approaching the fundamental limits of the positron range (0.2–0.3 mm) for isotopes such as 18F and 11C. As the detector ring narrows and lengthens, parallax errors from oblique crystal penetration become more prominent but can be compensated for by use of image reconstruction methods that include detector point-spread-function (PSF) modeling to maintain uniform resolution across the field of view and accelerate convergence (12,13). Similarly, image reconstruction with positron-range modeling (14,15) can reduce the associated blurring effect, as shown in Figure 3.

(A) Detector PSF and positron-range (β+) modeling can be included in system matrix used for iterative image reconstruction. LOR = line of response (Modified with permission of (8).) (B) Relative to that obtained with filtered backprojection (FBP), improved image resolution was achieved by use of maximum a posteriori (MAP) reconstruction with PSF and positron-range modeling (MAPR). (C and D) With MAPR, renal cortex can be resolved clearly in mouse kidney (C), with validation of improved accuracy against ex vivo biodistribution (BioD) values (D). %ID/g = percentage injected dose per gram. 61Cu-PTSM mouse images from Focus small-animal PET (Siemens AG) were provided courtesy of Richard Laforest, Washington University.
This effect is significant for some blood flow tracers (0.5–2.5 mm for H215O, 62Cu-PTSM [pyruvaldehyde bis(N4-methylthiosemicarbazone)], and 82Rb) and nonstandard isotopes (such as 76Br, 89Zr, 86Y, 94mTc, and 124I) (14), compared with the 1-mm3 resolution of current commercial scanners with PSF reconstruction alone. These reconstruction methods require accurate computation of the system matrix with detector or isotope response functions for billions of projections and are being accelerated with more efficient Monte Carlo simulation codes, such as the electron gamma shower for PET (egsPET) program (16). The use of these complex system models (detector response, positron range, and physiologic response) is facilitated by dedicated reconstruction hardware, such as advanced graphic processing units, to yield high-resolution images with high throughput (17).
Integrated Physiologic and Anatomic Modeling to Improve Quantification
Physical confounding factors such as attenuation, scatter, and respiratory motion are less problematic in mouse imaging than in human studies (18), although rigid-body motion tracking is proving to be useful for conscious imaging in rats and mice (19). Factor analysis of dynamic image sequences with integrated tracer kinetic modeling removes operator bias in the selection of image-derived input functions and identifies physiologic temporal patterns in the tracer dynamics (20,21). Physiologic response models included in the system matrix allow fast parametric 4-dimensional image reconstruction of tracer uptake and clearance rates (22), effectively improving temporal resolution by reconstructing an integrated spatiotemporal dataset from all of the PET raw data instead of temporally independent dynamic frames, as shown in Figure 4. Hybrid PET/CT and PET/MRI can be used to define the anatomic distribution (spatial priors) corresponding to the target organs, thereby further improving spatial resolution and contrast recovery in submillimeter structures, as demonstrated recently in mouse cardiac imaging (23). These enhancements will continue to improve the sensitivity, precision, and quantitative accuracy of measured organ perfusion rates, receptor–ligand binding potentials, receptor density and occupancy levels, enzyme–substrate metabolic rates, and cell survival and proliferation rates obtained with small-animal PET.

(A) Parametric images of regional myocardial glucose uptake (rMGU) influx rate constant (Ki) in mouse after PSF reconstruction. (Simulated image reprinted with permission of (13).) (B) Input function and time-basis functions (tissue response) for fully 4-dimensional (4D) image reconstruction can be derived directly from PET raw data. (Reprinted with permission of (22).) (C) Recovery of temporal resolution (early 10-s frame) with 4D vs. conventional 3D reconstruction of 18F-FDG brain images from High Resolution Research Tomograph (Siemens AG). Images were provided courtesy of Andrew J. Reader, Montreal Neurologic Institute.
New Isotopes and Tracer Production for Expanded Availability
Short-lived PET isotopes are typically produced at an on-site (or nearby) cyclotron and radiochemistry laboratory for good-manufacturing-practice radiopharmaceutical production for use in humans. The increasing availability of longer-lived and generator-produced isotopes (such as 62Zn/Cu and 68Ge/Ga) is expanding the production and distribution of new tracers for PET. The development of minicyclotrons or tabletop cyclotrons combined with microfluidics (24) for on-site radiotracer production may substantially reduce the infrastructure needed for 11C and 18F radiochemistry and simultaneously provide the high specific activity and high activity concentration needed for low-dose and small-volume tracer injections in mice.
SMALL-ANIMAL MRI
Rationale
MRI is now a well-established modality for imaging of the cardiovascular system in mice. MRI provides several important measurements of structure, function, perfusion, and cellular and molecular events in mouse models of cardiovascular disease. Specialized hardware, including a high-field magnet, a high-performance gradient system, and appropriately sized radiofrequency coils, is important for achieving high-quality images and reasonable scan times. During imaging, the consideration of appropriate anesthesia and temperature control are also important, especially when assessing cardiovascular physiology and function. Also, as in human cardiovascular MRI, reliable ECG gating is critical for achieving high-quality images in mice. Because of its versatility in acquiring a variety of images, MRI is a powerful modality for determination of the cardiovascular phenotypes of genetically engineered mice and evaluation of novel targeted contrast agents.
Current MRI Methodology and Hardware
Specialized MRI hardware for mouse imaging includes high-field, small-bore magnets, gradient systems with rapid rise times and high amplitudes, and low-radiofrequency coils. Although cardiac MRI in small animals has been implemented with 1.5-T human whole-body systems (25), to improve the SNR, spatial resolution, and scan times, most research groups use higher-field, small-bore systems with high-performance gradients. Specifically, most studies have been performed at field strengths of 4.7–11.7 T, although in one recent study, impressive in vivo images were obtained at 17.6 T (26). The main advantage of increasing the field strength is a higher SNR, which can then be traded for improved spatial resolution or shorter scan times.
However, higher field strengths can lead to more image artifacts and reduced image contrast. Gradient systems with rapid rise times and high field strengths are required to support the small field of view required for mouse imaging. Also, radiofrequency coils of the appropriate size (diameters of ∼25–35 mm) are typically used to further improve the SNR. During MRI, mice are commonly lightly anesthetized with isoflurane or other anesthetics, and the core temperature is typically maintained near 36°−37° with circulating heated water or warm air. An electrocardiogram, rectal temperature, and respiration can be monitored during MRI studies with MRI-compatible systems for small animals (27).
MRI Scanning Protocols
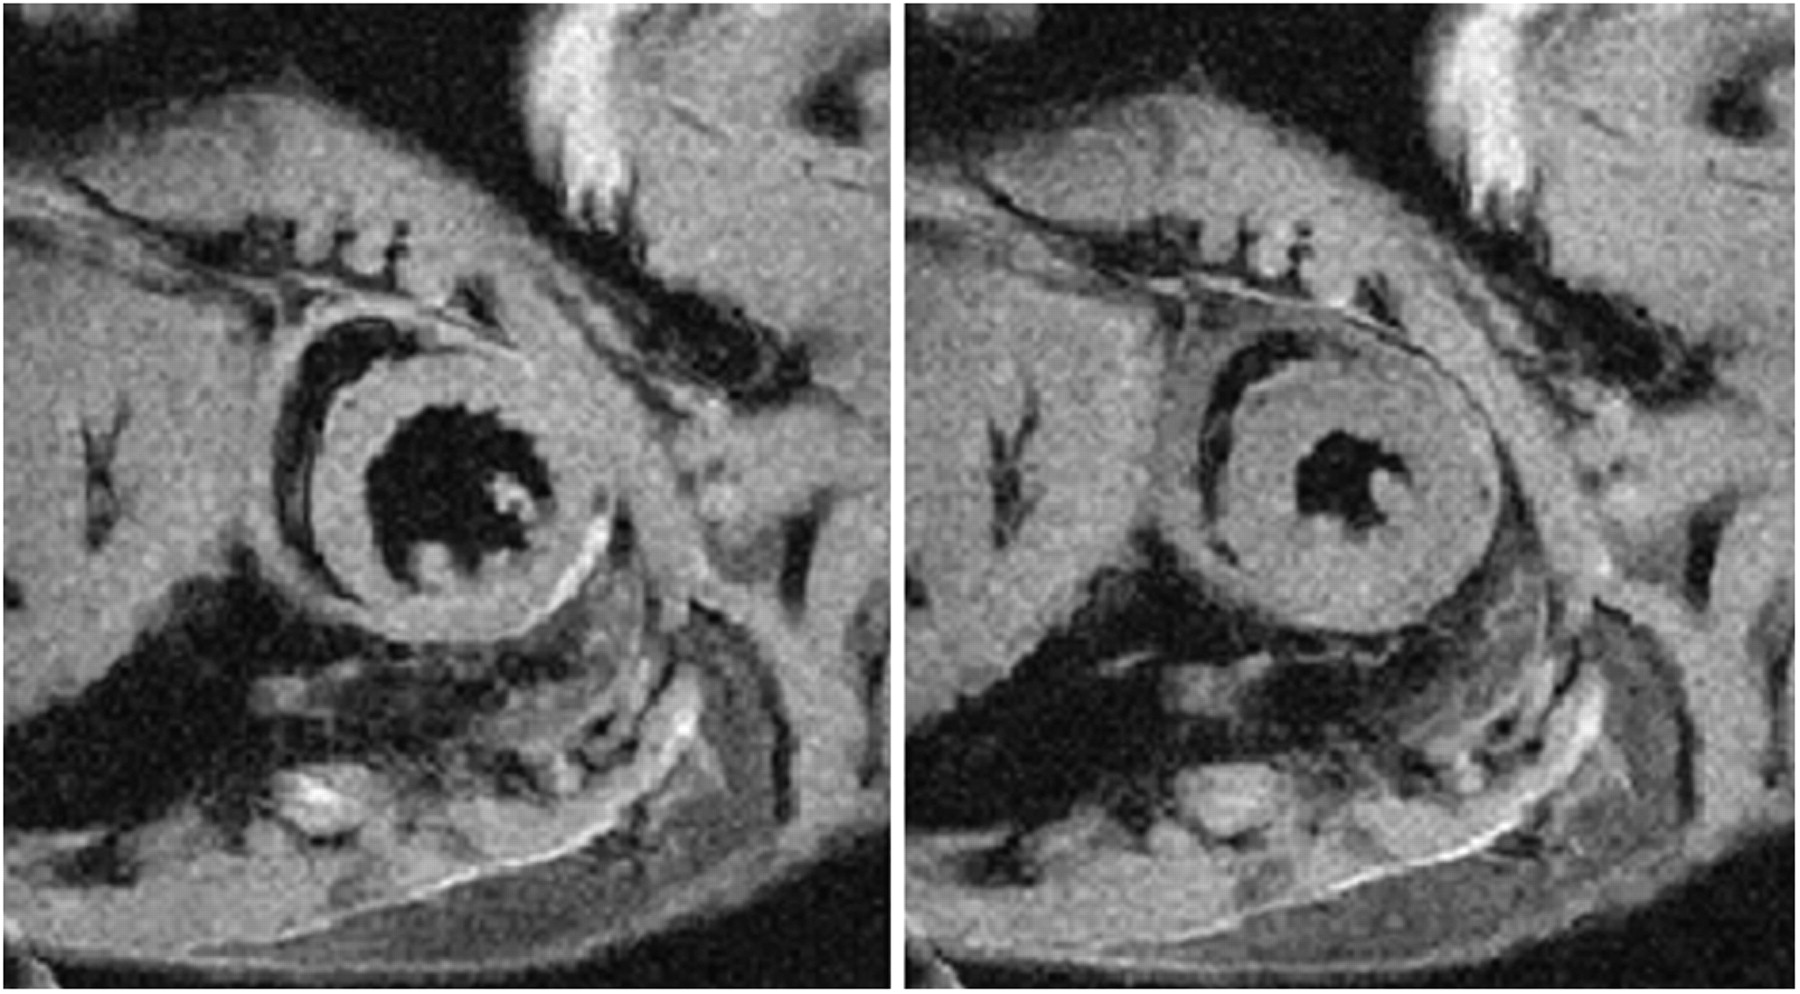
With the appropriate hardware in place, many of the methods commonly used in human cardiovascular MRI can be modified for mouse imaging. For the assessment of cardiac function in mice, cine MRI can achieve an in-plane spatial resolution of 100–200 μm, a slice thickness of 0.5–1.0 mm, and a temporal resolution of 5–10 ms. Examples of black-blood end-diastolic and end-systolic frames from a cine dataset of one slice of a mouse heart are shown in Figure 5 (28). When this method is used to image multiple short-axis slices covering the left ventricle, the calculation of left ventricular volumes, ejection fraction, wall thickening, and myocardial mass is straightforward.

End-diastolic (left) and end-systolic (right) midventricular short-axis MR images of mouse heart, taken from cine dataset with 16 frames across cardiac cycle. Spatial resolution was 0.15 × 0.15 × 0.5 mm3, and temporal resolution was 6 ms. Images were acquired with 7-T MRI system, and total scan time was approximately 5 min.
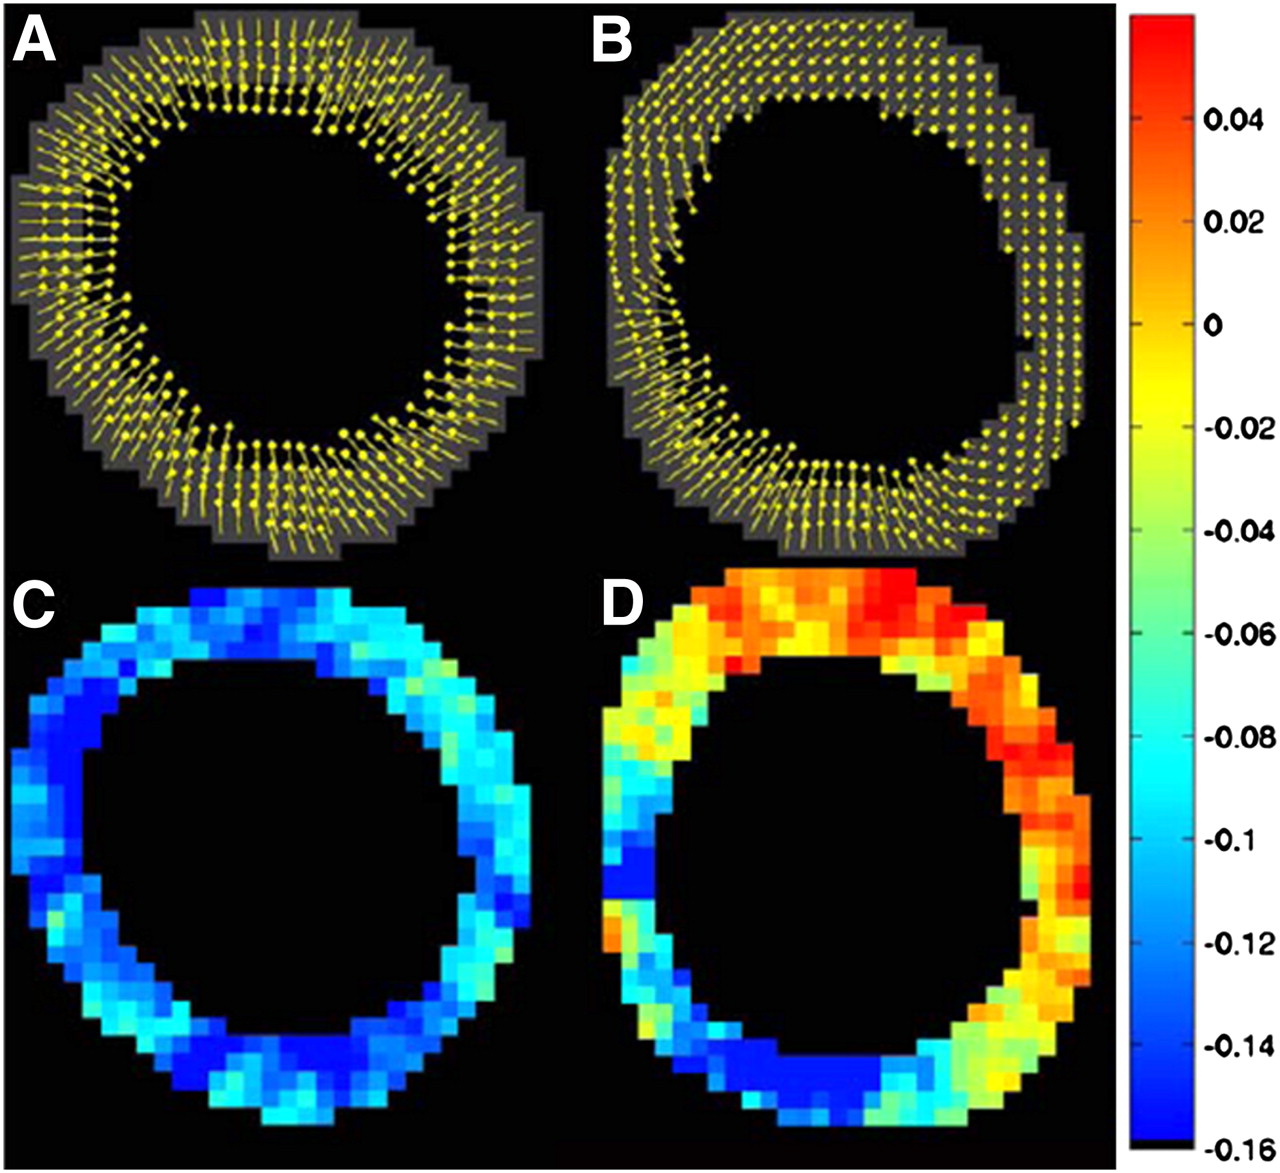
In addition to cine MRI, tissue tracking techniques, such as myocardial tagging and displacement encoding with stimulated echoes (DENSE), can be used to quantify intramyocardial displacement, strain, twist, and torsion in mice (29–31). Examples of end-systolic DENSE-acquired displacement and strain maps from a normal mouse and from a mouse infarct model are shown in Figure 6. These methods enable the quantification of important metrics of contractile function and are highly useful for assessing the functional phenotypes of genetically engineered mice (32).

End-systolic short-axis cine DENSE-acquired displacement (A and B) and circumferential shortening (C and D) maps of normal (A and C) and 7-d postinfarction (B and D) mouse heart. Region of infarction (11:00–5:00) has markedly reduced displacement (B) and shortening (yellow–orange) (D).
MRI Contrast Agents
For mouse models of myocardial infarction (33), inversion-recovery MRI after gadolinium injection can be used to directly visualize regions of infarction (34). An example of a gadolinium-enhanced image of myocardial infarction is shown in Figure 7. Common applications of this method include measuring infarct size and defining infarcted, adjacent, and remote regions for other types of imaging (e.g., strain imaging, perfusion imaging, and cellular or molecular imaging) to be applied to the same slice.
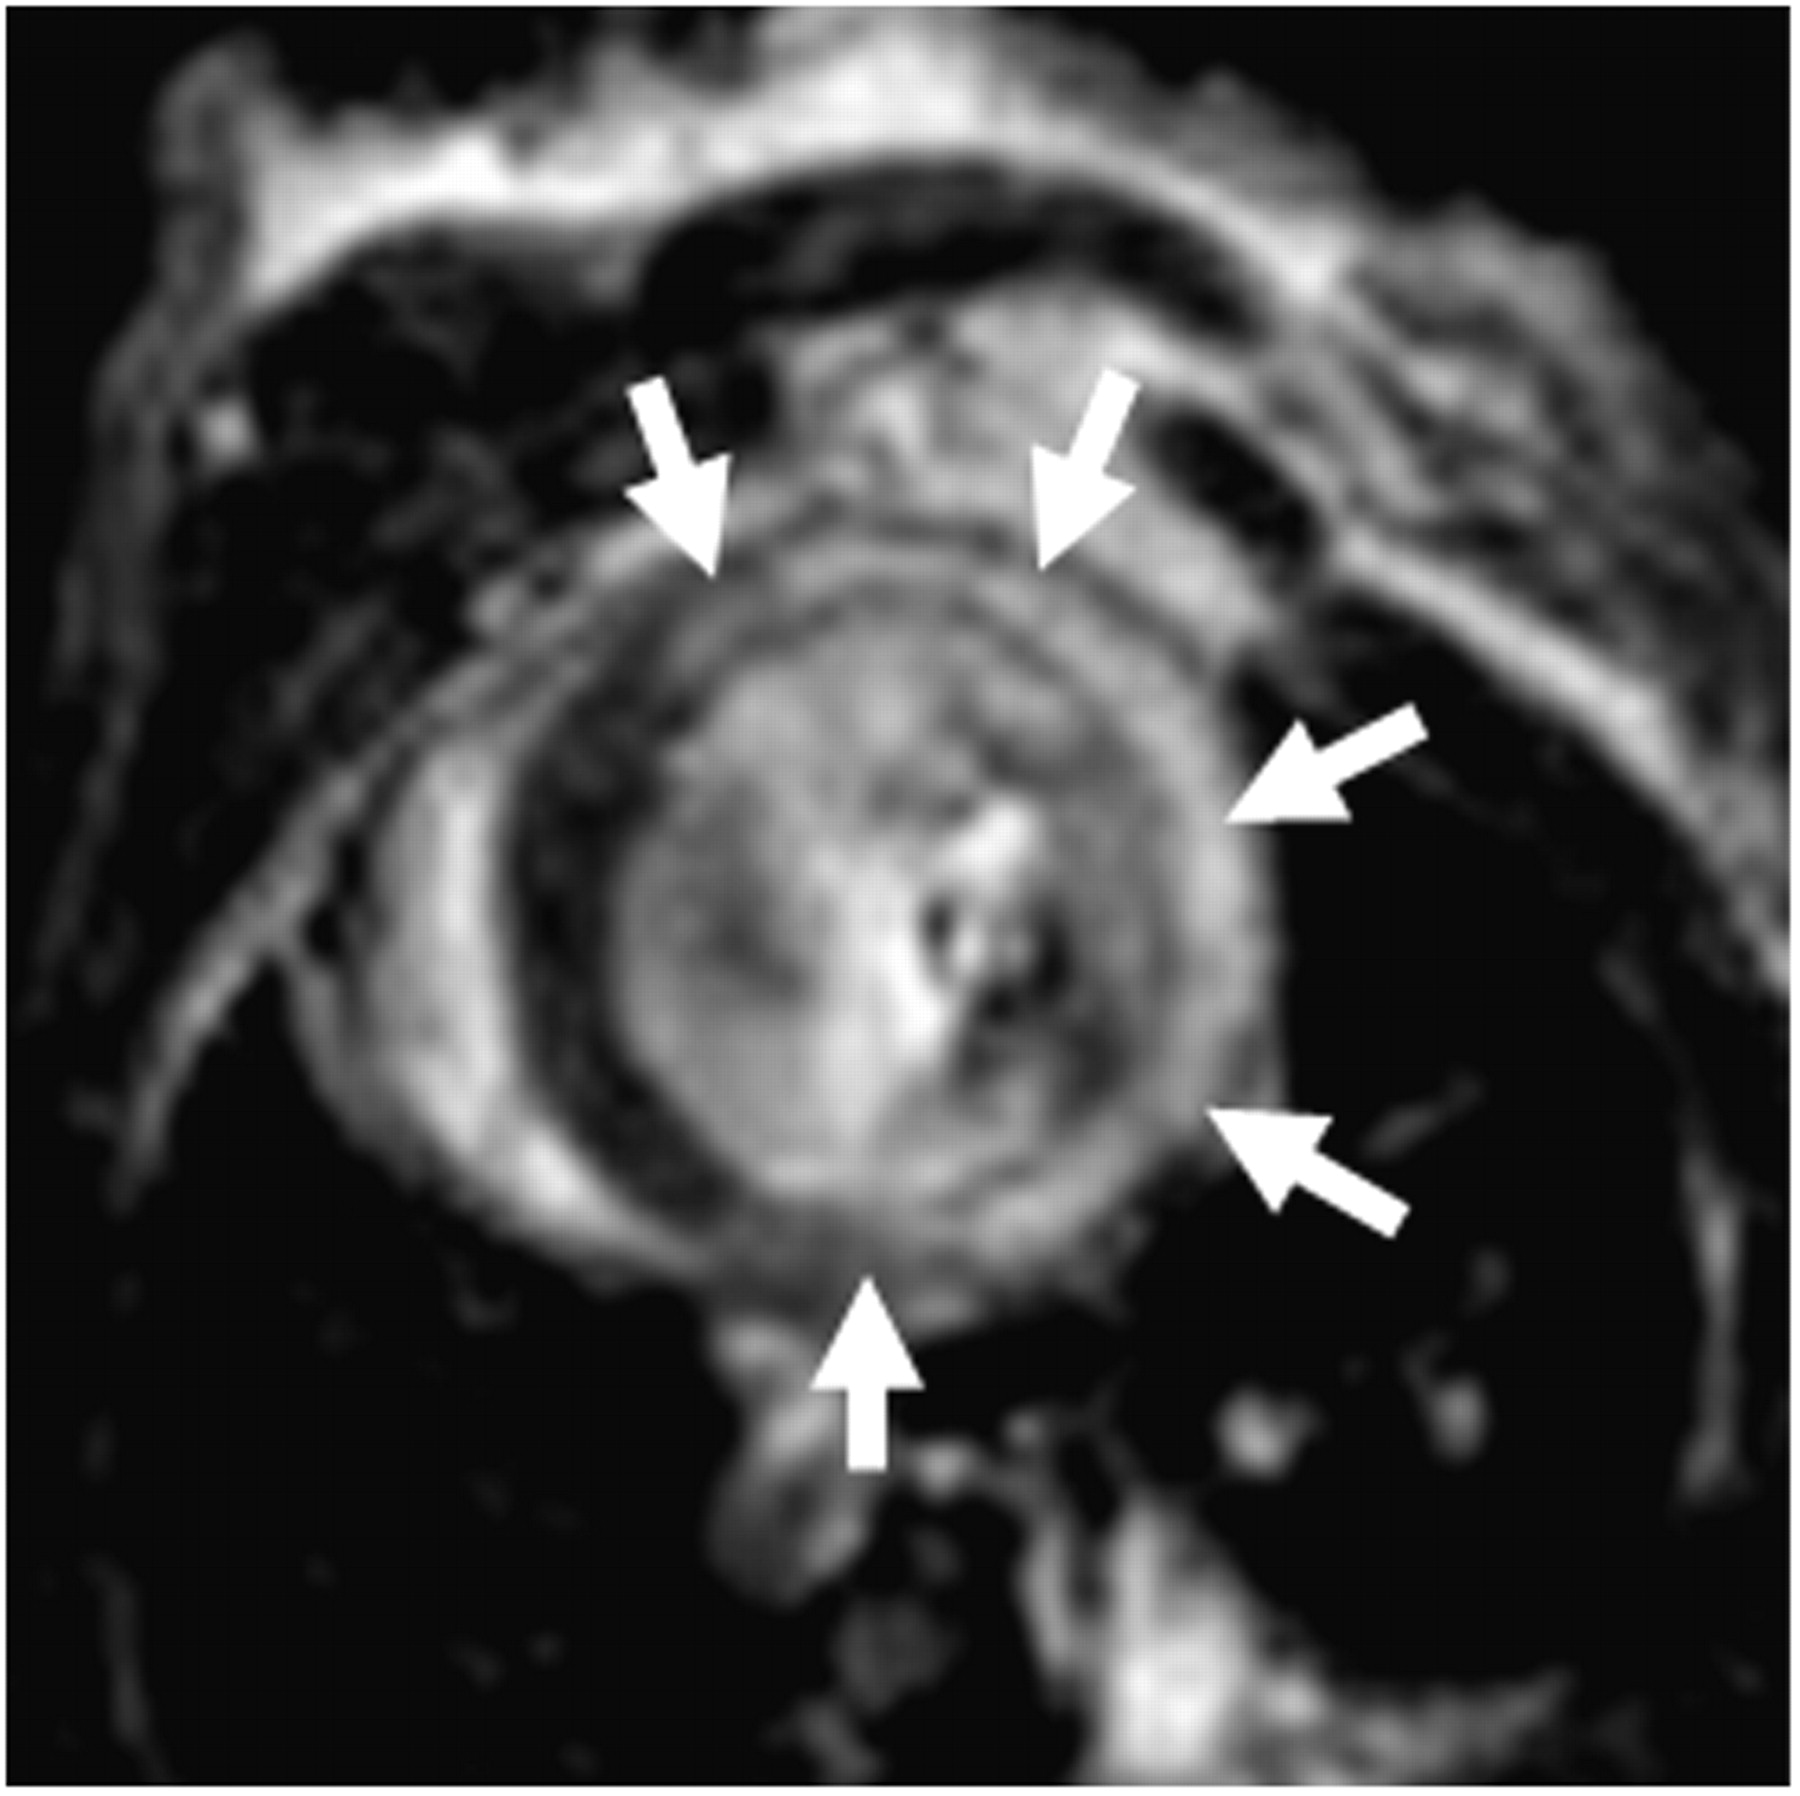
Gadolinium-enhanced inversion-recovery T1-weighted MR image of mouse heart 1 d after induction of experimental myocardial infarction. Hyperintense region delineates infarcted tissue (arrows). Such images can be used to define infarcted, adjacent, and remote zones. Also, multislice datasets that cover entire left ventricle can accurately assess infarct size.
MRI of myocardial perfusion is another important technique for assessing the functional phenotypes of genetically engineered mice. Although first-pass gadolinium-enhanced MRI is the most common method for perfusion MRI in humans, this method is challenging to perform in mice, largely because of their rapid heart rate. However, arterial spin labeling, which uses the flow of water into the imaging slice as an endogenous blood flow tracer, has been successfully applied to mice; in fact, because of the rapid heart rate of mice, this technique is better suited to cardiac imaging in mice than to that in humans (35,36). This method has been used to assess the phenotypes of genetically engineered mice and to study myocardial perfusion in mouse infarct models (32).
For vascular studies, time-of-flight magnetic resonance angiography (MRA) can be used to visualize relatively large blood vessels, and phase-contrast methods can be used to quantify blood flow and wall shear stress. However, because of relatively high blood velocities relative to the size of the mouse anatomy, signal loss from spin dephasing can be a significant problem in mouse MRA, particularly in regions of vessel curvature. Spiral MRA with short echo times and possibly other, similar techniques have been found to be successful in overcoming this problem, leading to high-quality MRA throughout the mouse aorta. Examples of MRA and wall shear stress data from phase-contrast MRA of the mouse aorta are shown in Figure 8.
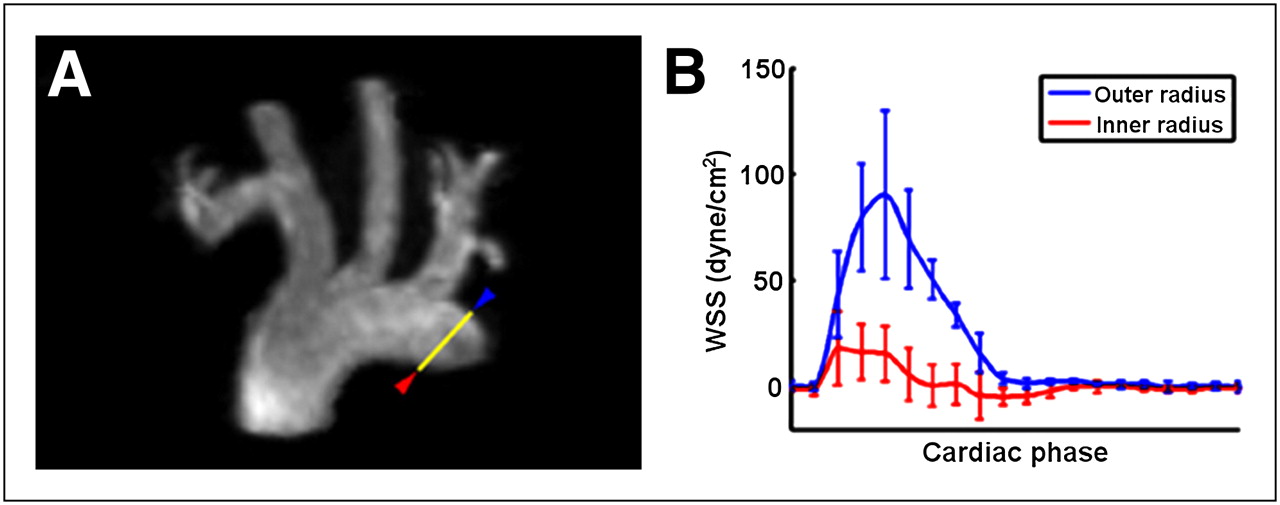
(A) 3D MRA maximum-intensity projection of aortic arch. Yellow line represents measurement plane for phase-contrast imaging, red arrowhead indicates inner radius of aortic arch, and blue arrowhead indicates outer radius. (B) Wall shear stress (WSS) as function of cardiac phase for inner and outer radii for 5 mice.
Finally, for targets with relatively high concentrations, molecular or cellular MRI can be performed. In this context, MRI in mice is useful because only small quantities of experimental contrast agents are needed to achieve the desired in vivo concentrations. Examples include molecular MRI of myocardial scarring with a collagen-targeting contrast agent (37) and imaging of apoptosis with targeted cross-linked iron oxide particles (38). A more extensive review of targeted cardiovascular MRI is beyond the scope of this article.
NEW TOOLS FOR HYBRID PET/MRI SYSTEMS
Rationale
The integration of PET and MRI permits the acquisition of spatially and temporally correlated data showing the distribution of PET radiotracers and MRI contrast agents or MRI-detectable metabolites, with registration to the underlying anatomy. However, combining PET and MRI for simultaneous imaging poses several challenges. Placing PET and MRI instruments next to each other and acquiring the data sequentially, as with PET/CT scanners, rule out the possibility of temporally correlating the 2 signals. Simultaneous PET/MRI data acquisition offers the possibility of improving the performance of one instrument by using the information obtained from the other modality. These opportunities include physical improvements (such as increased PET spatial resolution due to positron-range reduction in a magnetic field), improvements in the quantification of PET data through the use of MR information (such as MR-assisted motion and partial-volume correction and image-based estimation of the radiotracer arterial input function), and the possible use of dually labeled probes for “increasing” the sensitivity of MRI by using PET information to guide data acquisition.
The positron range is one of the physical factors limiting the spatial resolution of PET and is attributable to the fact that the positron must travel a short distance, losing its kinetic energy before annihilation with an electron. The positron—an electrical charge—changes its trajectory when it moves in a magnetic field, and the initial motivation for simultaneous PET/MRI was the improvement in spatial resolution due to reduction of the positron range inside the magnet. On the basis of the results of Monte Carlo simulations (39), it has been hypothesized that the in-plane spatial resolution may improve at high magnetic fields and for high-energy positron emitters. For this effect to be relevant, the contribution of the positron-range component to the final spatial resolution—still dominated by the crystal size—must be significant. Such may be the case for small-animal cardiac studies performed with 82Rb (maximum energy, 3.51 MeV) inside strong magnetic fields (>7 T) because of the smaller structures being imaged and the higher spatial resolution achievable with dedicated instruments, especially scanners with submillimeter crystals.
Another example of an application that could affect a wide range of studies is MR-assisted motion correction. Voluntary and especially involuntary movements (such as cardiac or respiratory motion) are difficult to avoid, and they lead to the degradation of PET images and, in more severe cases, to the introduction of artifacts. These effects become particularly relevant when a quantitative analysis is performed, especially given the recent improvements in PET scanner spatial resolution. MRI data can be acquired continuously during PET data acquisition and can be used to characterize the independent motion of each of the voxels of interest. External markers (such as optical tracking systems) can at best approximate the motion associated with respiratory or cardiac activity by assuming rigid-body transformation, whereas MRI data can be used to model more accurately the movement of the internal organs with non–rigid-body transformation.
Methodology
Optical fibers that were 3–5 m long originally were used to couple scintillator elements placed inside the magnet to photomultiplier tubes (PMTs) and electronics placed outside the fringe magnetic field (40,41). In this way, the electromagnetic interference of the 2 imaging systems was minimized, but PET performance was less than optimal. Multiple rings of crystals in the transaxial (42) and axial (43) directions were subsequently proposed to improve PET scanner sensitivity. Variations of this approach include modified MRI scanners (such as split (44) or field-cycled magnets (45)) and PMT-based detectors similar to those used in commercially available scanners.
Another approach is to use non–magnetic field–sensitive solid-state photon detectors—APDs—as replacements for PMTs and to place these inside the bore of the magnet (46–49). One method for coupling these APDs to scintillator arrays is to use short optical fibers, so that all of the PET electronic components are placed outside the MR field of view (but still inside the magnet bore), minimizing the potential for interference. With this method, an MRI-compatible PET insert for a small-animal 7-T MRI scanner was developed at the University of California, Davis; this apparatus was successfully used to perform proof-of-principle in vivo PET/MRI studies, including whole-body acquisitions, in mice (46). In another method, the APDs are coupled directly to the scintillator elements (Fig. 9). The small-animal system built at the University of Tübingen with this approach was also successfully used for in vivo studies (47), including cardiac gated simultaneous PET/MRI acquisitions. A similar method was used to integrate a prototype human dedicated brain scanner with a 3-T MRI scanner (Siemens Medical Solutions) (48). With this prototype scanner recently installed at the A.A. Martinos Center for Biomedical Imaging at Massachusetts General Hospital, proof-of-principle simultaneous PET and MRI studies were performed in small animals and in patients with brain tumors.
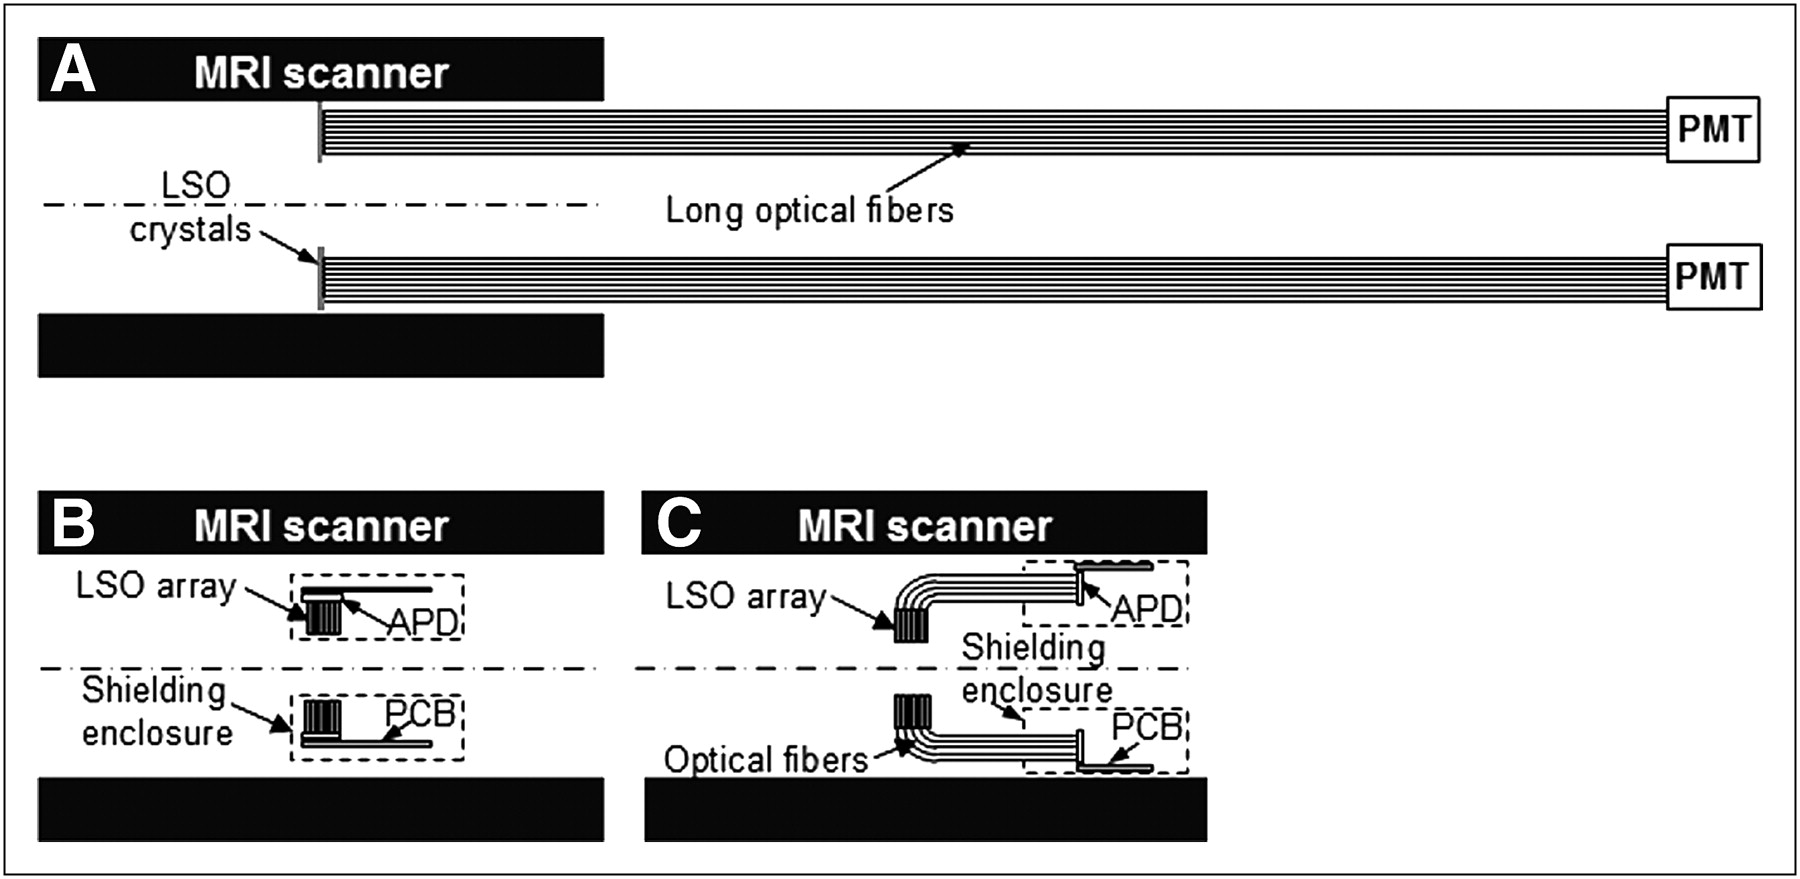
Different approaches to combined PET/MRI. (A) Long optical fibers used to couple scintillators to PMTs residing outside magnet. (B) APDs coupled directly to scintillator elements. (C) Scintillators coupled through short optical fibers to APDs. In all cases, scintillators are centered axially in MRI field of view. LSO = lutetium oxyorthosilicate; PCB = printed circuit board.
Future Possibilities
Several groups recently started to develop dually labeled PET/MRI probes to better exploit the advantages of both techniques. One potential application for these probes is atherosclerotic plaque imaging. For example, a fibrin-targeted peptide was conjugated with gadolinium and used for noninvasive thrombus MRI (Fig. 10). This same peptide could, in principle, be conjugated with 64Cu-DOTA and used for PET. Such dually labeled agents would allow one to take advantage of the high sensitivity of PET for guiding MRI studies and thus improve the in vivo characterization of atherosclerotic plaques.

(A) Fibrin-targeted contrast agent (EP-2104R) consisting of 11-amino-acid peptide functionalized with 2 GdDOTA-like moieties at both C and N termini of peptide. (B) Bright-spot thrombus MRI with fibrin-targeted contrast agent in rat stroke model. Clot in internal carotid and middle cerebral arteries was visualized (arrows). Image was provided courtesy of Peter Carvavan, A.A. Martinos Center for Biomedical Imaging, Massachusetts General Hospital.
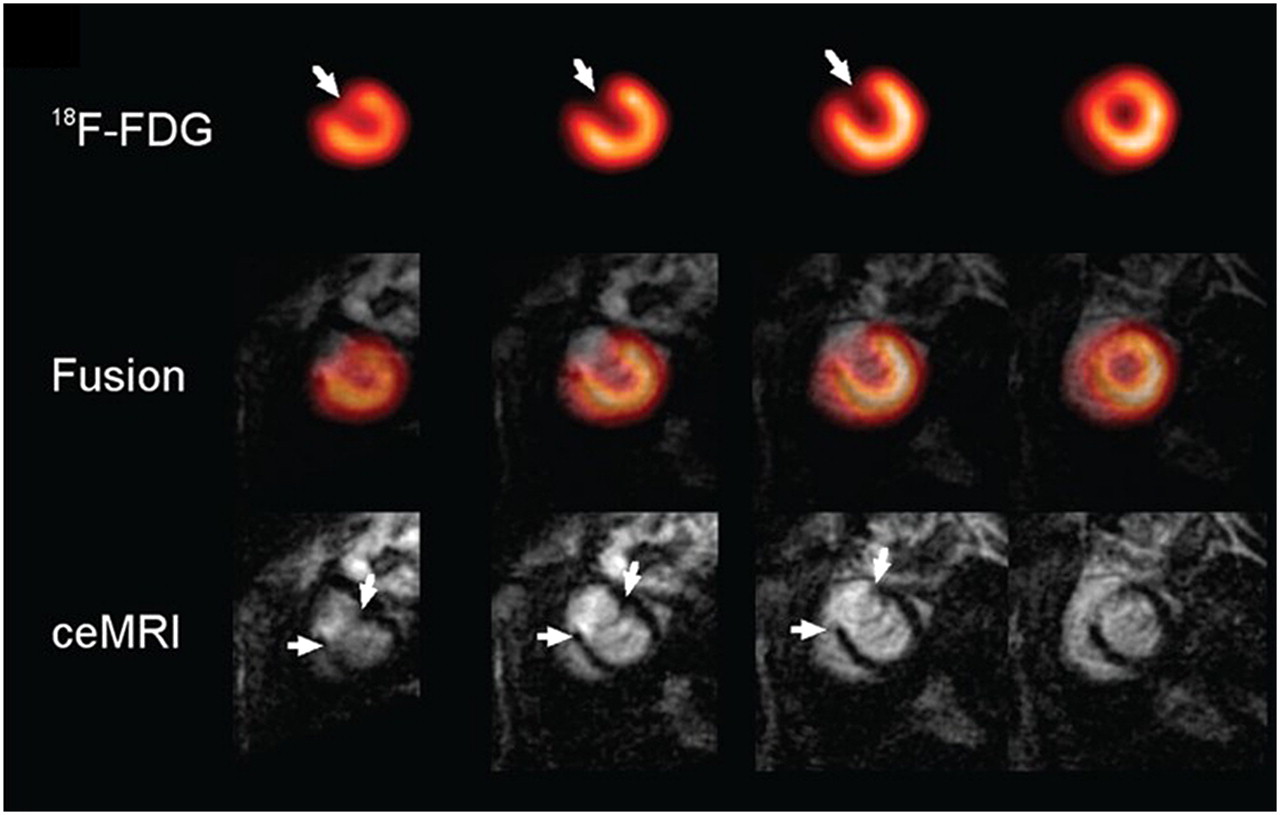
Other existing cardiovascular molecular imaging applications could benefit from an integrated PET/MRI scanner, and new ones will almost certainly emerge. For example, PET and MRI could be used simultaneously to assess myocardial infarction and viability by combining functional information and metabolic information (e.g., delayed-enhancement MRI combined with 13NH3 and 18F-FDG PET), for the localization and quantification of angiogenesis targets (e.g., αvβ3-integrin expression), or for the detection of stem cell delivery and migration (Fig. 11). Combined PET/MRI is expected to be a more quantitative tool than the 2 methods alone, and it could have a significant impact in all aspects of patient care, such as screening, disease assessment, and therapy monitoring.

Sequentially acquired PET and MRI data in myocardial infarction rat model. Decreased 18F-FDG uptake area in anterior wall correlates with hyperenhancing region demonstrated by contrast-enhanced MRI (ceMRI) study (arrows). Short-axis images are shown from apex (left) to base (right). (Reprinted from (96).)
MICRO-SPECT AND SPECT/CT
Background
SPECT is a combination of conventional radionuclide imaging with image reconstruction from projections (50). After the injection of a trace amount of biomarkers labeled with radioisotopes, radionuclide imaging allows the study of various myocardial functions and related diseases. Also, because of its exceptional target specificity for radiotracers, radionuclide imaging allows imaging at the molecular level, such as receptor imaging, which cannot be accomplished with other imaging techniques. Conventional radionuclide imaging uses a position-sensitive radiation detector, such as a scintillation or γ-camera, to detect γ-ray photon emission from the 3-dimensional (3D) distribution of radioactivity of the radiolabeled biomarker in vivo and then to form a 2-dimensional (2D) projection image. In SPECT, an image reconstruction method that is based on a mathematic formulation is applied to the 2D projection images from multiple views to generate 3D images that represent the distribution of radioactivity in vivo with much higher image contrast and clarity than are provided by 2D projection images.
A major challenge of micro-SPECT for preclinical molecular imaging is the requirement for a high spatial resolution with sufficient detection efficiency for the imaging of small live animals. For example, a mouse is about 11 times smaller than a human, so that the resolution equivalent to 11 mm for a human is 1 mm for a mouse. During the past decade, significant advances have been made in detector technologies, which now provide much-improved intrinsic resolution. The new technologies have been applied to clinical and small-animal SPECT or micro-SPECT systems. By use of pinhole imaging geometry with magnification (51–53), both a high resolution (on the order of 1 mm or less with a small pinhole aperture and low photon energy) and high detection efficiency (on the order of 10−3 with full-ring detector geometry and submillimeter resolution) can be achieved. A unique advantage of SPECT is its ability to image multiple radiotracers emitting different energy photons simultaneously. By taking advantage of radionuclides with relatively long half-lives, micro-SPECT has been used to track the migration of radiolabeled mesenchymal stem cells to a myocardial infarction (54). Also, quantitative SPECT image reconstruction methods with compensation for a collimator–detector response, photon attenuation, and scatter that have been successfully applied to clinical SPECT (55) are becoming available to small-animal SPECT and may result in further improvements in image quality and quantitative accuracy.
Principles of Pinhole and Multipinhole Micro-SPECT
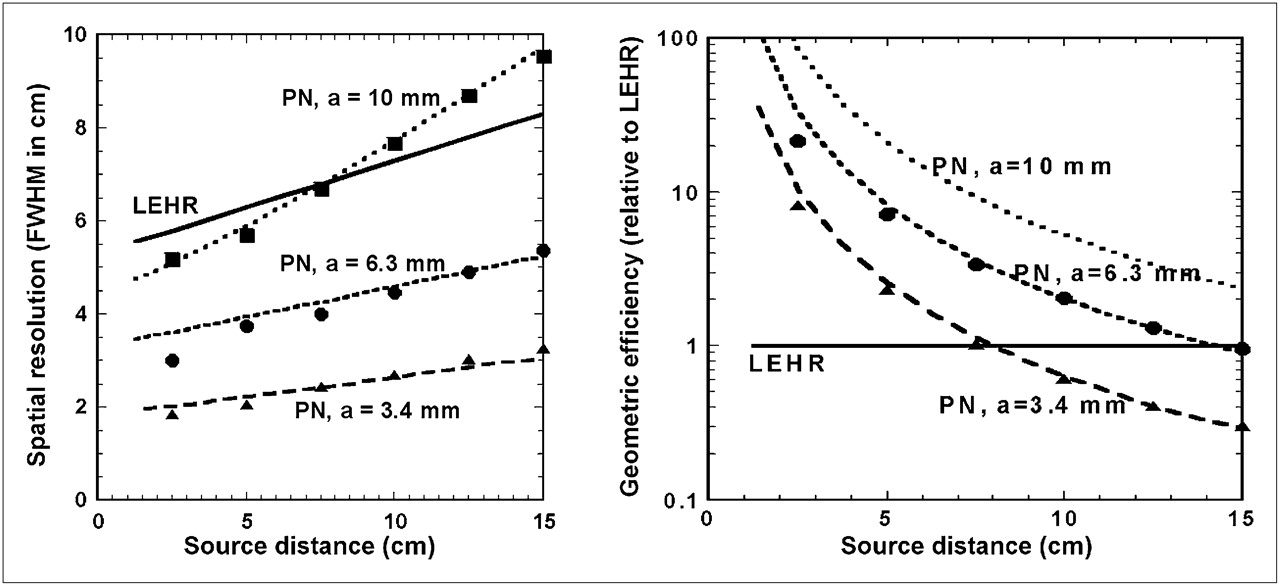
To achieve the high spatial resolution required for preclinical small-animal imaging, almost all micro-SPECT systems use pinhole imaging geometry (51–53). Figure 12 shows the imaging configuration of a single-pinhole collimator, and Figure 13 shows a comparison of the spatial resolution and detection efficiency of pinhole and typical conventional parallel-hole collimators with different design parameters.
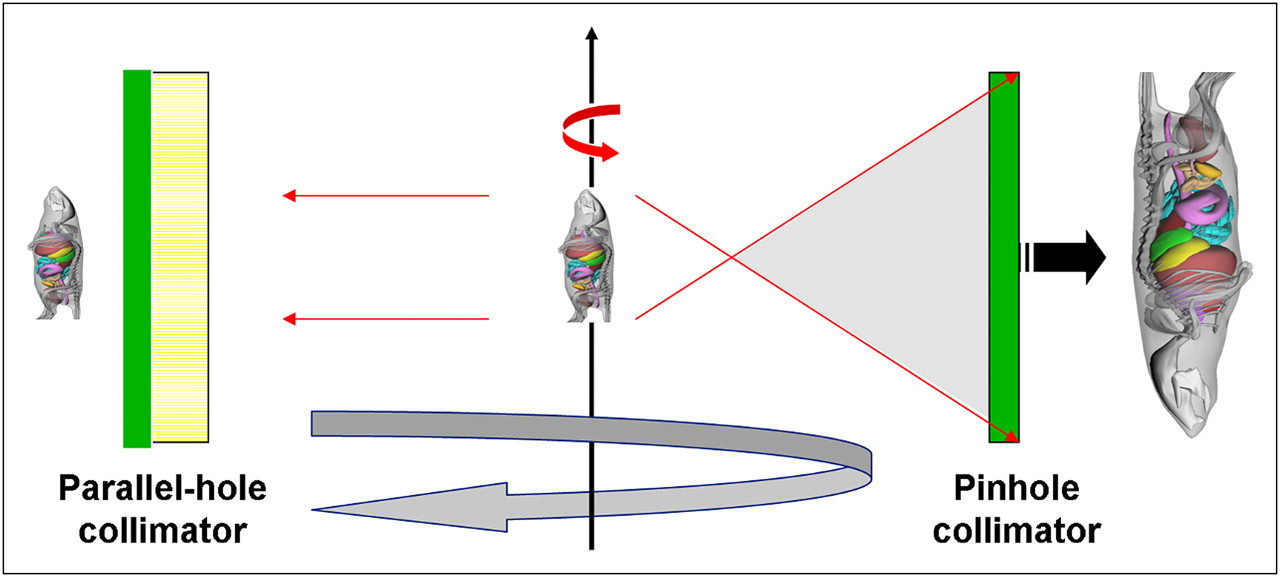
Comparison of imaging geometries of conventional parallel-hole collimator and pinhole collimator in preclinical imaging of small animals. Through magnification of small object at short distance onto large detector area, pinhole collimation geometry offers substantial increase in detection efficiency over that offered by parallel-hole collimation geometry, and spatial resolution is determined by size of pinhole aperture.

(Left) Comparison of spatial resolution of typical low-energy, high-resolution (LEHR), parallel-hole collimator with that of 3 pinhole (PN) collimators with different pinhole apertures as function of source distance. a = aperture size; FWHM = full width at half maximum. (Right) Comparison of geometric efficiency of same collimators as function of source distance. Graphs show advantages of pinhole collimation over parallel-hole collimation for imaging of small animals at short distance.
Through image magnification of a small object onto a large detector, significant gains in spatial resolution and detection efficiency can be obtained when the object is placed closer to the pinhole collimator. The trade-off is a smaller field of view that allows the imaging of small objects or small animals. The achievable spatial resolution is determined by the pinhole aperture when the photon energy is sufficiently low, with negligible penetration through the edge of the pinhole aperture, to render a larger effective pinhole size.
The detection efficiency of a single-pinhole collimator can be further increased by use of a multipinhole collimator, with which multiple projections of the same object from several pinhole apertures are projected onto the same detector (56–58). Figure 14 shows typical multipinhole collimation geometry, in which the multiple pinhole apertures share a common field of view.

Multipinhole collimation geometry, in which projections of common field of view (indicated by circle defined by intersects of 3 projections) share same detector area without overlap. Increased number of projections provides increased geometric detection efficiency. However, geometry detection efficiency from each pinhole aperture is lower than that of single-pinhole collimation, in which entire detector area can be used with high magnification.
However, to avoid overlapping of the multiple projections, a smaller magnification is required to reduce the size of each projection. This change reduces the gain in detection efficiency offered by the multiple pinhole apertures. Also, the intrinsic resolution or, in the case of pixilated detectors, the resolvable pixel elements of the detectors will have an increased effect on the overall system spatial resolution of multipinhole SPECT.
Micro-SPECT and SPECT/CT Systems
The past decade has witnessed tremendous growth in the development of micro-SPECT systems in research laboratories in academia and industry. The development can be divided into several categories. In the early stage, a conventional scintillation camera fitted with a single-pinhole collimator was often used. Because of the large size of the pinhole collimator, a small animal is rotated in front of the stationary pinhole collimator. Currently, most micro-SPECT systems consist of multiple detectors that surround the small animal to be imaged. The detectors are mounted on a stationary or rotating gantry and are arranged in a discrete configuration or in a close-ring configuration. To achieve high detector intrinsic resolution, pixilated scintillation detectors with NaI(Tl) crystals and increasingly smaller pixel sizes (1 mm or less) have been developed. Solid-state detectors, such as cadmium–zinc telluride detectors, have been used in newer generations of micro-SPECT systems.
Multipinhole collimators can be found in most recent research and commercial micro-SPECT systems (56–58). They provide significant increases in detection efficiency compared with systems that have a single-pinhole collimator for each detector. With a close-ring micro-SPECT system that has state-of-the-art detector technology and a spatial resolution of approximately 1.5 mm, a detection efficiency of 5%−10% can be achieved. The high detection efficiency of a micro-SPECT system with complete-ring geometry can be traded for an ultra-high-resolution application. For example, a micro-SPECT system that provides submillimeter resolution has been developed for commercial applications (57,59).
Although micro-SPECT images offer unique functional information at the molecular level, they are often difficult to interpret because of the lack of correlation with anatomic structures or biologic landmarks. Because micro-CT images provide excellent anatomic information, dual-modality micro-SPECT/micro-CT, which offers coregistered SPECT and CT images, has become standard for clinical and small-animal molecular imaging systems (60). Also, multimodality small-animal PET/SPECT/CT systems are commercially available, and SPECT/optical/CT systems can be found in research laboratories. The research and development of small-animal SPECT/MRI instrumentation and techniques are currently under way, with the goal of providing unique simultaneous multimodality functional information and anatomic information.
Quantitative Pinhole SPECT Image Reconstruction Methods
The image reconstruction problem for pinhole SPECT is similar to that for 3-dimensional cone-beam SPECT and micro-CT with an area detector. In a micro-SPECT system with a rotating gantry, geometric misalignments of the gantry and the individual detectors are the main causes of reconstructed image blurring and artifacts. Hence, careful calibration of the micro-SPECT system and accurate determination of the geometric misalignment parameters for use in image reconstruction are essential for ensuring artifact-free micro-SPECT reconstructed images (61–63).
Although photon attenuation and scatter have fewer effects in micro-SPECT of small animals than in clinical SPECT, they cause quantitative inaccuracies in the reconstructed images. Furthermore, the finite spatial response of the pinhole collimator contributes to the blurring of the reconstructed images. As in quantitative SPECT, quantitative pinhole and multipinhole image reconstruction methods that compensate for the effects of photon attenuation (61,63,64) and scatter and collimator–detector blur have been developed and implemented in micro-SPECT. In particular, pinhole SPECT image reconstruction methods that compensate for collimator–detector blur have been shown to provide improved resolution and lower noise magnitude in the reconstructed images. Corrective pinhole and multipinhole SPECT reconstruction methods with compensation for image-degrading factors are providing micro-SPECT images with much-improved image quality in terms of reduced image artifacts, higher spatial resolution, and lower image contrast and noise. At the same time, quantitative accuracy in terms of the radioactivity concentration in vivo is increased.
Applications of Micro-SPECT to Preclinical Cardiovascular Imaging
Like clinical SPECT and SPECT/CT, micro-SPECT and micro-SPECT/CT allow the study of various myocardial functions and related diseases in small animals, including the ejection fraction, regional wall motion abnormalities, congestive heart failure, perfusion, viability, oxygen consumption, and glucose and fatty acid metabolism (61,65–68). Also, coronary artery functions and related diseases, such as ischemia, infarction, and atherosclerosis, can be investigated (69–70). In addition, because of its exceptional target specificity for radiotracers, radionuclide imaging allows imaging at the molecular level, such as receptor imaging (72).
Figure 15 shows transaxial images at end-diastole of a gated myocardial perfusion micro-SPECT study of a rat. The animal was injected with approximately 185 MBq of 99mTc-sestamibi and imaged by use of a dual-detector Gamma Medica-Ideas XSPECT system in which each detector was fitted with a single-pinhole collimator having a 1-mm-diameter aperture. The total acquisition time was about 20 min, and the reconstructed images were postprocessed with a Butterworth filter. The images indicate the ability of a micro-SPECT system to clearly delineate the myocardium and show normal perfusion.
Transaxial images at end-diastole from gated myocardial perfusion micro-SPECT study of rat. Animal was injected with approximately 185 MBq of 99mTc-sestamibi and imaged by use of dual-detector Gamma Medica-Ideas XSPECT system in which each detector was fitted with single-pinhole collimator with 1-mm-diameter aperture. Total acquisition time was 20 min, and reconstructed images were postprocessed by use of Butterworth filter with cutoff frequency of 0.1 cycle per voxel and order of 8. Images indicate ability of micro-SPECT system to clearly delineate myocardium showing normal perfusion.
Figure 16 shows a comparison of micro-SPECT images obtained with different pinhole image reconstruction methods. Figure 16A shows reconstruction of a sample raw transaxial image from the myocardial perfusion micro-SPECT study of the rat from Figure 15; the image reconstruction method was 3D pinhole filtered backprojection, and the image was postprocessed with a Butterworth filter at 2 different cutoff frequencies. Figure 16A shows that the noise magnitude of the reconstructed raw image could be reduced, with a concurrent loss of spatial resolution. Figure 16B shows reconstruction of an image obtained from the sample acquired projection data with an iterative 3D ordered-subset expectation maximization (OSEM) pinhole image reconstruction method without any correction, at different iterations, and postprocessed with a Butterworth filter. Finally, Figure 16C shows reconstruction of an image obtained from the same sample slice with an iterative 3D OSEM pinhole image reconstruction method with correction of the geometric response of the pinhole collimator and at different iterations. The images demonstrate the effectiveness of the pinhole image reconstruction method with correction of the pinhole collimator response in improving the quality of image reconstruction; compared with the results obtained from image reconstruction without correction, image reconstruction with correction yielded improved image resolution without noise amplification.

(Row A) Sample transaxial reconstructed images from gated myocardial perfusion micro-SPECT study of rat from Figure 15 by 3D pinhole filtered backprojection image reconstruction method and postprocessing with Butterworth filter with order of 8 and, from left to right, cutoff frequencies of 0.5, 0.15 and 0.1 cycles per voxel respectively. (Row B) Images from same transaxial slice as in row A by iterative 3D OSEM pinhole image reconstruction method without any correction and, from left to right, at 2, 5, 8, and 11 iterations, and postprocessing with Butterworth filter with order of 8 and cutoff frequency of 0.1 cycle per voxel. (Row C) Image from same transaxial slice as in row A by iterative 3D OSEM pinhole image reconstruction method with correction of geometric response of pinhole collimator at 2, 5, 8, and 11 iterations. Images demonstrate effectiveness of corrective pinhole image reconstruction methods in improving reconstructed image quality in terms of improved image resolution without noise amplification. (Reprinted with permission of (61).)
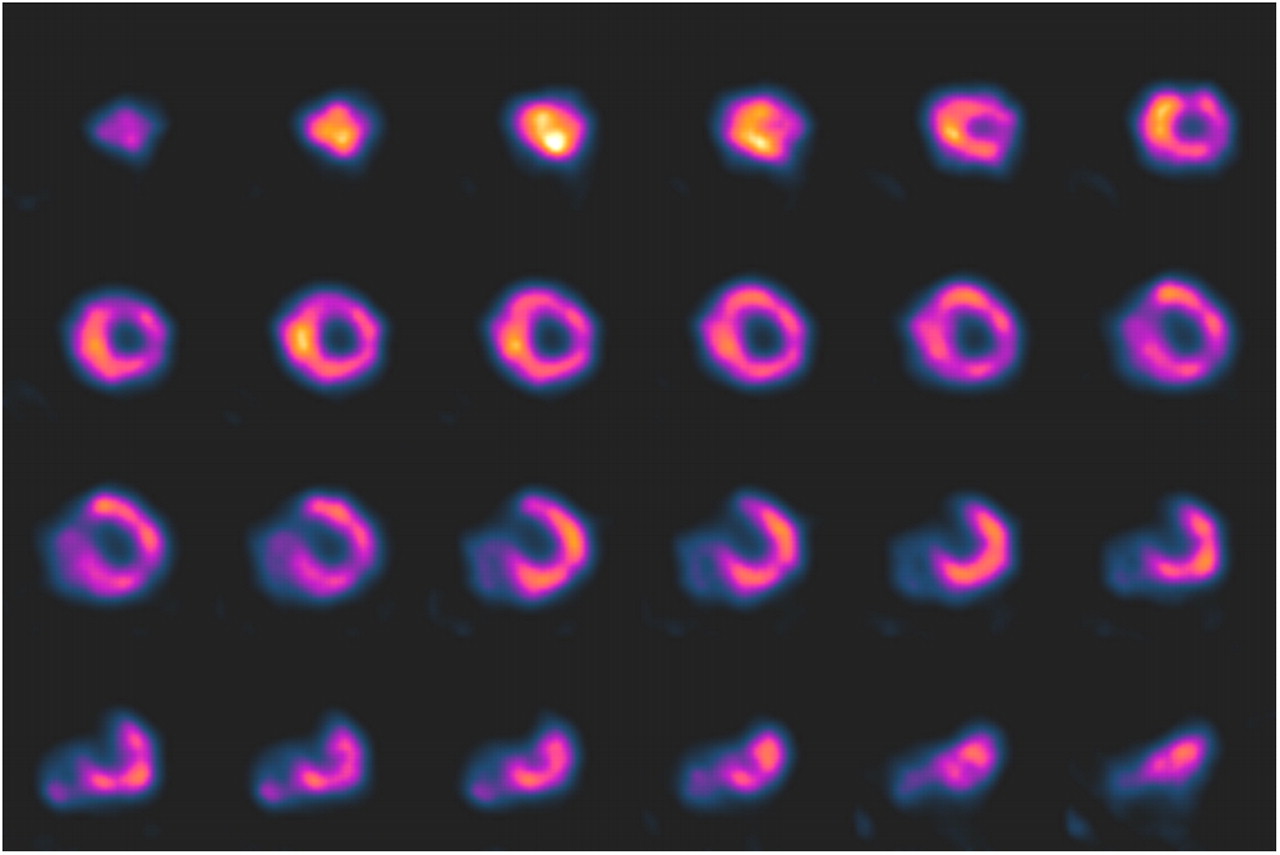
A special line of multipinhole micro-SPECT systems for preclinical small-animal imaging, U-SPECT-I by the research group at the University of Utrecht and its commercial successor, U-SPECT-II by MILabs, has been developed to achieve unprecedented submillimeter resolution in mice. When the system is used to image a mouse heart, it allows ultrahigh visualization of tracer uptake and retention in the myocardium, including the papillary muscle (57,59). Sample images from the system are shown in Figure 17.

Sample ultrahigh-resolution 99mTc-tetrofosmin SPECT images of mouse heart in end-diastole (left) and end-systole (right) showing myocardial perfusion in fine detail, such as in papillary muscles and right ventricular wall. Male C57BL/6 mouse (30 g) was injected intravenously with 190 MBq of 99mTc-tetrofosmin and anesthetized with ketamine–medetomidine–atropine. At 45 min after injection, mouse was imaged for 1 h by use of U-SPECT-II system with 0.6-mm-diameter pinhole inserts. During image acquisition, electrocardiogram trigger signal was acquired (using BioVet from m2m Imaging Inc.) and incorporated into list-mode data. Sixteen-gate reconstruction was performed. Image data were provided courtesy of Freek J. Beekman, currently at Delft University of Technology and MILabs. (Reprinted with permission of (68).)
Another advantage of micro-SPECT is its ability to image multiple radiotracers emitting different energy photons simultaneously (73). By taking advantage of radionuclides with relatively long half-lives, small-animal SPECT has been used to track the migration of radiolabeled mesenchymal stem cells to a myocardial infarction (54).
Future of Micro-SPECT and SPECT/CT
Because of commercially available radiolabeled tracers, micro-SPECT and SPECT/CT with radionuclide techniques have enjoyed much progress. At the same time, fueled by advances in the development of new radiolabeled biomarkers and radiopharmaceuticals, they have become increasingly important in the preclinical molecular imaging of cardiovascular functions and diseases. Because success in preclinical molecular radionuclide imaging techniques can be directly translated to clinical studies, these methods are particularly important in drug development and translation of medicine from in vitro scenarios to clinical practice.
ROLE OF MICRO-CT IN MOLECULAR IMAGING
Rationale
Although imaging of the transport of selected molecules labeled with heavy elements (e.g., iodine) by use of x-ray imaging techniques has been possible for many years, the ability of such techniques to image the distribution of localized accumulation due to metabolic activity remains elusive. CT images have contributed to nuclear molecular imaging by providing the anatomic context for separately acquired emission images (e.g., micro-SPECT or PET images) of the distribution of radiolabeled molecules as well as increasing their accuracy by providing attenuation correction of the emission intensities. New developments in x-ray imaging now open the potential for discriminating tissues and materials that have few differences in x-ray attenuation coefficients (because of their nearly identical atomic contents) but that have distinctive differences in their molecular bond patterns.
Micro-CT, like clinical CT, is based on measurement of the attenuation of x-rays passing through an object. Micro-CT is now a well-established imaging methodology that can be used to scan small animals, such as mice, and generate 3D image datasets that provide image resolution scaled to small animals (e.g., 50–100 μm3 of voxels) and contrast equivalent to that provided by clinical whole-body CT (e.g., 300–600 μm3 of voxels) (74). Micro-CT scanners that generate suitably scaled, clinical CT–like scans of small animals therefore may be more aptly called mini-CT scanners. Because of scaling, these scanners present more difficult challenges than clinical CT scanners; for example, small animals have much higher heart rates and more respiration cycles, and the radiation exposure needs to increase with the decrease in voxel size (up to the fourth power of the voxel side dimension) if the image SNR characteristics are to remain at clinical levels. Mini-CT scanners can operate at clinical x-ray kVp levels and involve tolerable levels of x-ray exposure (75).
True micro-CT scanners generate image information at the microscopic level, that is, voxels of less than 50 μm, to detect the basic functional units of organs (e.g., hepatic lobule or bone Haversian systems) and terminal arteriolar and capillary vessels (Fig. 18). In this scenario, the x-ray photon energy must be reduced to about 20 keV to maximize the contrast resolution. This type of imaging generally involves scanning volumes the size of isolated rodent organs and involves levels of radiation exposure that would not be suitable for longitudinal studies (76). ECG and respiratory gated micro-CT can be used to convey motion and shape changes in the cardiac chambers, lungs, and airways in small animals (77). The low level of washout of any intravascular contrast agent that has diffused into the extravascular space can be imaged to show regions of absent or reduced perfusion (such as in vascular occlusion) or an increase in contrast when microvessels are more leaky (such as in cancer or ischemia) (78).
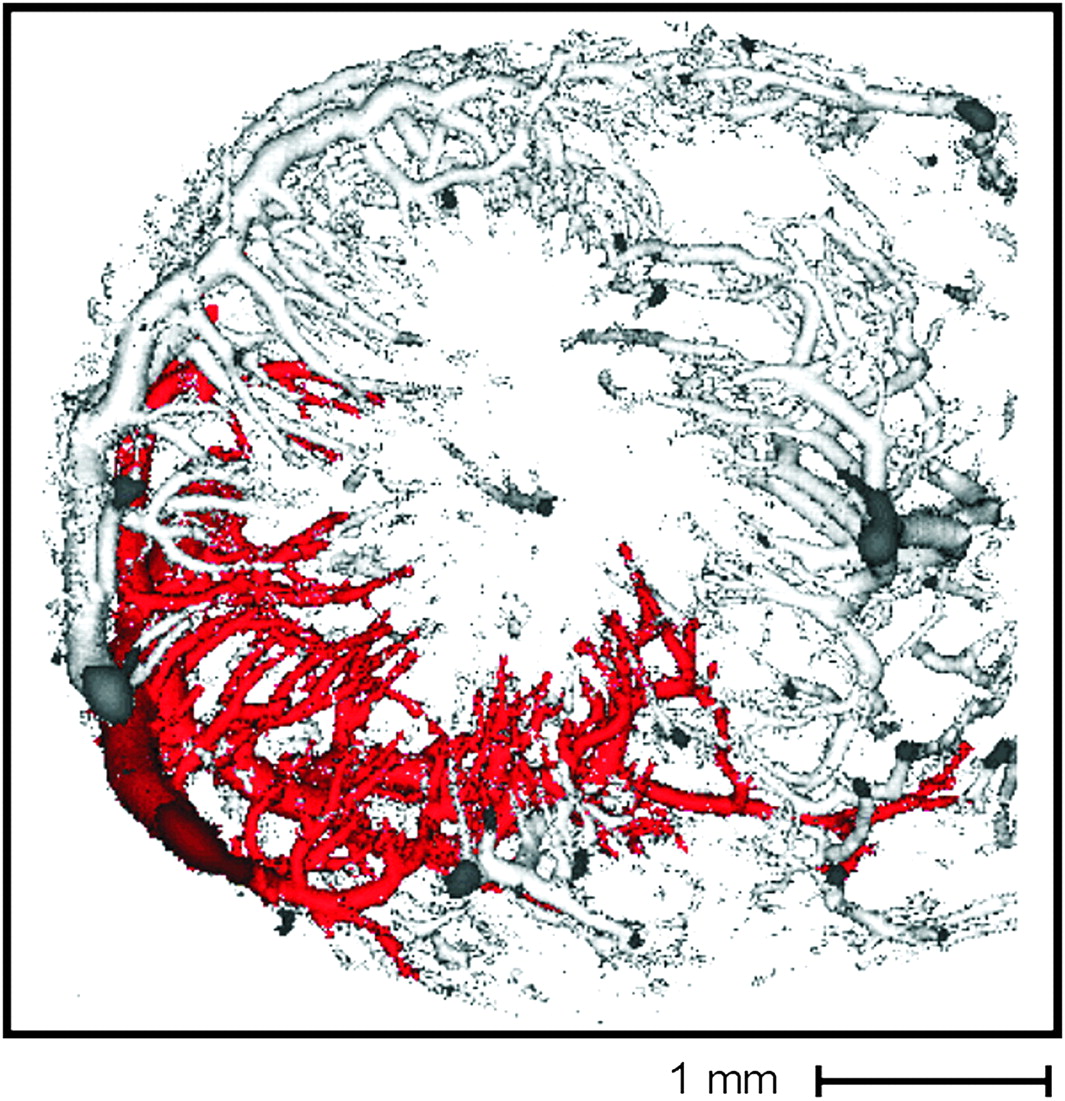
Volume-rendered display of 3D micro-CT image of coronary arteries of mouse heart wall. Single arterial tree is highlighted in red. Image was provided courtesy of Ghassan S. Kassab, Indiana University Purdue University.
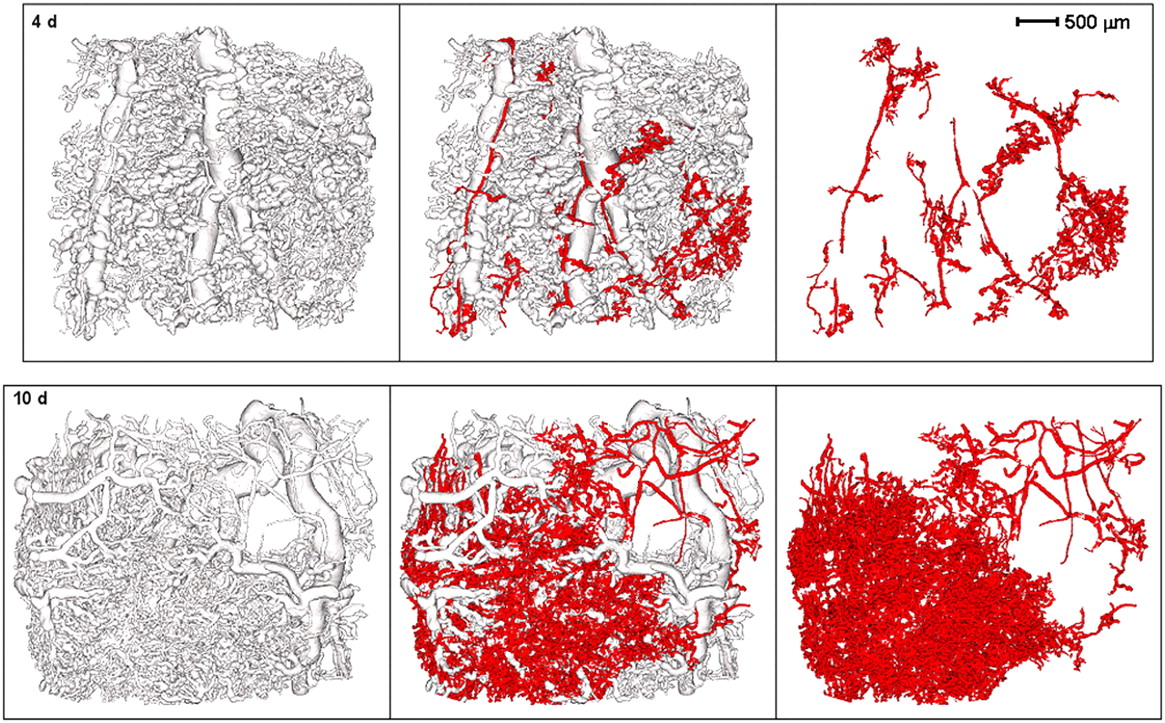
Figure 19 shows that if the microvascular tree is filled with contrast agent, then a change in the frequency of vessels below a certain size can be used to indicate the presence of an angiogenic stimulus, in this case, vascular endothelial growth factor.

Volume-rendered displays of contrast agent–filled microvasculature in mouse ear. (Top) Vessels at 4 d after local injection of vascular endothelial growth factor. Red vessels were all smaller than 60 μm in diameter. (Bottom) Mouse ear 10 d after local injection of vascular endothelial growth factor. Note large increase in highlighted small vessels. Images were provided courtesy of Dr. Janice A. Nagy, Beth Israel Deaconess Medical Center.
Most recently, benchtop nano-CT was introduced. This method generates voxels of less than 1 μm (79), the volume scanned is generally much smaller than the volume of an isolated rodent organ, and the radiation exposure may not be tolerable even in a terminal scanning session.
Now that the spatial resolution and contrast resolution of attenuation-based micro-CT seem to be reaching a practical limit (although the speed of scanning still needs improvement), there is a great opportunity to expand the repertoire of micro-CT applications by use of non–attenuation-based micro-CT approaches.
In recent years, some techniques developed with synchrotron-based micro-CT scanners have been combined with sophisticated x-ray collimation approaches (80), x-ray sensor arrays, and novel downstream image analysis approaches. These techniques have shown that x-ray–matter interactions other than the conventional attenuation approach can be applied to benchtop scanners to provide CT images with higher soft-tissue contrast and information about specific atoms (K-edge) and even molecular structure (scatter).
Multienergy, Attenuation-Based Imaging
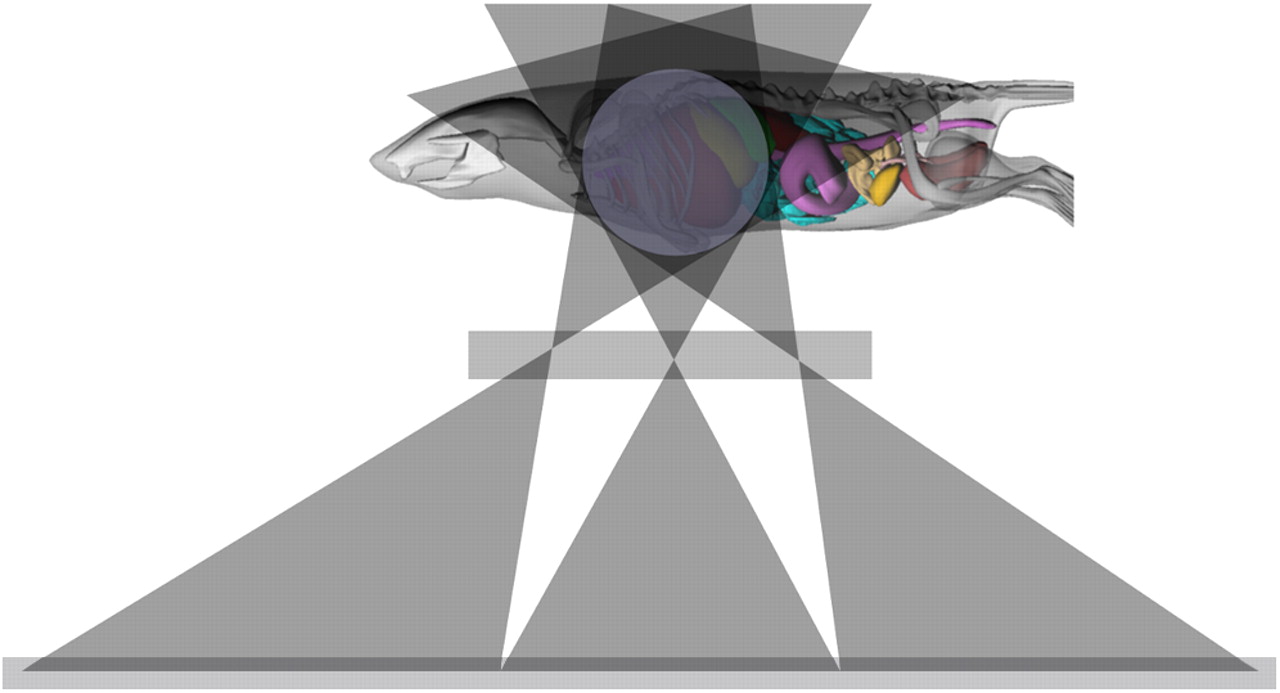
Generating CT images at high and low levels of x-ray photon energy and then subtracting those dual-energy x-ray images can differentiate certain elements (e.g., iodine in intravascular contrast agents) by virtue of their abrupt change in attenuation at a characteristic x-ray photon energy (K-edge) (81). Certain tissues can also be differentiated if their rates of decrease in x-ray attenuation with increasing x-ray photon energy differ sufficiently (e.g., iron deposits in hemochromatosis (82,83). For best results, these methods require either a monochromatic x-ray source (which is best achieved with synchrotron radiation, but quasimonochromatic spectra can be achieved with diffraction-type filtering of the bremsstrahlung x-ray emission from a roentgen x-ray source) or energy-selective x-ray detection. This quasi monochromatic approach greatly enhances the contrast of the atom of interest, thus requiring lower concentrations of the atom than would be required if just a single-energy x-ray photon were used. Figure 20 shows an example of differentiating iodine-based from barium-based contrast agents (84). The sharp change in x-ray attenuation at the K-edge of an atom is modulated slightly by the chemical bonds by which that atom is attached within a molecule. This modulation can be used to detect the chemical environment (85) but is probably unrealistic for use as the basis for an imaging technique.

(Left) Micro-CT image of transverse section through mouse lower thorax and upper abdomen. Contrast agent filled major blood vessels and stomach. Blood vessels contained iodine-based contrast agent, and stomach contained barium-based contrast agent. (Right) Color coding showing locations of barium and iodine contrast agents. Multienergy x-rays allowed discrimination of iodine, barium, and normal tissues (green). (Reprinted with permission of (97).)

(Left) CT image of test phantom used to evaluate coherent x-ray scatter image contrast of various polymers. (Middle) Same tomographic slice generated from coherent scatter of 17.5-keV x-ray beam at 12.2° from illuminating beam. (Right) Same tomographic slice generated from coherent scatter at 22 keV and 7.3°. Note removal of contrast of polymers with illuminating energy. Coherent scatter images were blurred in top-to-bottom direction because phantom was scanned at 300-μm increments in that direction, whereas regular CT scan was isotropic at 20-μm voxel resolution.
Atom-specific imaging can also be achieved by use of the fluorescent emission of an atom (86), the so-called Kα emission, in which the energy of the emitted photon is characteristic of that atom. However, because such photon energies tend to be quite low for the atoms predominantly occurring in tissues, the attenuation of those photons by the surrounding tissues makes this CT technique suitable only for small specimens.
Non–Attenuation-Based Imaging
In recent years, CT methods based on the refraction of x-rays have been shown to provide greatly improved soft-tissue discrimination by synchrotron and benchtop micro-CT scanners (87,88). This approach also has the potential to greatly reduce the x-ray exposure needed to achieve useful images. Because this method is particularly sensitive to rapid regional changes in the refractive index of tissue and, to some extent, the local microanatomic arrangement of tissue (e.g., Schwann cell layers around a nerve axon, the concentric layers of smooth muscle cells around an arteriole, or the fluid–tissue interface within an artery or an excretory duct), it can provide edge-enhanced images of important anatomic structures without the need to introduce contrast agents that enhance the contrast of physiologic spaces, such as blood vessel and excretory duct lumina.
Despite the considerable utility of the attenuation-based micro-CT approaches, they convey little information about molecules directly. However, the use of scattered x-rays as the basis for CT has the potential to provide information about specific molecules by virtue of differences in the spacing and nature of the chemical bonds in naturally occurring molecules (such as collagen) and synthetic polymeric molecules (like those often used in vascular prostheses). As illustrated in Figure 21, molecules with similar atomic contents can be differentiated by virtue of the molecule-specific x-ray scatter intensity as a function of the angle (θ) of the scatter relative to the illuminating x-ray beam (of photon wavelength λ [Å] or energy E [keV])—the so-called momentum transfer function q. This function can be expressed with the following equation: q = sin(θ/2)/λ or q = [sin(θ/2)](E/12.3). This information is best achieved with the forward coherent x-ray scatter, which has the same photon energy as the illuminating x-ray beam; in contrast, the incoherent x-ray scatter is fairly uniform around the entire illuminated specimen, except in the forward direction, and has lower photon energy than the illuminating x-ray beam. Because the scatter is proportional to the local illuminating x-ray intensity (which is attenuated as it progresses into the specimen) and the detected scatter intensity is attenuated as it emerges from the specimen, a regular CT image of the same photon energy is needed to correct for those sources of attenuation. This methodology has been successfully introduced for discriminating molecules with little difference in the attenuation of x-rays, such as various explosives and benign substances of animal or plant origin (89–92). This approach likely is relevant to cardiovascular imaging because synthetic materials used in vascular conduits, stents, and occlusive devices often have x-ray attenuation coefficients similar to those of soft tissues and hence are difficult to discriminate for purposes of evaluating appropriate anatomic positioning or material integrity.
Recently Introduced Hardware to Make New Approaches Practical
Detector Arrays
Detector arrays can make energy-selective x-ray detection practical for benchtop micro-CT (93). Combined with increased sensitivity due to the use of more efficient detector arrays for the conversion of x-ray signals to electronic signals, this feature is important because it allows the use of multienergy subtraction imaging with a conventional bremsstrahlung x-ray source; it also allows generation of the characteristic relationship of scatter intensity to scatter angle without the need to scan the scatter at multiple angles of view.
Photon-Counting Capability
The photon-counting capability of the detector increases the dynamic range so that it is limited only by the quantum noise in the x-ray image (94). This method requires the ability to count on the order of 104 photons per second for each pixel to maintain a suitable SNR. Moreover, it is greatly advantageous if the energy of each counted photon is also recorded because doing so enhances discrimination of the coherent x-ray scatter from the incoherent x-ray scatter or the separation of photons on either “side” of the K-edge of a particular atom of interest.
X-Ray Polycapillary Optics
X-ray polycapillary optics consist of bundles of hollow glass tubes with a diameter of approximately 25 μm; x-ray photons are transported along the length of the capillary tubes by internal reflection after entering the lumen (95). This collimation approach allows imaging of the scatter emerging from an illuminated plane within a specimen.
CONCLUSION
Given the increasing use of small animals for evaluating new clinical imaging techniques and providing more insight into pathophysiologic phenomena as well as the availability of improved detection systems, scanning protocols, and associated software, the sensitivity and specificity of molecular imaging are increasing.
Acknowledgments
This work was supported in part by National Institutes of Health grants R01-EB01558, U24-CA092871, and R01-EB000305.
Footnotes
-
COPYRIGHT © 2010 by the Society of Nuclear Medicine, Inc.
References
- 1.↵
- 2.↵
- 3.↵
- 4.↵
- 5.
- 6.↵
- 7.↵
- 8.↵
- 9.↵
- 10.↵
- 11.↵
- 12.↵
- 13.↵
- 14.↵
- 15.↵
- 16.↵
- 17.↵
- 18.↵
- 19.↵
- 20.↵
- 21.↵
- 22.↵
- 23.↵
- 24.↵
- 25.↵
- 26.↵
- 27.↵
- 28.↵
- 29.↵
- 30.
- 31.↵
- 32.↵
- 33.↵
- 34.↵
- 35.↵
- 36.↵
- 37.↵
- 38.↵
- 39.↵
- 40.↵
- 41.↵
- 42.↵
- 43.↵
- 44.↵
- 45.↵
- 46.↵
- 47.↵
- 48.↵
- 49.↵
- 50.↵
- 51.↵
- 52.
- 53.↵
- 54.↵
- 55.↵
- 56.↵
- 57.↵
- 58.↵
- 59.↵
- 60.↵
- 61.↵
- 62.
- 63.↵
- 64.↵
- 65.↵
- 66.
- 67.
- 68.↵
- 69.↵
- 70.↵
- 71.
- 72.↵
- 73.↵
- 74.↵
- 75.↵
- 76.↵
- 77.↵
- 78.↵
- 79.↵
- 80.↵
- 81.↵
- 82.↵
- 83.↵
- 84.↵
- 85.↵
- 86.↵
- 87.↵
- 88.↵
- 89.↵
- 90.
- 91.
- 92.↵
- 93.↵
- 94.↵
- 95.↵
- 96.↵
- 97.↵
- Received for publication December 18, 2009.
- Accepted for publication March 10, 2010.


