


Abstract
The aim of this study was to evaluate various methods for estimating the metabolic rate of glucose utilization in the mouse brain (cMRglc) using small-animal PET and reliable blood curves derived by a microfluidic blood sampler. Typical values of 18F-FDG rate constants of normal mouse cerebral cortex were estimated and used for cMRglc calculations. The feasibility of using the image-derived liver time–activity curve as a surrogate input function in various quantification methods was also evaluated. Methods: Thirteen normoglycemic C57BL/6 mice were studied. Eighteen blood samples were taken from the femoral artery by the microfluidic blood sampler. Tissue time–activity curves were derived from PET images. cMRglc values were calculated using 2 different input functions (one derived from the blood samples [IFblood] and the other from the liver time–activity curve [IFliver]) in various quantification methods, which included the 3-compartment 18F-FDG model (from which the 18F-FDG rate constants were derived), the Patlak analysis, and operational equations. The estimated cMRglc value based on IFblood and the 3-compartment model served as a standard for comparisons with the cMRglc values calculated by the other methods. Results: The values of  ,
,  ,
,  ,
,  , and
, and  estimated by IFblood and the 3-compartment model were 0.22 ± 0.05 mL/min/g, 0.48 ± 0.09 min−1, 0.06 ± 0.02 min−1, 0.025 ± 0.010 min−1, and 0.024 ± 0.007 mL/min/g, respectively. The standard cMRglc value was, therefore, 40.6 ± 13.3 μmol/100 g/min (lumped constant = 0.6). No significant difference between the standard cMRglc and the cMRglc estimated by the operational equation that includes
  was observed. The standard cMRglc was also found to have strong correlations (r > 0.8) with the cMRglc value estimated by the use of IFliver in the 3-compartment model and with those estimated by the Patlak analysis (using either IFblood or IFliver). Conclusion: The 18F-FDG rate constants of normal mouse cerebral cortex were determined. These values can be used in the
  -included operational equation to calculate cMRglc. IFliver can be used to estimate cMRglc in most methods included in this study, with proper linear corrections applied. The validity of using the Patlak analysis for estimating cMRglc in mouse PET studies was also confirmed.
PET with 18F-FDG provides a noninvasive quantitative approach to measuring the glucose utilization rates in various brain regions in vivo (1–3). Quantitative studies in rodents have been improved with the aid of better image resolutions of small-animal PET in recent years (∼1.3-mm full width at half maximum [FWHM] at the center of the field of view) (4). The quantification of cMRglc requires either dynamic imaging with an input function (i.e., using the kinetic model fitting or the Patlak analysis) or static imaging with the input function (i.e., using the operational equations) (5–8). The latter also needs the typical values of 18F-FDG rate constants ( ,
,  ,
,  , and
, and  ). In mouse studies, the 18F-FDG rate constants of mouse cerebral cortex have not been reported; therefore, the constants estimated from the rat brain have been usually used in the operational equation (9).
An input function is required by both of the dynamic and static imaging methods. The blood samples are usually collected manually from the femoral artery of a rodent (10). The total blood volume of a mouse is approximately 2 mL (e.g., ∼7.5% of the body weight of a mouse) (11). Up to 10% (e.g., ∼0.2 mL for an adult mouse) of the total blood volume can be taken from a mouse without altering significantly the physiologic conditions (12). To minimize blood loss and to overcome the procedural difficulty in sampling blood from a mouse during a dynamic small-animal PET scan, a microfluidic blood sampler was developed previously. The amount of blood loss in a quantitative study with this device was less than 5% of the total blood volume in the animal (13).
Because of the technical difficulty involved in arterial catheterization for taking blood samples from a mouse, the liver time–activity curve derived from small-animal PET dynamic images is sometimes used as a surrogate input function based on the assumption that the liver is a large blood pool and has relatively low 18F-FDG retention (14,15). Without the need of arterial catheterization, the derivation of the input function from a liver time–activity curve is highly desirable for longitudinal studies.
In this study, we performed dynamic 18F-FDG PET studies in 13 mice and, for each study, took blood samples using the microfluidic blood sampler to estimate the mouse cerebral 18F-FDG rate constants  –
– . A noninvasive-image-derived input function from the liver for estimating cMRglc by various quantification methods was also evaluated. The merits and the limitations of various quantification approaches for calculating cMRglc were discussed.
MATERIALS AND METHODS
Animal Preparation
All animal experiments were conducted in compliance with the Animal Care and Use Program established by the Chancellor's Animal Research Committee of UCLA. The animals were bred and kept in a sterilized environment at UCLA Oncology vivarium until the day of the study. Thirteen normoglycemic (6.7–15.5 mmol/L) C57/BL6 male mice (19–28.5 g) that had not fasted were studied. The average age of the mice was approximately 3 mo. Under approximately 1.5% isoflurane, a 5-cm-long catheter (PE 10 polyethylene tubing; Intramedic) filled with 50 IU of heparinized saline was cannulated into the right femoral artery of the mouse before small-animal PET. Once the femoral catheter was in place, the blood flow rate in the catheter was measured to confirm that the catheter was not clotted and had a normal flow rate (∼4 μL/s). The blood flow was measured by multiplying the traveling speed of the blood front in the catheter by the cross-sectional area of the catheter. Another catheter (a 28.50-gauge needle connected with PE 20 polyethylene tubing filled with saline) was placed in the tail vein for 18F-FDG injection.
Physiologic Variables and Small-Animal PET
During surgery, the body temperature of the mouse was maintained by a thermostat-controlled thermal heater; the mouse was imaged on a small-animal PET scanner (microPET Focus 220; Concorde Microsystems, LLC). Before dynamic small-animal PET, arterial glucose concentration was measured by a glucose meter (FreeStyle; TheraSense, Inc.). The mouse underwent a 60-min dynamic scan. 18F-FDG tracer (∼12.6 MBq) was injected as a bolus (∼60 μL) through the tail vein catheter within the first 2 s of the small-animal PET scan. After the PET scan, a 10-min CT scan was obtained for attenuation correction of small-animal PET images (16).
Reconstruction of Small-Animal PET Images
Images were reconstructed using the filtered backprojection algorithm with CT-based photon attenuation correction (16). The frame rates of the dynamic small-animal PET images were 1 × 3, 12 × 0.5, 2 × 1.5, 1 × 16, 1 × 32, 1 × 180, 1 × 300, 1 × 460, 1 × 540, 1 × 600, 1 × 750, 1 × 700, and 1 × 10 s. The voxel size was 0.4 × 0.4 × 0.8 mm3. The image resolution (FWHM) was 1.75 mm at the center of the field of view.
Derivation of Time–Activity Curves of Various Organs
To minimize the bias, manually drawn volumes of interest (VOIs) on fused PET/CT images (which provided visual guides of anatomically defined regions for the VOI selection) were used instead of the regions of highest activity. The time–activity curves of the liver, cerebral cortex, and myocardium were derived by superimposing the ellipsoid VOIs (3.2, 0.47, and 1.2 mm3, respectively) to the images of each time frame of the entire 60-min small-animal PET dynamic image sequence.
Blood Sampling and Acquisition of Input Functions
Eighteen serial blood samples were automatically taken at a set of 18 preselected sampling time points from the mouse femoral artery by the microfluidic blood sampler (13). The 18 preselected sampling time points were at 5, 7, 9, 11, 13, 15, 17, 19, 36, 53, 85, 267, 569, 931, 1,473, 2,075, 2,737, and 3,505 s of the scan time. Each collected blood sample was approximately 0.25 μL. The total blood loss of a study was less than 100 μL, which was mainly due to a 5-s quality-assurance procedure (∼20 μL) performed before the PET scan to test the cannulation and catheter connections and a dead-space clearing procedure (∼5 μL) immediately before each blood sampling for the last 10 blood samples. The blood samples were transferred to individual test tubes, and the radioactivity in each tube was counted by a γ-counter. The radioactivity was decay-corrected to the injection time. The 18F-FDG activity in plasma (IFblood) was estimated from the whole-blood samples using the following equation to correct the activity of 18F-FDG taken up by red blood cells (13): Eq. 1where RFDG is the ratio of plasma to whole blood as a function of blood-sampling time (in minutes) after tracer injection. To evaluate the use of the liver time–activity curve as a surrogate input function, the liver time–activity curve was converted to an input function (IFliver) using Equation 1.
Three-Compartment-Model Fitting
By importing the 60-min data of either IFblood or IFliver and cerebral time–activity curve into the 3-compartment model in the kinetic imaging system (7), the 18F-FDG rate constants ( [mL/min/g],
  [min−1],
  [min−1], and
  [min−1]) were estimated. The goodness of the model fitting was judged by the small sum of squares of the residual and large R values (R2 > 0.81).
 and
and  are the first-order rate constants depicting 18F-FDG forward and reverse capillary membrane transport between plasma and brain tissue, respectively;
  and
and  are the first-order rate constants characterizing phosphorylation of 18F-FDG and dephosphorylation of 18F-FDG-6-phosphate, respectively (6). The 18F-FDG uptake constant (
 [mL/min/g]) and the cerebral glucose metabolic rate (cMRglc [μmol/100 g/min]) were then calculated by:
 Eq. 2and
 Eq. 3respectively, where LC is a lumped constant representing the ratio of 18F-FDG utilization to actual glucose utilization in the brain (a LC value of 0.6 was used in this study (17)), and CP is the plasma glucose concentration measured before dynamic small-animal PET. Constant glucose concentration in plasma is assumed in the kinetic analysis. The assumption was evaluated in a separate set of 3 mouse studies under similar conditions, with approximately 20 μL of blood withdrawn every 10 min for glucose concentration measurements. The amount of change in plasma glucose concentration over 1 h was approximately 15%.
The cMRglc value calculated by Equation 3, with the values of the 18F-FDG rate constants determined by IFblood and the 3-compartment model, was considered as the standard in this study. The calculation of cMRglc by various other methods (Patlak analysis, operational equation A [Op-Eq. A] and operational equation B [Op-Eq. B]) is compared with this standard cMRglc.
The 18F-FDG uptake constants in the liver ( ) and myocardium (
 ) were also estimated with IFblood and the corresponding tissue time–activity curve.
Validation of Liver Time–Activity Curve as an Input Function
The assumption of low 18F-FDG uptake in the liver was examined by comparing the  with
with  and
and  . The reason for choosing the cerebral cortex and myocardium as the comparing tissue regions was that 18F-FDG has been commonly used for measuring glucose utilization rates in these 2 organs with PET.
To evaluate the use of IFliver in the 3-compartment-model fitting, 2 sets of 18F-FDG rate constants and cMRglc estimated by each of the 2 input functions were subjected to the paired t test and regression analysis. The validity of IFliver as an input function was determined by assessing whether the 2 sets of rate constants and cMRglc values are statistically similar (P > 0.05).
Evaluation of Various Approaches for Quantification of cMRglc
Patlak Analysis.
 and cMRglc were estimated by Patlak graphical analysis in the kinetic imaging system (for clarity, the uptake constant and glucose utilization rate were denoted as
  and cMRglc,Patlak, respectively). In the Patlak analysis, because the rate of dephosphorylation of 18F-FDG-6-phosphate (
 ) was not negligible in this study, the frames after 22 min of the small-animal PET images were excluded for the estimation of the
  (13,18). The frames in the first 3 min were also excluded because of a delay in establishing an equilibrium condition when the Patlak plot is linear. The cMRglc,Patlak was calculated from
  using Equation 3. Both IFblood and IFliver were used separately as the input function in the Patlak analysis, and the results were compared with the standard cMRglc.
Operational Equations.
The cMRglc values were calculated by Op-Eq. A, which did not include  (i.e.,
  was assumed to be small and, thus, negligible) (19),
 Op-Eq. Aand Op-Eq. B, which incorporated
  (6),
(6), Op-Eq. Bwhere
 and ⊗ denoted the operation of convolution.
  was the value of the total content of 18F per unit mass in tissue calculated from the 24th frame (duration, 50.5–59.7 min after injection) of dynamic 18F-FDG small-animal PET images.
  was the glucose concentration in plasma, and
  was the input function. 18F-FDG rate constants
  –
– , estimated by the 3-compartment model and IFblood as described earlier, were used. A LC of 0.6 was used (17). IFblood and IFliver were used separately as
  to estimate cMRglc in these 2 operational equations.
RESULTS
Estimation of 18F-FDG Rate Constants and cMRglc
The kinetic fitting of cerebral time–activity curves by the 3-compartment 18F-FDG model was good in all studies (r = 0.95 ± 0.05, n = 13). Figure 1A shows a representative quantitative analysis of the 18F-FDG kinetics in 1 of the mouse experiments. The VOIs of the cerebral cortex were drawn on fused small-animal PET/CT images (Fig. 1B; only the small-animal PET images were shown). For the 13 mouse studies, the averaged values of  ,
,  ,
,  ,
,  , and
, and  estimated with IFblood were 0.22 ± 0.05 mL/min/g, 0.48 ± 0.09 min−1, 0.06 ± 0.02 min−1, 0.025 ± 0.010 min−1, and 0.024 ± 0.007 mL/min/g, respectively (mean ± SD). The averaged cMRglc was 40.6 ± 13.3 μmol/100 g/min. This set of cMRglc values served as the standard for the comparison with cMRglc values estimated by other methods.

(A) Representative example shows quantitative analysis of 18F-FDG kinetics in mouse experiment using 3-compartment-model fitting. Dashed line is regression line that depicts goodness of model fitting (r = 0.99); • = input function derived from blood samples taken by microfluidic blood sampler (IFblood); ○ = cerebral time–activity curve derived from small-animal PET images. (B) Small-animal PET images showing VOI in mouse cerebral cortex. Coronal plane crosses over parietal cortex, which corresponds to white dotted line in sagittal plane. Ellipse on coronal plane indicates boundary of selected VOI. Arrow points to Harderian gland, and arrowhead indicates parietal cortex.
Evaluation of Liver Time–Activity Curve as an Input Function
The differences between IFblood and IFliver were shown in Figure 2. In Figure 2B, the input functions were plotted with PET equivalent counts against the logarithm of time to reveal the peaks in the early phase of the curves. The 2 input functions were not identical, especially during the early scan times. Compared with the peak of the IFblood, the peak of the IFliver was wider, lower, and delayed.
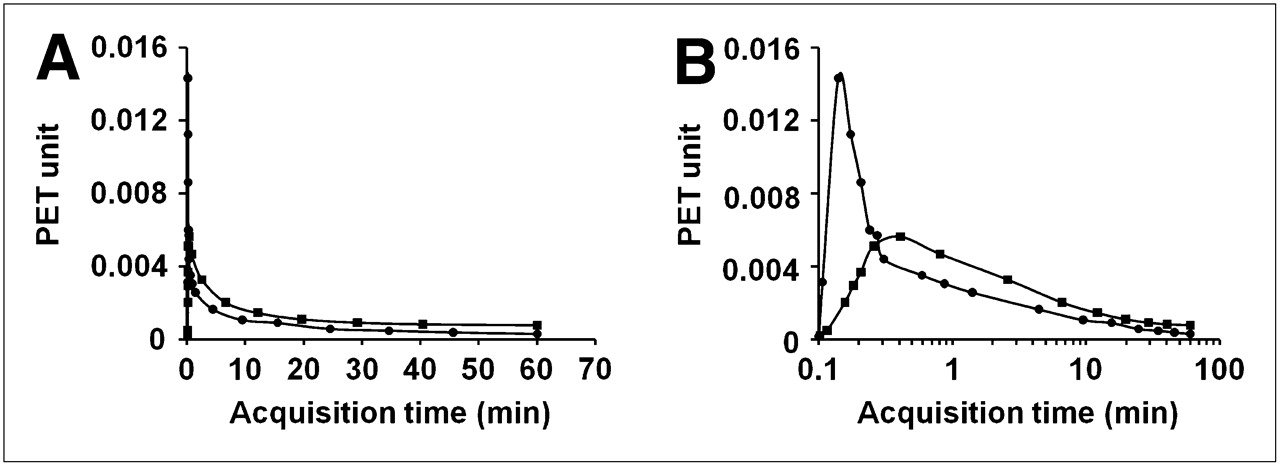
Comparison of 2 input functions. One was derived from blood samples (IFblood) and other was derived from liver time–activity curve (IFliver). (A) Plots show differences between IFblood (•) and IFliver (▪) from 1 mouse experiment. (B) Logarithmic scale in time axis is used for better visual comparison of peaks in early phase of curves shown in A. IFliver shows delayed and broader peak, compared with IFblood.
The assumption of low uptake of 18F-FDG in the liver was examined by comparing  in the liver with
  in the myocardium and cerebral cortex. Both the liver and myocardium time–activity curves were well fitted by the 3-compartment model (r = 0.987 ± 0.016 and 0.995 ± 0.011, respectively; n = 13). As shown in Figure 3, the values of
  were 0.003 ± 0.002 mL/min/g, which were relatively small, compared with the values of
  (0.12 ± 0.07 mL/min/g) and
  (0.024 ± 0.007 mL/min/g).
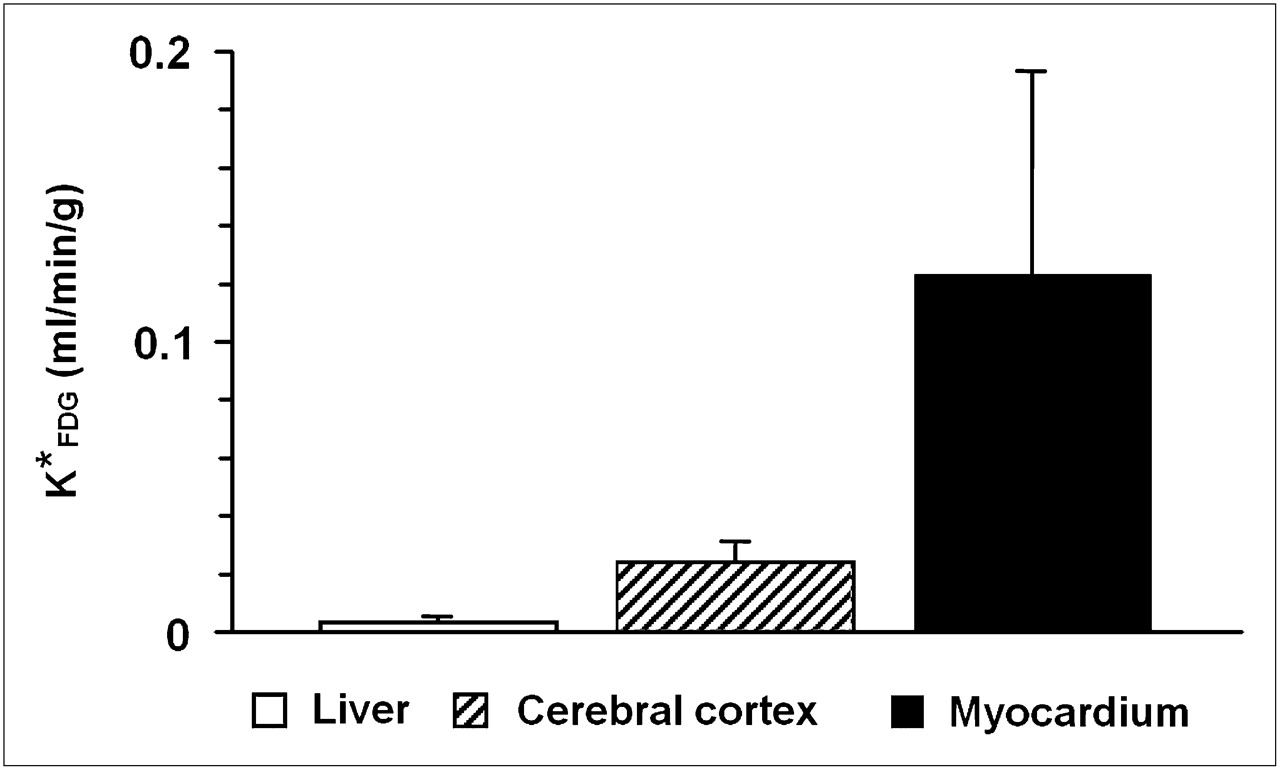
Averaged 18F-FDG uptake constants ( ) of liver, cerebral cortex, and myocardium.
  in liver, compared with that in cerebral cortex and myocardium (13% of cerebral cortex and 2.5% of myocardium), is relatively small. Error bars indicate +SD (n = 13).
In the 3-compartment-model fitting,  ,
,  ,
,  , and
, and  values estimated with IFliver were all significantly different from the corresponding ones obtained with IFblood (paired t test, P < 0.005). There was, however, no statistical difference (P = 0.986) between the values of
  . The correlations between the values from IFblood and IFliver were weak for
  ,
,  , and
, and  (r = 0.27, 0.09, and 0.35, respectively) and were relatively strong for
  and
and  (r = 0.90 and 0.81, respectively). The regression plots were shown in Figure 4. The cMRglc estimated by the 2 input functions were significantly different but well correlated (Eq. 4). The linear dependence was:
 Eq. 4
Eq. 4
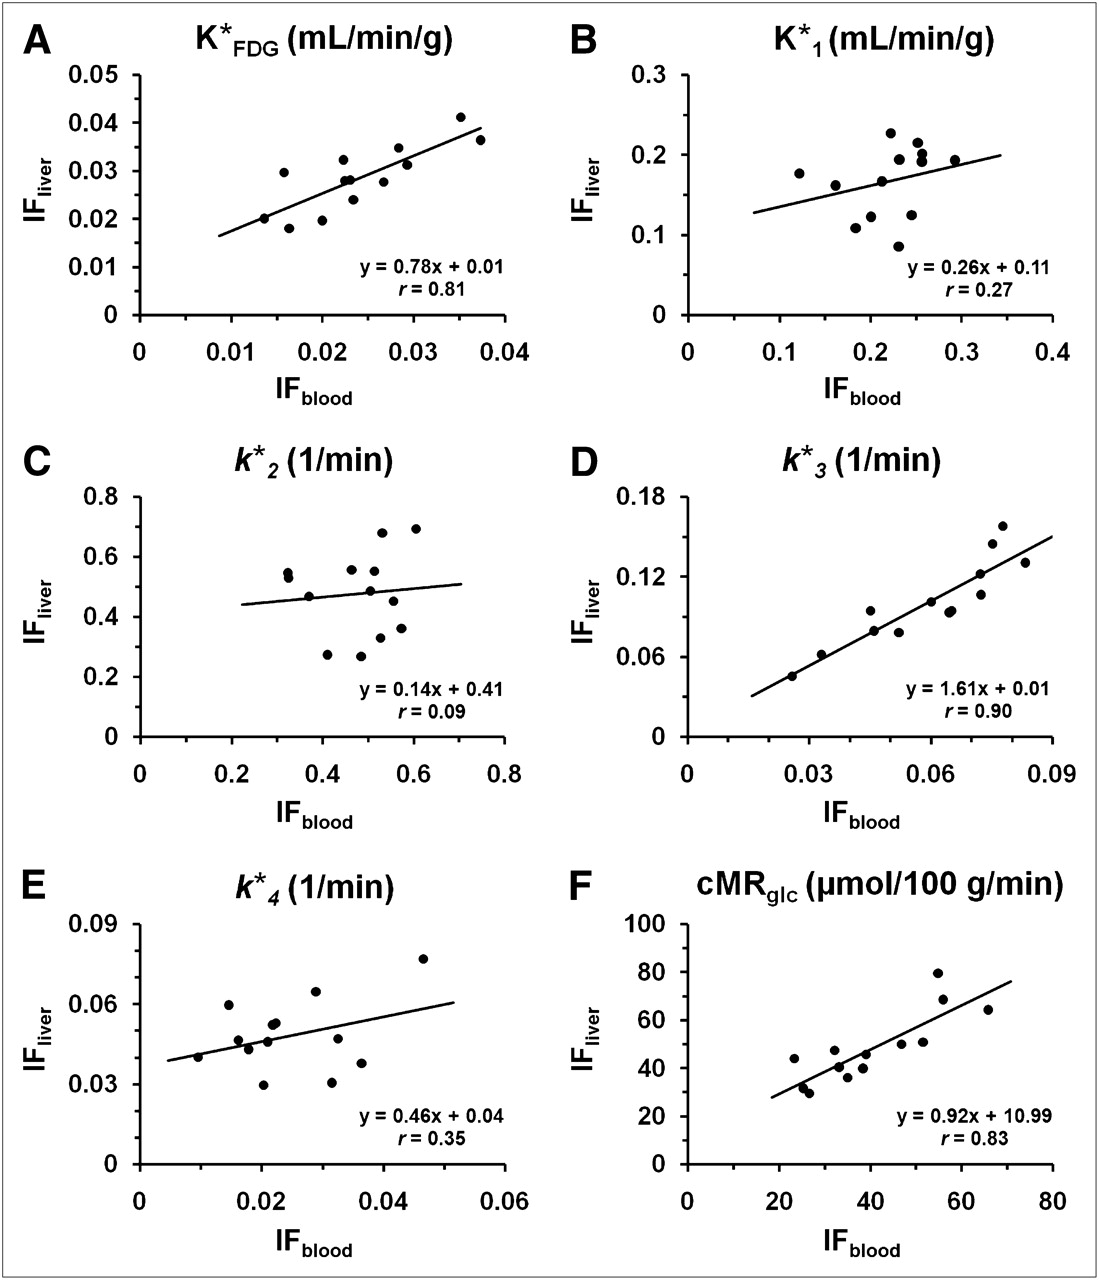
Regression analysis of 18F-FDG uptake constant,  (A), 18F-FDG rate constants,
  –k
–k (B–E), and cerebral glucose utilization rate, cMRglc (F), estimated by each of 2 input functions. Each point on graph corresponds to value estimated using IFblood and IFliver, respectively (n = 13).
Glucose Utilization Calculated by Other Quantification Approaches
Patlak Analysis.
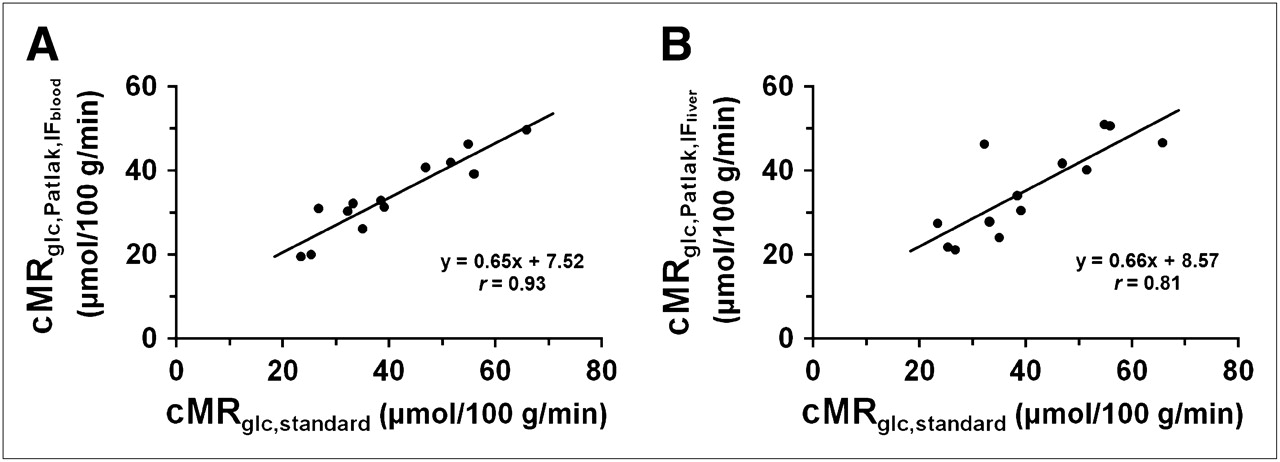
The values of  estimated by IFblood and IFliver were 0.020 ± 0.005 and 0.021 ± 0.004 mL/min/g, respectively. There was no significant difference between these 2 numbers. However, there were significant differences (paired t test, P < 0.05) between the standard cMRglc and the cMRglc,Patlak using either IFblood or IFliver, but the correlations were strong (Fig. 5). The linear relationships were:
 Eq. 5and
 Eq. 6
Eq. 6

Correlation between standard cMRglc and cMRglc estimated by Patlak model with either IFblood (A) or IFliver (B) (n = 13).
Operational Equations
The results of cMRglc, calculated by the 2 operational equations (i.e., Op-Eq. A and Op-Eq. B) with either IFblood or IFliver, were shown in Figure 6. With either IFblood or IFliver, there was no significant difference (P > 0.05) between the standard cMRglc and the cMRglc estimated by Op-Eq. B. However, a significant difference (P < 5 × 10⁻⁵) was found between the standard cMRglc and the cMRglc estimated by Op-Eq. A.

Standard cMRglc ( ), compared with cMRglc values calculated by Op-Eq. A (□) or Op-Eq. B (▪) with either IFblood or IFliver. There was no significant difference between standard cMRglc and cMRglc estimated from Op-Eq. B either with IFblood or IFliver (paired t test with regard to standard cMRglc; *P > 0.05, **P < 5 × 10⁻⁵). Error bar is +SD (n = 13).
DISCUSSION
Using the 3-compartment model with the input function derived from the arterial blood samples, we obtained the values of the 18F-FDG rate constants  –
– and the cMRglc of mouse brains. We evaluated the 3-compartment model both with a
  (
( ≠ 0) and without a
  (
( = 0) and compared their fittings (to brain time–activity curves) using statistical tests. The kinetic data fitted significantly better to the model with
  than the one without
  by Akaike's information criteria and by F test (P < 0.05). We also observed similar
  values when 3 brain tissue curves with different scan durations (i.e., 35, 45, and 60 min) from the same scan were used (20). Furthermore, in most cases, the Patlak plots had an apparent curvature at 30 min after injection (data not shown), consistent with the model fitting result that favored a nonzero
  . According to Ghosh et al. (21), substantial expression of functional glucose-6-phosphatase-β and glucose-6-phosphate transporter were found in mouse astrocytes, which accounts for more than 50% of cell mass in the mouse brain. This expression suggested that 18F-FDG-6-phosphate could be a substrate of this functional glucose-6-phosphatase that could be the molecular basis of a nonnegligible
  in the mouse brain. Because of the limited spatial resolution of small-animal PET, the image-derived time–activity curves unavoidably have contributions from heterogeneous brain tissues and, thus, might cause an overestimated
  value (22,23). To reduce this effect, brain VOIs were drawn carefully with the guidance of CT images. However, the contribution to
  from heterogeneous tissue kinetics needs further investigations with the aid of higher-resolution small-animal PET.
Using these cMRglc values as standard references, we evaluated various quantification methods for calculation of cMRglc. First, the use of the liver time–activity curve as an input function was examined. The 18F-FDG uptake in the liver tissue, compared with 18F-FDG uptake in the myocardium and cerebral cortex, was low. Although the input function derived from the liver (IFliver) is not purely arterial input, the liver is a large blood reservoir—approximately 25% of the liver volume is accounted for by blood volume (24), and the liver has low 18F-FDG uptake. Moreover, the area under the curve (AUC) over 60 min was close to the AUC of IFblood (the average AUC ratios of IFblood to IFliver was 0.98). Therefore, the good correlations in  and cMRglc between the use of the 2 input functions for various quantification methods (i.e., the 3-compartment model and the Patlak analysis) were expected and were supported by our results (Figs. 4A, 4F, and Fig. 5; Eqs. 4–6). The input functions derived from the liver time–activity curve had different shapes from IFblood. The dissimilarity in input functions was one of the causes of different estimates of
  ,
,  , and
, and  (Fig. 4). Our results suggested, however, that the input function derived from the liver time–activity curve was not reliable for estimating the values of the 18F-FDG rate constants
  –
– .
.
The methods proposed by Ferl et al. (25) and by Fang et al. (26) are alternatives to deriving input functions. On the basis of their work, the input function derived from the heart ventricle is expected to be suitable for estimating the 18F-FDG uptake constant ( ) using the 3-compartment model. However, the use of imaged-derived input functions for estimating 18F-FDG rate constants (
 –
– ) still needs to be evaluated. On the other hand, because of respiratory and heart motions, it is difficult to obtain spatial-invariant time–activity curves, and motion correction may be required.
If the cMRglc was estimated by the Patlak analysis, our results suggested that the cMRglc can be calculated using either IFblood or IFliver. However, to be comparable to the standard cMRglc obtained by the 3-compartment-model fitting, the values needed to be corrected using Equation 5 or Equation 6. With these proper corrections, only a short small-animal PET scan (e.g., 22 min used in this study) is needed for cMRglc quantification by the Patlak analysis. The time interval (3–22 min) for Patlak analysis was determined on the basis of the early onset of curvature in Patlak plots of mouse brain tissues. The Patlak plot fitted a straight line well from 3 min up to about 30 min, after which a downward curvature often appeared consistent with a nonzero  value. When later time intervals (20–40, 20–60, and 40–60 min) were used in the Patlak analysis,
  was underestimated, compared with the
  estimated by the 3-compartment model with
  . On the basis of our result, IFliver will be a favorable choice over IFblood because investigators can avoid the procedural difficulty of taking blood samples from a mouse, especially in longitudinal studies.
We also compared the standard cMRglc and the cMRglc estimated using the operational equations with or without the inclusion of a  value. There was no significant difference between the standard cMRglc and the cMRglc estimated from Op-Eq. B, either with IFblood or with IFliver, if the proper typical values of the rate constants were used. However, Op-Eq. A underestimated the cMRglc with either IFblood or IFliver (Fig. 6). Our study suggested that the
  cannot be neglected in mouse brain PET studies. To reduce the influence from
  , we explored the use of only the first 45 min of data from the IFblood and cerebral time–activity curve and recalculated the cMRglc using both operational equations. The deviations of the 2 cMRglc values from the standard cMRglc became smaller (cMRglc,Op-Eq. A increased ∼11%, and cMRglc,Op-Eq. B decreased ∼7%). These data support the contribution of
  to the difference of cMRglc obtained by the 2 operational equations.
On the other hand, to evaluate if the underestimation of cMRglc by Op-Eq. A was due to the use of nonmatching rate constants that include a  value, the rate constants were estimated by the 3-compartment model without
  and cMRglc was calculated by this set of rate constants and Op-Eq. A. We found the results were comparable to each other (22.5 ± 5.8 vs. 21.2 ± 5.7 μmol/100 g/min). Therefore, the estimated cMRglc was sensitive to the operational equation being used but not to the set of rate constants (from
  = 0 or
  ≠ 0 model) used. Because the activity of glucose-6-phosphatase in the mouse brain might be significant (21) and all our analyses favored a nonzero
  , Op-Eq. B would be more proper for cMRglc estimation in the mouse brain than would Op-Eq. A. cMRglc in the mouse under isoflurane has been measured and reported by Toyama et al. (9) to be 26.4 ± 10.3 and 26.3 ± 6.1 μmol/100 g/min using 2-deoxy-d-14C-glucose (14C-DG) and 18F-FDG, respectively; these results are comparable to the ones obtained in the present study when the same operation equation (Op-Eq. A) was used.
Two other factors that would affect the estimated value of cMRglc in specific regions of mouse brain are spillover and partial-volume effects. For spillover, the most affected regions, such as the frontal cortex, are near the Harderian gland, which has high 18F-FDG uptake in PET images and contributes to the spillover in neighboring substructures (27). Because of partial-volume effects, on the other hand, for any structure that is smaller than twice the FWHM, the amount of activity would be underestimated (28). Even though in our study the small-animal PET scanner provides the resolution of 1.75-mm FWHM at the center of the field of view, many structures in the mouse brain are smaller than 3.5 mm. In our cMRglc calculation, the influence of the spillover of the Harderian glands should be small because the VOI is distant from the Harderian glands (Fig. 1B). However, the general partial-volume effect due to the limited image resolution would result in a combined activity of the cerebral cortex and nearby structures.
Because the typical values of 18F-FDG rate constants (k* values) of mouse brain were not available before, k* values of other species, such as rats or humans, were used in the operation equation to estimate the cMRglc. Therefore, we also examined the sensitivity of cMRglc calculated by Op-Eq. B, with the k* values from human and rat brains ( , 0.102, 0.195 mL/min/g;
  , 0.130, 0.379 min−1;
  , 0.062, 0.088 min−1; and
  , 0.0068, 0.009 min−1, respectively) (3,29). The errors of using the sets of k* values derived from humans and rats were significant, about 50% and 40% underestimated, respectively. These results suggested that the k* values estimated from rats and humans are not suitable for the estimation of cMRglc of the mouse brain by Op-Eq. B.
CONCLUSION
In this study, the 18F-FDG rate constants,  –
– , of mouse cerebral cortex were estimated using the arterial blood samples and the 3-compartment model. The cMRglc values determined in this study were comparable to those reported by others (9). The 18F-FDG uptake in mouse liver was shown to be relatively low, as compared with 18F-FDG uptake in the myocardium and brain. Our results verified that the liver time–activity curve can be used as an input function to estimate cMRglc (using either the operational equation incorporating
  , the Patlak analysis, or the 3-compartment model), though some adjustments in the estimated results are needed. However, reliable estimation of the 18F-FDG rate constants requires arterial blood samples.
Acknowledgments
We acknowledge the contributions of Dr. Nagichettiar Satyamurthy, Dr. David Stout, Waldemar Ladno, and Judy Edwards for technical assistance. This work was supported by the UC Discovery grant bio05-10510, RO1-EB001943, DOE DE-FC03-02ER63420, and NINDS 1R21NS059610-01A1.
Footnotes
-
Guest Editor: Tove Gronroos, Turku PET Centre
-
COPYRIGHT © 2009 by the Society of Nuclear Medicine, Inc.
References
- Received for publication November 25, 2008.
- Accepted for publication February 27, 2009.


Jump to section
Related Articles
Cited By...
- Assessment of Brain Glucose Metabolism Following Cardiac Arrest by [18F]FDG Positron Emission Tomography
- Image-Derived Input Function from the Vena Cava for 18F-FDG PET Studies in Rats and Mice
- Brain Glucose Transport and Phosphorylation Under Acute Insulin-Induced Hypoglycemia in Mice: An 18F-FDG PET Study
- Quantification of Brain Glucose Metabolism by 18F-FDG PET with Real-Time Arterial and Image-Derived Input Function in Mice