


Abstract
Measurement of arterial input function is a restrictive aspect for quantitative 18F-FDG PET studies in rodents because of their small total blood volume and the related difficulties in withdrawing blood. Methods: In the present study, we took advantage of the high spatial resolution of a recent dedicated small-animal scanner to extract the input function from the 18F-FDG PET images in Sprague–Dawley rats (n = 4) and C57BL/6 mice (n = 5), using the vena cava. In the rat experiments, the validation of the image-derived input function (IDIF) method was made using an external microvolumetric blood counter as reference for the determination of the arterial input function, the measurement of which was confirmed by additional manually obtained blood samples. Correction for tracer bolus dispersion in blood between the vena cava and the arterial tree was applied. In addition, simulation studies were undertaken to probe the impact of the different IDIF extraction approaches on the determined cerebral metabolic rate of glucose (CMRGlc). In the mice measurements, the IDIF was used to compute the CMRGlc, which was compared with previously reported values, using the Patlak approach. Results: The presented IDIF from the vena cava showed a robust determination of CMRGlc using either the compartmental modeling or the Patlak approach, even without bolus dispersion correction or blood sampling, with an underestimation of CMRGlc of 7% ± 16% as compared with the reference data. Using this approach in the mice experiments, we measured a cerebral metabolic rate in the cortex of 0.22 ± 0.10 μmol/g/min (mean ± SD), in good agreement with previous 18F-FDG studies in the mouse brain. In the rat experiments, dispersion correction of the IDIF and additional scaling of the IDIF using a single manual blood sample enabled an optimized determination of CMRGlc, with an underestimation of 6% ± 7%. Conclusion: The vena cava time–activity curve is therefore a minimally invasive alternative for the measurement of the 18F-FDG input function in rats and mice, without the complications associated with repetitive blood sampling.
Glucose metabolism can be efficiently measured in vivo using PET and adequate radiotracers, such as the glucose analog 18F-FDG, opening the way to a large range of metabolic studies in rodents (1). The quantification of the metabolic rate of glucose (MRGlc) from 18F-FDG PET experiments requires the knowledge of the arterial input function (AIF), which is typically measured by serial arterial blood sampling (2). However, in small animals, the total amount of blood is limited and continuous blood sampling over the entire experiment duration (on the order of 45 min) is technically challenging and might affect the physiology of the animal.
Several methods have been developed in the last decade to overcome this difficulty. New microfluidic blood sampling devices were developed to minimize the amount of blood withdrawn (3). Another method minimizing blood losses is the use of an arteriovenous shunt, coupled with either a γ coincidence counter (4) or a β probe (5). A further approach is to insert a β probe directly in the femoral artery, to measure the blood activity without blood withdrawal (6). Although the AIF can be measured with high temporal resolution using this method, the insertion of the probe and the correction for background radioactivity remains technically challenging.
Several studies reported the extraction of the input function from the PET images. In human studies, the carotid arteries (7), the heart (8), or the ascending aorta (9) were successfully used to measure the 18F-FDG input function, opening the way to facilitated clinical MRGlc measurements. In rodents, the extraction of 18F-FDG image-derived input functions (IDIF) was generally focused on the heart (10), because of the limited spatial resolution of small-animal PET scanners and the related difficulty to delineate blood vessels. However, IDIF extraction from the heart in small animals is limited by the large partial-volume effect and spillover from the myocardium, requiring the application of elaborate statistical methods such as factor analysis (11–13) to overcome this limitation by deconvolving the blood and myocardium contributions to the heart time–activity curve. Finally, simplified glucose uptake measurements using standard input functions scaled by at least 1 blood sample were developed (14). The limitation of this method lies in the necessity of a rigid and repeatable infusion protocol. Moreover, the physiologic conditions of the animal (e.g., age, disease model, anesthesia) might affect the evolution of the tracer in the precursor pool.
The aim of the present study was to take advantage of the high spatial resolution and sensitivity of recent small-animal PET scanners to extract the 18F-FDG input function from the PET image of small rodents, using a large blood vessel, here the inferior vena cava (∼2 mm diameter). Compared with the heart ventricles, the vena cava is much less affected by spill-in contamination from neighboring tissues and an image-derived input function might be extracted with minimal postprocessing. The vena cava is also expected to be directly visible on the PET images in the first time frames after the bolus 18F-FDG injection through the femoral or tail vein. The accuracy and precision of the IDIF were evaluated by comparison with an external automated blood counter AIF and with manual blood sampling.
MATERIALS AND METHODS
Animal Preparation
All animal preparation procedures were performed in accordance with local and federal guidelines and were approved by the local ethics committee from the canton Vaud. Four healthy Sprague–Dawley rats (281 ± 18 g, mean ± SD), housed with free access to food and water, were anesthetized with 2% isoflurane in O2 during surgery. One femoral artery was cannulated for manual blood sampling. The second femoral artery was cannulated for the measurement of the arterial input function in the external microvolumetric β blood counter (15). Both femoral veins were catheterized. One vein was used for the injection of 18F-FDG, and the second one completed the arteriovenous shunt guided through the blood counter (Fig. 1). In a second step, 5 C57BL/6 mice (30 ± 3 g, mean ± SD), housed with free access to food and water, were anesthetized with 2% isoflurane in O2 during the cannulation of the tail vein for tracer injection.

Illustration of the experimental setup used for rats in this study. 1) PET field of view. 2) Manual blood sampling. 3) 18F-FDG injection. PET field of view was centered on region caudal to heart, to image vena cava. External microvolumetric blood counter was measuring blood activity in arteriovenous loop between left femoral artery (A) and vein (V). 18F-FDG injection was done in right femoral vein, and right femoral artery was used for manual blood sampling. During acquisition, no injection or blood withdrawal was made on left arteriovenous loop, to avoid perturbing measurement with external blood counter.
After preparation, the animal was placed on the heated carbon fiber bed of the PET scanner, and anesthesia was maintained with 1.3%–1.8% isoflurane in 100% O2. Breathing rate and body temperature were continuously monitored through a respiration pillow and a rectal thermosensor, respectively (SA Instruments Inc.). Body temperature was maintained at a constant (37.5°C ± 0.5°C) by adjusting the current in the heating bed.
18F-FDG PET Scan
All the PET data were acquired on an avalanche photodiode–based LabPET-4 small-animal scanner (Gamma Medica-Ideas Inc., formerly Advanced Molecular Imaging Inc.) (16–18). The reconstructed standard voxel size is 0.5 × 0.5 × 1.18 mm, and the achieved intrinsic radial and axial resolutions are 1.15 and 1.09 mm (16,18–20). Data were collected in list mode (16), which allows full flexibility in the choice of time frames in the reconstruction protocol.
The rats were positioned prone, head first, and the field of view was centered on the thoracic region, caudal to the heart. Within the first minute of the 45-min PET acquisition, a bolus of 18F-FDG was manually injected through the right femoral vein (injected dose, 59 ± 8 MBq) and followed by a saline chase.
The mice were scanned prone, head first, with the field of view covering the region from the brain to the vena cava (∼1 cm caudal to the heart). A bolus of 18F-FDG was manually injected through the tail vein during the first minute of the 30-min PET acquisition (injected dose, 57 ± 1 MBq) and followed by a saline chase.
The images were reconstructed using the maximum likelihood expectation maximization iterative reconstruction algorithm (21) with a circular field of view of 80 mm in diameter for rats and 46 mm for mice. The data were reconstructed dynamically with a varying temporal resolution (5 s over the first 2 min, 30 s over 3 min, 2 min over 10 min, and 5 min over the remaining acquisition time). The high temporal resolution at the time of 18F-FDG injection is necessary to characterize properly the input function, which varies rapidly during this period. The LabPET-4 built-in calibration method was used to obtain quantified PET images in Bq/mL. Scatter correction was applied using a detection energy window (250–650 keV) and a coincidence timing window of 22.2 ns. No attenuation corrections were applied. The postprocessing of the PET images and activity density extraction from the volumes of interest (VOIs) were undertaken with the PMOD 2.95 software (PMOD Technologies Ltd.).
Using the first time frames after the 18F-FDG injection, we located the inferior vena cava in the PET images by inspecting the maximum-intensity-projection image in the coronal plane, in which the flow of the 18F-FDG bolus and the following chase were pinpointed (Fig. 2). The time frame corresponding to the bolus first-pass was then selected for the construction of the VOI, drawn over the corresponding axial slices. The VOI consisted of 1-mm square regions of interest drawn over 4 successive axial slices (each of 1.18-mm thickness), placed on the inferior vena cava, at a sufficient distance (>6 mm) from the heart and the kidneys to avoid radioactivity contamination. This process resulted in a total VOI of 4.7 mm3. In mice, a second VOI (1 × 1 × 2.36 mm3) was placed in the cortex to measure brain tissue–activity curve to determine the cerebral metabolic rate of glucose (CMRGlc).
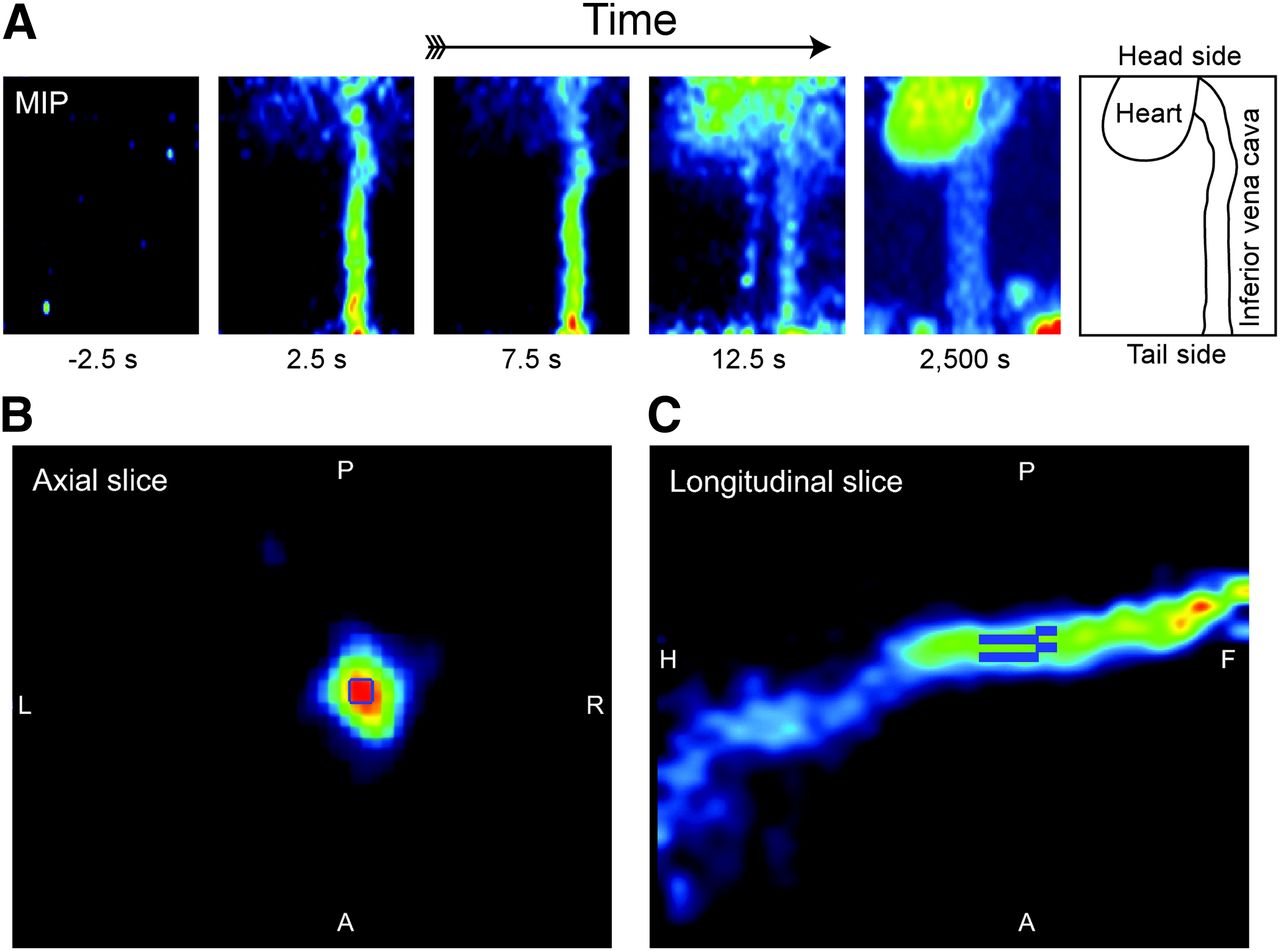
PET images of vena cava in rat during first passage of 18F-FDG bolus, used to define VOI for image-derived input function. (A) Maximum-intensity-projection (MIP) maps on coronal plane, used as temporal marker to determine time frame at which tracer bolus is flowing through vena cava. 18F-FDG was injected in femoral vein, and tracer bolus flowing from rear part of animal to heart can be observed in reconstruction time frame of 5 s. Last MIP image shows steady-state 18F-FDG labeling 42 min after tracer injection, underlining low 18F-FDG tissue uptake around vena cava. Time indicated under each image corresponds to middle of reconstructed time frame, where t = 0 s was set at start of 18F-FDG injection. (B) Axial slice of vena cava during time frame corresponding to first passage of 18F-FDG bolus, as observed in MIP. VOI was defined as 1 × 1 mm square regions on 4 consecutive slices (slice thickness, 1.18 mm), centered on highest activity part of vein. (C) Sagittal slice showing total VOI, consisting of 4 cuboids, resulting in 4.7 mm3 volume of detection. This view represents snapshot of bolus of tracer flowing from rear part of animal to heart (on left of picture). A = anterior; F = feet; H = head; L = left; P = posterior; R = right.
Flow-Through Blood Counter
A microvolumetric β blood counter (15) was used for the continuous measurement of the arterial input function in rats. This flow-through blood counter was part of an arteriovenous shunt between the left femoral artery and the left femoral vein. The arteriovenous loop was built in a way similar to what was presented previously (4), with some minor modifications. No 3-way valve was inserted on the arterial side before the blood counter, to avoid additional dead-volume between the sampling point and the detector and the related delay in the arterial input function measurement. The loop consisted of polyethylene tubing PE-50 (inner diameter, 0.58 mm; outer diameter, 0.965 mm; 2.6 μL/cm). The length between the sampling point and the detector was 35 ± 2 cm. No blood sampling was made through the shunt, to avoid any possible interruption of blood flow in the loop and related artifacts on the measured input function. The measurement on the microvolumetric β blood counter was started simultaneously with the beginning of the PET acquisition, and the data were acquired with a temporal resolution of 1 s. The arterial input function measured with the blood counter was corrected for the radioactive decay (relative to the start of the acquisition). The blood flow through the arteriovenous loop, verified at the beginning and the end of the experiment using the 3-way valve, was on the order of 20 μL/s, corresponding to a blood transit time from the femoral artery to the blood counter of less than 5 s.
Manual Blood Sampling
The accuracy of the input function measurements obtained with the microvolumetric blood counter or derived from the PET image in rats was verified by sampling blood at discrete time points. Manual blood samples (20 ± 0.5 μL, mean ± SD) were taken from the right femoral artery at 1.5, 5, 10, 20, and 35 min after the injection and stored into preweighed and postweighed Eppendorf tubes. The tubes were later scanned in a γ counter (Wallac 1470 WIZARD Gamma Counter; Wallac OY). The measured radioactivity was corrected for the radioactive decay (relative to the start of the acquisition), and blood radioactivity density was calculated using the difference in weight of the filled Eppendorf tubes.
CMRGlc Measurement in Mice
The CMRGlc was determined in mice with the Patlak plot method (22,23), using the raw IDIF from the vena cava and the tissue activity from the cortex. The plasma activity was estimated from the whole-blood activity using a monoexponential correction function, as previously published (3).
The plasma glucose concentration was measured with a manual blood sample from the tail artery at the end of the PET acquisition and the lumped constant (LC). LC for 18F-FDG metabolism was fixed to 0.6, as previously found in mice (24). To avoid an effect of a nonzero FDG-6P dephosphorylation rate ( ) (25), we limited the acquisition to 30 min.
Correction for Tracer Dispersion Between Sampling Locations
In a further step, an additional processing was applied to the IDIF obtained in the rat to correct for tracer dispersion in the bloodstream. The IDIF was measured in the inferior vena cava, whereas the manual blood samples and the arterial input function determined with the microvolumetric β blood counter were measured in the right and left femoral arteries. The injection of 18F-FDG was made through the femoral vein. Between the IDIF sampling site and the femoral arteries, the tracer travels twice through the heart and passes through the pulmonary circulation, a highly branched circulatory route, resulting in a dispersion of the tracer and time delays. The dispersion of the tracer bolus between the vena cava and the femoral arteries was thus considered as follows.
A double-exponential dispersion function was used to model the tracer dispersion between the inferior vena cava and the femoral artery, similar to what has been previously introduced in CT studies using iodinated contrast agents (26) and is an extension of the monoexponential dispersion function applied in 15O PET blood flow studies (27–29).
The explicit form of the applied dispersion function was: Eq. 1where b represents the weight of each exponential function in the dispersion function. Note that
  . The factor a was introduced to take into account a possible systematic difference in total specific activity measured in the vena cava and in the femoral artery due to, for example, tracer uptake between the 2 sampling sites or calibration effects between the different measurement methods as well as spillover effects.
The dispersion-corrected input function g(t) was calculated as the convolution of the input function measured in the inferior vena cava with the dispersion function: Eq. 2The parameters a, b, τ1, and τ2 were optimized by fitting the dispersion-corrected IDIF measured in the inferior vena cava to the arterial input function measured with the microvolumetric β blood counter for each of the 4 experiments using the function presented in Equation 1.
The convolution operations and parameter optimizations were undertaken with Matlab (The MathWorks), using a modified Levenberg–Marquardt nonlinear regression method. Generic values of the parameters a, b, τ1, and τ2 were estimated as their respective mean value found over the 4 rats. A corresponding generic dispersion function was generated and used to create dispersion-corrected IDIFs for every animal. Three different methods of dispersion-corrected IDIFs from the vena cava were analyzed (summarized in Table 2): first, the activity measured in the vena cava VOI for each animal was corrected using the generic parameters for the dispersion function (Table 1). In the second method, the scaling parameter a was set to 1, whereas the same values were used for the other parameters b, τ1, and τ2 (Table 1). Finally, in the third method, the generic parameter values were used (Table 1), whereas the first manual blood sample at 1.5 min was used to scale the dispersion-corrected input function such as (Eq. 2) g(1.5 min) = sample(t = 1.5 min). In addition, the approaches using IDIF uncorrected for tracer dispersion were analyzed using the raw IDIF from the vena cava (method 4) and the raw IDIF from the vena cava scaled with the first manual blood sample at 1.5 min (method 5), as in method 3.
Parameters Characterizing Dispersion Function of Tracer in Blood, from Vena Cava to Blood Counter Sampling Point in Femoral Artery
The validity of these generic values were tested by comparing each dispersion-corrected IDIF, using the generic values, with the respective arterial input function measured with the microvolumetric β blood counter and the manual blood samples. The effect of the various extracted IDIF on the determined CMRGlc using either the compartmental modeling approach of 18F-FDG uptake or the Patlak approach was evaluated on the basis of simulated brain tissue 18F-FDG uptake curves, generated with the compartmental model of 18F-FDG uptake, the AIF measured with the microvolumetric β blood counter in each rat, and typical metabolic constants (K1 = 0.221 min−1, k2 = 0.164 min−1, and k3 = 0.037 min−1; plasma glucose level = 5 mM and LC = 0.71 (30)). For each animal, the cerebral metabolic rate of glucose was then estimated with the compartmental modeling approach (CMRGlc) or the Patlak approach (CMRGlc_Patlak) using each of the IDIF extraction approaches and the simulated tissue–activity curve. The ratio of the determined CMRGlc or CMRGlc_Patlak to the true CMRGlc was then averaged for all rats and reported. Metabolic modeling and parameter estimation were undertaken with Matlab, using a modified Levenberg–Marquardt nonlinear regression method.
RESULTS
Image-Derived Input Function from Tracer Activity in Vena Cava
The radioactivity measured in the vena cava typically presents 2 sharp peaks, corresponding to the bolus passage of 18F-FDG followed by the saline chase advancing the remaining tracer from the infusion line into the circulation (Fig. 3). Compared with the input function measured with the microvolumetric blood counter, the radioactivity bolus measured in the vena cava was shorter and reached a higher maximum. However, 100 s after the start of the PET acquisition (about 1 min after the tracer injection), the time course of the radioactivity in the vena cava closely paralleled that of the blood counter and the manual blood samples. This reflects an effect of tracer dispersion in the blood, between the vena cava and the femoral artery, used as sampling point for the external blood counter.

Arterial input function measured in femoral artery with microvolumetric blood counter (gray line), manual arterial blood samples (white circles), and time–activity curve measured in vena cava, corrected for time delay (red line). Inset shows first 300 s of those 2 curves.
To validate the measurements of blood radioactivity using the microvolumetric blood counter placed in the arteriovenous shunt, manual arterial blood samples were measured (Fig. 3). In all the rats, the input function measured with the blood counter in the arteriovenous shunt matched the blood activity measured by manual sampling, confirming the accuracy of the blood counter measurement. The tracer bolus was detected within 3 s after the injection, when measured with the blood counter.
Correction for Tracer Dispersion Between Sampling Locations
To determine the transfer function characterizing the dispersion between the 2 input functions for each animal, the raw IDIF convolved with the biexponential dispersion function (Eq. 1) was fitted to the activity curve measured with the blood counter by adjusting a, b, τ1, and τ2 in Equation 1, summarized in Table 1. The factor a was found to be slightly higher than 1, reflecting a general underestimation of the IDIF possibly due to spill-out of blood activity from the VOI.
The averaged scaling factor found in method 3, using a single blood sample at 1.5 min, was 1.09 ± 0.12 (n = 4). The averaged scaling factor found in method 5 with the same blood sample was 1.24 ± 0.11 (n = 4). For each animal, the ratio of the area under the curve (AUC) of the IDIF measured in the vena cava and the AUC measured with the blood counter was calculated, showing an AUC measured with the IDIF close to that measured with the external loop (third row, Table 2). The effect on the estimated CMRGlc using the compartmental modeling approach or the Patlak approach was analyzed by calculating the ratio of the CMRGlc obtained with each IDIF approach to the true CMRGlc used to generate the simulated tissue activity curves (fourth and fifth rows, Table 2).
Overview of 5 Methods Used to Determine 18F-FDG Input Function from Vena Cava Time–Activity Curve in Rat
When correcting the image-derived input function using the generic dispersion function and using the assumptions of method 1 (a, b, τ1, and τ2 fixed to their mean values listed in Table 1), excellent agreement with both the arterial input function measured with the external blood counter and the manual samples was noted. When correcting the IDIF for dispersion using method 3 (b, τ1, and τ2 fixed to their mean values listed in Table 1 and a single blood sample measured 1.5 min after injection used to scale the input function), possible discrepancy in the AUC between the IDIF and the reference AIF due to partial-volume effects was minimized, which increased the robustness of the IDIF determined on single animals (Fig. 4B; Table 2, method 3).

Example of dispersion-corrected image-derived 18F-FDG input function obtained from vena cava of rat. Correction was made using dispersion function (Eq. 1) with average parameter values for a, b, τ1, and τ2 estimated from group of rats (generic dispersion function). Corrected input function presented here was derived from vena cava time–activity curve shown in Figure 3. Inset shows first 300 s of those 2 curves. (A) IDIF was corrected for dispersion using generic values for parameters a, b, τ1, and τ2 (Eq. 1) determined from the group of rats (method 1). No blood sample was needed to calibrate curve. (B) IDIF was corrected for dispersion using generic values for parameters b, τ1, and τ2 (Eq. 1) determined from group of rats. Input function was further scaled using first blood sample, measured 1.5 min after tracer injection (method 3).
Sensitivity of CMRGlc and CMRGlc_Patlak to Different IDIF Approaches in Rats
The CMRGlc values estimated with the different IDIF approaches showed a consistent recovery of the true CMRGlc value used to generate the simulated tissue activity curves, both for the metabolic modeling approach (CMRGlc) and for the Patlak approach (CMRGlc_Patlak), within 10% of accuracy except for method 5, for which the raw IDIF was scaled with the first blood sample taken 1.5 min after tracer injection (Table 2). Interestingly, the raw IDIF gave results similar to the methods considering dispersion-corrected IDIF. In method 3, scaling the dispersion-corrected IDIF with a single blood sample measured 1.5 min after 18F-FDG injection enabled an increased robustness of the determined CMRGlc and CMRGlc_Patlak across animals.
IDIF and CMRGlc Measurement in Mice
CMRGlc was determined in the mouse cerebral cortex (n = 5) by applying the Patlak plot analysis using the raw IDIF from the vena cava. A typical input function and Patlak analysis are shown in Figure 5. The average CMRGlc value was 0.22 ± 0.10 μmol/g/min, for an average glycemia of 4.9 ± 3.6 mM.
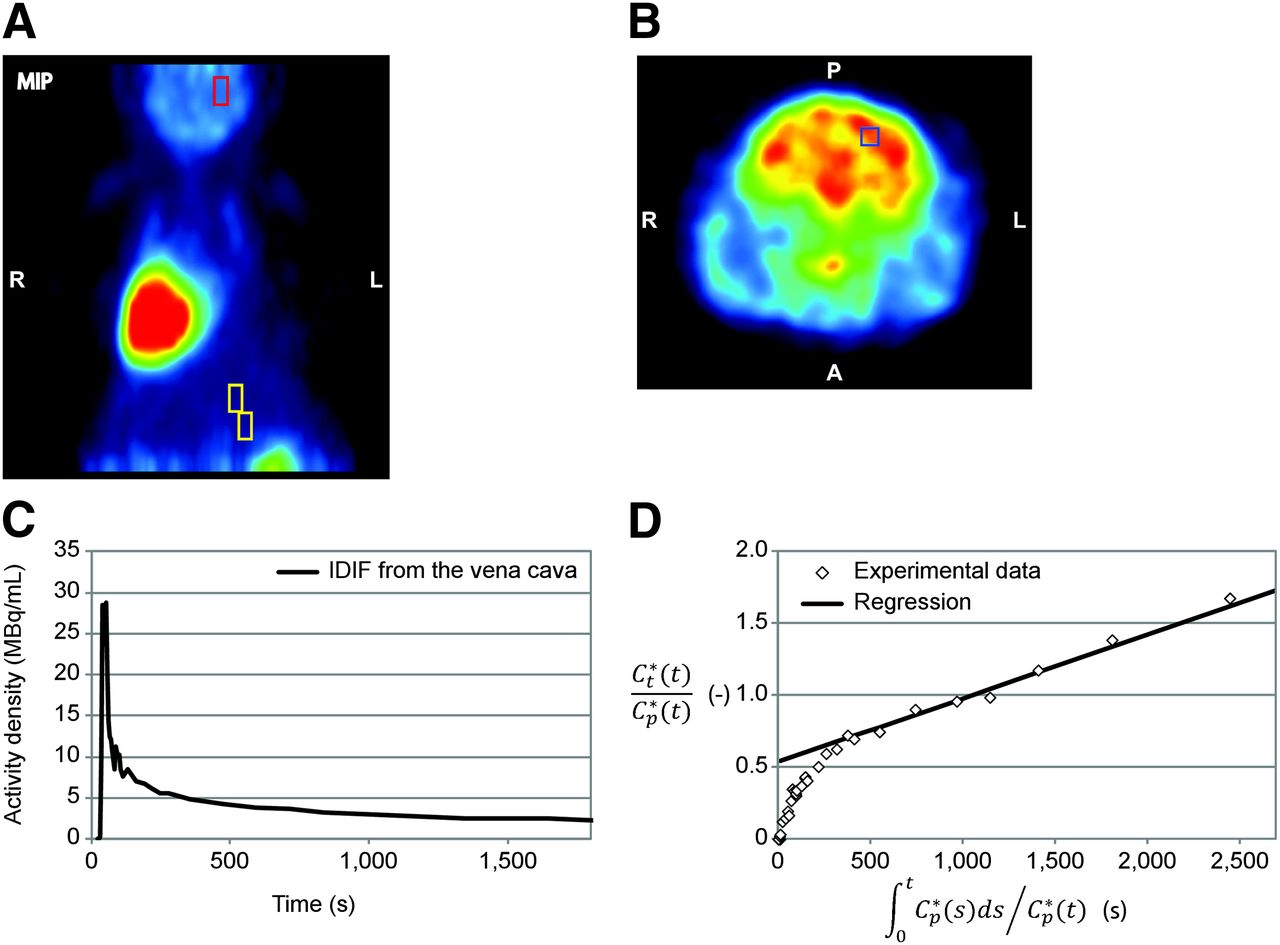
CMRGlc measurement in mouse cerebral cortex. (A) Localization on horizontal maximum-intensity projection of VOI used for extraction of IDIF on vena cava (yellow box, 4.7 μL) and VOI placed in cortex for measurement of tissue activity curve (red box). (B) Localization of the 1 × 1 × 2.36 mm VOI in cortex. Image shows 15-min PET acquisition obtained 23 min after bolus injection of 18F-FDG. (C) IDIF measured from vena cava, corrected for difference in plasma and whole-blood 18F-FDG concentrations. (D) Patlak plot obtained using tissue–activity curve measured in cortex and IDIF. A = anterior; L = left; P = posterior; R = right.
DISCUSSION
In this study, we present a method to measure an image-derived 18F-FDG input function in rodents from the inferior vena cava, readily identified in the 18F-FDG PET image by the first passage of the 18F-FDG bolus. Although affected by tracer dispersion effects in blood during the first minute after the bolus injection, this input function follows closely the standard AIF measured by external blood sampling, which makes it a technically simple alternative for CMRGlc measurements in rodents using 18F-FDG. In order to take into account effects of tracer dispersion between the vena cava and the arteries, in which the arterial input function is commonly measured, a biexponential dispersion function was introduced, for which parameters were determined by adjusting the dispersion-corrected IDIF to the arterial input function measured with an external blood counter, used as reference. To optimize the accuracy of the IDIF, the dispersion-corrected input function was scaled using a single blood sample, resulting in an increased accuracy of the IDIF extraction in single animals.
Blood vessels are difficult to identify in PET images of rodents and when located, the relatively low spatial resolution of small-animal PET scanners can lead to partial-volume effects and positron diffusion leads to spillover contaminations, typical for VOIs measured in the myocardium (10).
The inferior vena cava has the advantage of being sufficiently distal (compared with the positron range) from large organs with significant 18F-FDG uptake, such as the heart and the kidneys, while still having a reasonably large diameter (1–2 mm in mice and 2–3 mm in rats (31–33)) suitable to be resolved by the LabPET-4 (radial resolution, 1.1 mm) and the positron range in tissue (1 mm for 18F (34)), thereby minimizing potential partial-volume effects and spillover contaminations or losses. In all the measured animals, the maximum-intensity projection map could be conveniently used to locate the time frame corresponding to the first passage of 18F-FDG through the vena cava (Fig. 2). Taking advantage of the high spatial resolution of the small-animal LabPET-4 scanner, the VOI was placed over the inferior vena cava at this particular time frame. The vena cava presented the characteristics of being identifiable on the first time frames of the PET reconstruction after the 18F-FDG bolus injection through the tail vein or femoral vein, without requiring additional anatomic images. In human studies, other large vessels such as the ascending aorta (9) were used for IDIF determination. In rodents, however, although the ascending aorta diameter is similar to the vena cava, the ascending aorta could not be identified on the first time frames of the PET reconstruction after the 18F-FDG bolus, probably because of tracer dispersion in the pulmonary circulation.
The arterial input function measured with the microvolumetric blood counter was used as a reference for the 18F-FDG input function measurement. With the arteriovenous shunt, a higher blood flow through the counter could be used (on the order of 20 μL/s), as compared with an open circuit. For such a high flow, the dispersion of the tracer in the PE-50 catheter from the femoral artery to the counter is expected to have a low to negligible effect on the measured arterial input function, as compared with manual blood sampling, with an estimated dispersion constant of about 3 s, assuming a monoexponential dispersion function (15). The excellent agreement between the manual blood sampling and the arterial input function (Fig. 3) measured with the blood counter supports this argument. The dispersion in the measurement line was therefore neglected.
The determination of the metabolic rate of glucose from 18F-FDG tissue uptake can be undertaken using 3 main methods.
First, MRGlc can be estimated using a simplified single-scan approach (35,36), at a sufficiently long time after the bolus 18F-FDG injection so that the contribution of free 18F-FDG activity in tissue becomes negligible (Equation 30 in Sokoloff et al. (35)). In this case, only the integral of the 18F-FDG input function enters into the calculation of MRGlc. The errors in MRGlc are expected to be proportional to the error in the AUC of the input function. As a consequence, the MRGlc can be determined directly using the plasma 18F-FDG activity obtained from the raw IDIF without correction for dispersion, because the AUC ratio between the raw IDIF and the AIF reference was 0.93 ± 0.15, similar to what was found in method 2 of the dispersion-correction method.
A second approach to measure the MRGlc is the Patlak method (22,23). This method is based on the fact that for an irreversibly trapped tracer, the plot of the following expressions becomes linear after a given time t* (typically 3–10 min): Eq. 3where
  is the tissue tracer concentration and
  the plasma tracer concentration. Both the instantaneous value of the plasma tracer concentration at time t and its integral from the injection time (t = 0) to t (with
  ) appear in the calculation of the MRGlc. For times greater than 1 min after the injection, both the AUC and the activity value of the raw IDIF from the vena cava matched the reference arterial input function (Fig. 3). The plasma 18F-FDG activity obtained from the raw IDIF measured in the vena cava can therefore be directly used to determine the MRGlc from the Patlak plot without introducing significant bias, as shown in the last row of Table 2. Applying this method, we estimated an MRGlc in the mouse cerebral cortex of 0.22 ± 0.10 μmol/g/min (Fig. 5), in good agreement with previous 18F-FDG studies in the mouse brain (25).
The third MRGlc calculation method requiring the fewest assumptions is the use of the compartmental model of 18F-FDG metabolism to fit the kinetics of 18F-FDG tissue uptake (37). In this case, the MRGlc is derived from the different rate constants describing 18F-FDG transport and phosphorylation in the tissue. With this modeling approach, the shape of the input function could have a significant impact on the derived metabolic fluxes. However, we showed that when the experimentally determined scaling parameter a (method 1) or a manual blood sample as scaling reference (method 3) are used, the dispersion-corrected IDIF from the vena cava closely matches both the AUC and the shape of the reference AIF (Fig. 4; Table 2). The scale factor found in method 3 using blood sampling was also close to the experimentally determined scaling parameter a (method 1) (1.09 ± 0.12 vs. 1.10 ± 0.17). The presented CMRGlc recovery analysis based on typical 18F-FDG metabolic rates showed a good estimation of CMRGlc using compartmental modeling with all the dispersion-corrected IDIF (Table 2). An improvement in the precision and robustness of the CMRGlc determination was obtained by scaling the dispersion-corrected IDIF using the first manual blood sample (Table 2, method 3). Interestingly, when the raw IDIF from the vena cava was used, a similar performance in CMRGlc estimation was reached, indicating the relative insensitivity of the method to the exact shape of the bolus during the first 2 min of the 18F-FDG PET acquisition, as far as the AUC is preserved. However, in the case of the raw IDIF extraction, scaling the IF using the first blood sample (method 5) actually degraded the evaluation of CMRGlc, probably because of the nonnegligible dispersion effects taking place between venous and arterial blood in the early period after the bolus injection (1.5 min). This effect is also supported by the fact that in method 5, the average scale factor found using blood sampling (1.24 ± 0.11) was less close to the average scaling parameter a found for method 1 (1.10 ± 0.17) than when using method 3 (with dispersion correction), because of the wrong shape of the input function during the bolus period when dispersion correction was neglected.
Therefore, the dispersion-corrected IDIF and the raw IDIF can be used for all the 3 approaches discussed above, without introducing a significant bias in the estimation of the 18F-FDG metabolic rate constants. In all 3 methods, the plasma 18F-FDG activity can be obtained from the whole-blood activity curve using a dynamic correction factor (3).
The tracer bolus dispersion in blood between the vena cava and the femoral vein was modeled using a biexponential dispersion function, as previously used in 15O PET blood flow measurements (29). When a monoexponential function (a and b = 1 in Eq. 3) was used, the dispersion-corrected IDIF overestimated the blood activity concentration immediately after the bolus and underestimated the activity at time points later than 400 s in all rats (data not shown). This observation suggests a more complex dispersion mechanism than the single mixing chamber model (26), which cannot therefore be summarized by a monoexponential function. We noted that the 2 estimated dispersion time constants differed by 1 order of magnitude—that is, 20 and 180 s—whereas their respective exponential term had similar weight (b ∼0.6). These 2 constants represent 2 different dispersion processes between the vena cava and the femoral arteries, likely representing blood mixing in the pulmonary circulation and in interstitial tissue. Because the heart is a major site of 18F-FDG uptake (38), the bidirectional exchange between blood 18F-FDG and unmetabolized 18F-FDG in the myocardial tissue through the coronary circulation could also affect the measured blood dispersion function.
From the 3 methods treated to generate a dispersion-corrected input function from the time–activity curve measured in the vena cava (Table 2), method 1 and method 3 were the more accurate methods, with an average difference of less than 2% in the AUC, compared with the external blood sampling.
In method 1, the scaling parameter a (Eq. 1) was set to the average value (1.1) found for the 4 rats. Because a corresponds to the integral of the dispersion function, a being 10% larger than 1 implies a slight underestimation of the input function, measured in the vena cava VOI. This underestimation is most likely related to spill-out of blood activity beyond the VOI boundary, due to the positron diffusion in tissue before annihilation and the limited spatial resolution of the scanner. However, CMRGlc and CMRGlc_Patlak determined in the rat with the raw IDIF (method 4) or with the dispersion-corrected IDIF without scaling (method 2, a = 1) showed a good agreement with the reference value. Therefore, the underestimation of the vena cava activity curve due to limited spatial resolution or spill-out effects does not seem to be critical in CMRGlc estimation using 18F-FDG PET in rats.
The approach using the raw IDIF (method 4) was the one selected to determine CMRGlc_Patlak in mice with minimal invasiveness, using the Patlak method. Although good agreement with previously reported values in mice was obtained (25), the smaller diameter of the vena cava in mice could affect the determined IDIF through increased limited spatial resolution or spill-out effects. Further validations based on dynamic blood sampling in mice could solve this question. Nonetheless, an increased spill-out or spatial resolution limits would typically lead to an underestimation of blood activity from the vena cava and thus of the IDIF, because no major 18F-FDG–metabolizing organ is located close to the vena cava. For a given tissue activity curve, an underestimation of the blood activity curve due to spill-out would then lead to an overestimation of CMRGlc_Patlak. However, the values found for CMRGlc_Patlak in mice in the present study are slightly lower than previously published values (0.22 ± 0.10 vs. 0.34 ± 0.09 μmol/g/min (25)), suggesting that the raw IDIF is not subject to substantial underestimation and supports the validity of the IDIF method for mice.
In the case of younger mice or smaller species, the vena cava could reach a critical diameter for which spillover effects have a major impact on the determined IDIF. On the basis of the diffusion properties of positron in tissue (34), we calculated that the correction factor for positron spill-out for a 1-mm square VOI is typically 1.15 for a vena cava diameter of 2.5 mm, close to the parameter a found in rats (Table 1), indicating that positron diffusion is the dominant contribution to the scaling parameter a. For a diameter of 2 mm, the correction factor is 1.31 and increases then critically for diameters smaller than 1.7 mm (Supplemental Fig. 1; supplemental materials are available at http://jnm.snmjournals.org). Therefore, in the case of 18F-FDG PET studies on smaller mouse species with smaller vena cava diameters, further analysis of the impact of spill-out on the IDIF should be undertaken. Moreover, for particularly young and small mice, a spill-in contamination from neighboring 18F-FDG–fixing organs such as the bladder is possible and could hinder the proper extraction of the IDIF from the vena cava.
In method 3, a blood sample manually withdrawn 1.5 min after the 18F-FDG injection was used to scale the dispersion-corrected input function. In this case, the difference in the AUC among the animal group was less than 0.5% on average. Moreover, the SD on the AUC ratio was also reduced to 6%. As comparison, the SD on the AUC ratio was 16% in method 1, when no blood sampling was performed. Moreover, the SD in the determination of CMRGlc and CMRGlc_Patlak was also substantially reduced to 7% using this approach. We decided to scale the dispersion-corrected input function using the first blood sample, which gave the best results in terms of accuracy of the AUC. When later blood samples were used, the AUC of the IDIF was underestimated by about 15%, essentially due to the decrease of the signal-to-noise ratio in the measurement of late blood samples. It was hence preferable to scale the input function in the first part of the blood time–activity curve, for which the blood activity is higher than the noise of the blood sample measurement.
The presented IDIF approach does not require a specific assumption concerning the shape of the initial bolus. In this study, the 18F-FDG was injected manually and followed by a chase. Depending on the specific activity of the 18F-FDG solution at the time point of the injection, the volume of the bolus of 18F-FDG could slightly vary, and the effect of the chase on the input function was more or less pronounced. The only fundamental condition for the 18F-FDG infusion is to perform a sufficiently fast injection bolus to enable the visualization of the vena cava on the PET image by observation of the bolus at first passage. If available, a combined CT/x-ray image could be used for the positioning of the VOI in the vena cava.
Although the shape of the bolus in the first 2 min of the IDIF was substantially different from the reference AIF measured with the external blood counter because of dispersion effects, the measurement of CMRGlc and CMRGlc_Patlak showed remarkable robustness toward these dispersion distortions. The values obtained for CMRGlc and CMRGlc_Patlak using the raw IDIF (Table 2, method 4) were on the same order of accuracy and precision as the values obtained with dispersion correction (methods 1 and 2). An improvement in the variability of CMRGlc and CMRGlc_Patlak across animals was, however, noticed when scaling the dispersion-corrected IDIF with the first blood sample (method 3). In addition, neglecting a possible underestimation of the IDIF due to spill-out and spatial resolution limitations by fixing the correction factor a to 1 (method 2) also showed marginal differences on the estimated CMRGlc and CMRGlc_Patlak values. Therefore, the presented IDIF extraction method seems to be particularly robust in the estimation of glucose uptake. To minimize the invasiveness of the 18F-FDG PET experiment undertaken on rodents by avoiding any blood sampling, the simple use of the raw IDIF without additional scaling (method 4) is an advisable approach, leading to appropriate CMRGlc and CMRGlc_Patlak estimation. Moreover, this approach does not require the additional assessment of the dispersion coefficients and simplifies in that way the experimental protocol. In this case, the calculation of the MRGlc by the Patlak modeling approach seems advisable, because of its lower sensitivity to the shape of the input function.
The method presented in this study to determine an IDIF was evaluated for the particular case of 18F-FDG. However, the proposed approach is expected to be applicable to other tracers, with or without bolus dispersion correction, after a possible reevaluation of the dispersion coefficients for the new tracer, provided the positron range of the other PET radioisotopes (34) will not introduce substantial loss from the vena cava VOI through spill-out and the tracer is not strongly distributed in organs around the vena cava, leading to spill-in contaminations. The uptake of the injected tracer by the heart might affect the apparent dispersion between the vena cava and the arterial tree. For the same reason, the dispersion parameters might need to be reevaluated for an 18F-FDG study planned on a group of rats with major cardiovascular modifications—due to age, disease, or specific treatments—and on different species. Nevertheless, the reevaluation of new dispersion coefficients should be achievable on a small-animal group of about 3–5 subjects, as supported by the present study.
CONCLUSION
The time–activity curve extracted from the vena cava in 18F-FDG PET studies in rats can be used as an easy accessible input function for kinetic modeling of the MRGlc, even without correction for bolus dispersion between the vena cava and the arterial tree. The presented approach enables technically simplified and robust MRGlc measurements in rodents, provided that the vena cava can be placed in the axial field of view of the PET scanner during the dynamic acquisition. Although further validations should be undertaken in mice with reference AIF based on blood sampling, the presented method enabled the measurement of CMRGlc values comparable to previously published results in mice. The presented dispersion-correction method leads to a reliable estimation of the 18F-FDG input function over the entire PET acquisition time, with minimal invasiveness.
DISCLOSURE
The costs of publication of this article were defrayed in part by the payment of page charges. Therefore, and solely to indicate this fact, this article is hereby marked “advertisement” in accordance with 18 USC section 1734. This work was supported by Swiss National Science Foundation (grant 131087) and by Centre d’Imagerie BioMédicale (CIBM) of the UNIL, UNIGE, HUG, CHUV, EPFL, and the Leenaards and Jeantet Foundations. No other potential conflict of interest relevant to this article was reported.
Acknowledgments
We thank Dr. Nicolas Aznavour for the provision of the Wallac 1470 WIZARD Gamma Counter and for his help regarding the related measurements.
Footnotes
Published online Jun. 9, 2014.
- © 2014 by the Society of Nuclear Medicine and Molecular Imaging, Inc.
REFERENCES
- Received for publication June 9, 2013.
- Accepted for publication April 2, 2014.


Jump to section
Related Articles
Cited By...
- Deletion of Crtc1 leads to hippocampal neuroenergetic impairments associated with depressive-like behavior
- Synchronous nonmonotonic changes in functional connectivity and white matter integrity in a rat model of sporadic Alzheimers disease
- 2-18F-Fluoroethanol Is a PET Reporter of Solid Tumor Perfusion
- Performing Repeated Quantitative Small-Animal PET with an Arterial Input Function Is Routinely Feasible in Rats
- Impact of Image-Derived Input Function and Fit Time Intervals on Patlak Quantification of Myocardial Glucose Uptake in Mice