


Abstract
Performing quantitative small-animal PET with an arterial input function has been considered technically challenging. Here, we introduce a catheterization procedure that keeps a rat physiologically stable for 1.5 mo. We demonstrated the feasibility of quantitative small-animal 18F-FDG PET in rats by performing it repeatedly to monitor the time course of variations in the cerebral metabolic rate of glucose (CMRglc). Methods: Aseptic surgery was performed on 2 rats. Each rat underwent catheterization of the right femoral artery and left femoral vein. The catheters were sealed with microinjection ports and then implanted subcutaneously. Over the next 3 wk, each rat underwent 18F-FDG quantitative small-animal PET 6 times. The CMRglc of each brain region was calculated using a 3-compartment model and an operational equation that included a k*4. Results: On 6 mornings, we completed 12 18F-FDG quantitative small-animal PET studies on 2 rats. The rats grew steadily before and after the 6 quantitative small-animal PET studies. The CMRglc of the conscious brain (e.g., right parietal region, 99.6 ± 10.2 μmol/100 g/min; n = 6) was comparable to that for 14C-deoxyglucose autoradiographic methods. Conclusion: Maintaining good blood patency in catheterized rats is not difficult. Longitudinal quantitative small-animal PET imaging with an arterial input function can be performed routinely.
- repeated quantitative animal PET
- arterial input function
- prolonged catheterization
- cerebral metabolic rates of glucose
Several small-animal models have been developed that simulate many of the important hallmarks of human brain diseases. Although the first report of quantitative small-animal PET to monitor the CMRglc changes in a rat model of brain injury appeared in 2000 (1), there has been rare use of quantitative small-animal PET with experimental models over the intervening years. Cannulation of a rat is not difficult. The challenges associated with repeated surgeries to obtain arterial blood samples have most likely impeded routine use of the method. Although image-derived input function appears to be an attractive alternative to arterial sampling, image-derived input function is reliable only in selected situations and selected tracers (2). In the case of 18F-FDG quantitative small-animal PET, one of the major concerns was the different 18F-FDG concentrations in plasma and in whole blood (WB) due to a slow erythrocyte 18F-FDG transport rate in rodent blood (3,4). Therefore, arterial plasma samples remain the gold standard for input function and CMRglc quantification in rats (5).
To ease blood sampling and reduce blood loss in small animals, we developed an automated microfluidic device that allows us to take discrete, serial blood samples (<1 μL per sample) with little human effort (6). However, blood coagulation took place frequently in the catheter when the interval between 2 serial blood samples was long (e.g., >10 min). In this work, we developed a surgical procedure that eases radiotracer injection and arterial blood sampling. We conducted a proof-of-principle study to demonstrate the feasibility of performing multiple-time-point quantitative small-animal PET using the new methods we developed. Our ultimate goal was to use 18F-FDG quantitative small-animal PET as a measuring tool to monitor the time course of CMRglc changes in rats. We planned this study in such a way that the impact of isoflurane anesthesia on CMRglc was also evaluated.
MATERIALS AND METHODS
Surgical Preparation of Prolonged Indwelling Catheter
All animal experiments were conducted in compliance with the animal care and use program established by the Animal Research Committee at Fu-Jen Laboratory Animal Center. Two Sprague–Dawley rats (∼250 g) were ordered from BioLASCO Taiwan and kept in a sterilized environment at our institute’s vivarium until the day of surgery.
Each rat underwent one aseptic surgery with catheterization of the right femoral artery and left femoral vein (7). We used a 4-cm 2-French polyurethane tube (Instech Laboratories, Inc.) glued to a 3-cm 0.037″ × 0.023″ Micro-Renathane tube (Braintree Scientific, Inc.) for arterial catheterization and a 6-cm 2-French polyurethane tube for venous catheterization. For the best result, the total length (i.e., 4 cm) of the 2-French polyurethane tube should be inserted into the femoral artery toward the aorta and secured with sutures (silk, 4-0). Both catheters were filled with 0.1 mL of heparinized glycerol (500 IU/mL glycerol) and then plugged and sealed with a polyethylene microinjection port (Instech Laboratories, Inc.). The catheters and the injection ports were then placed under the skin, and the incisions were closed with metal wound clips (EZ clip kit; Stoelting Co.). The patency of both subcutaneous cannulas was maintained by replacing the heparinized glycerol weekly.
Proof-of-Principle Study
We scheduled 6 mornings (9 am–12 pm)—on the eighth, ninth, 15th, 16th, 22nd, and 23rd day within a month—in a preclinical PET facility. Two quantitative small-animal PET studies were scheduled for each morning, with one rat undergoing a conscious study and the other an unconscious study. The PET facility was remote (∼48 km) from our institute’s vivarium, where the rats were housed and underwent surgery. The facility had a PET/CT small-animal scanner (eXplore Vista DR; GE Healthcare) that was used by the entire hospital community. If a study failed, we were not allowed to request a delay or reschedule until the following month. The rats underwent the surgical procedures a week before the first quantitative small-animal PET study (i.e., on the first day of the month). On the next 2 consecutive days after the study (e.g., on the eighth and ninth days of the month), one rat had a conscious study on the first morning and an unconscious study on the second morning, and vice versa for the other rat, resulting in a total of 6 studies per rat.
Quantitative Small-Animal 18F-FDG PET Procedure
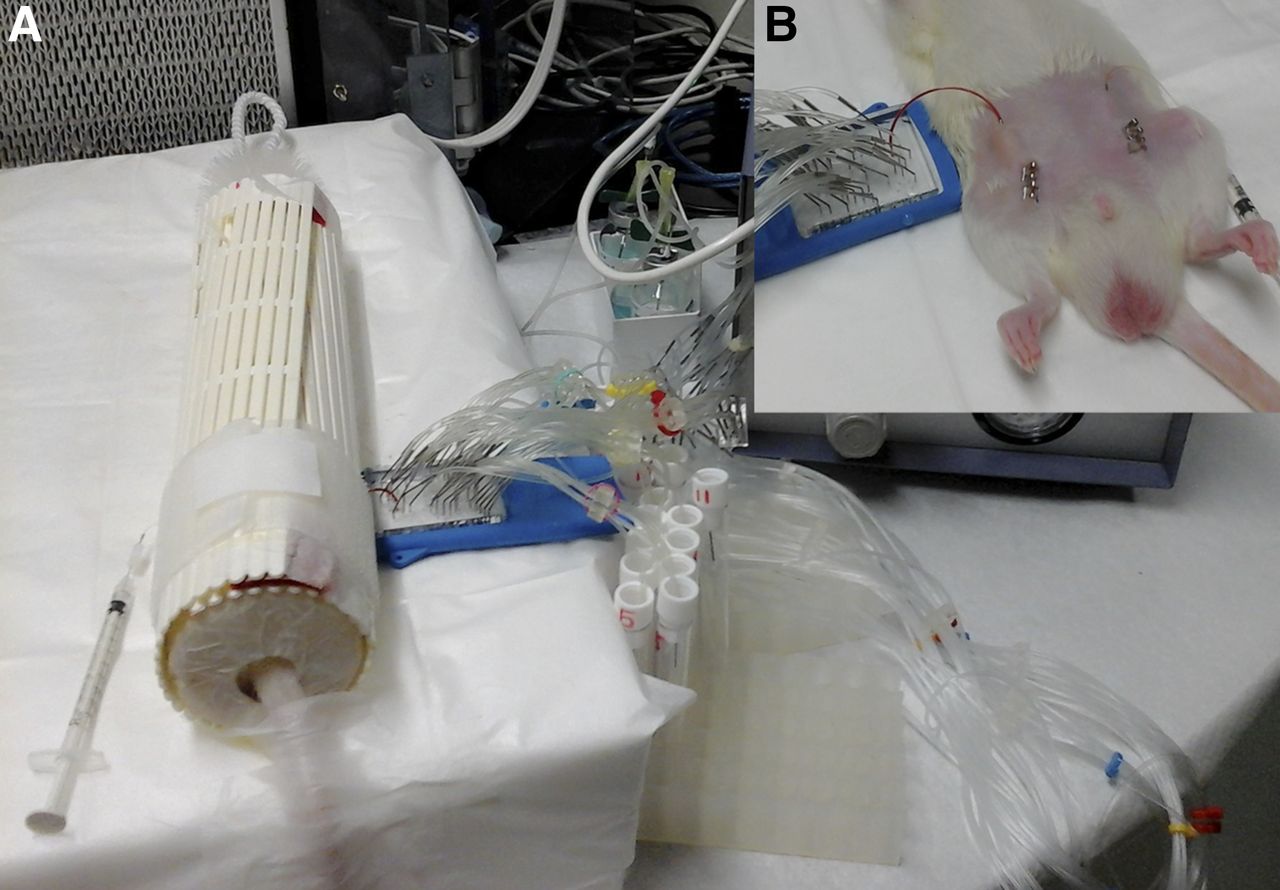
Acquiring PET images of a conscious rat was difficult. We therefore performed quantitative small-animal PET using a procedure adopted from 14C-deoxyglucose methodology (8,9). The procedure involved a 40-min blood sampling followed by a brain scan. Blood-sampling procedures were the same for the unconscious and conscious studies, except that the animal was anesthetized with 2% isoflurane for the former and was kept in a restrainer for the latter. To prepare a rat for intravenous injection and arterial blood sampling, 2 external adaptors were established in advance (Fig. 1). The arterial adaptor (total inner volume < 15 μL) was made with a 5-cm 0.037″ × 0.023″ tube, one end connected to a 22-gauge 1-cm metal tube (Instech Laboratories, Inc.) and the other end connected to an injection port. The venous adaptor (total inner volume < 10 μL) was made with a 5-cm 2-French polyurethane tube, one end with a 25-gauge metal tube and the other end with an injection port. The adaptors were soaked with 75% alcohol solution, dried, rinsed, and filled with heparinized saline (25 IU/mL).

Photographs showing how we prepared prolonged indwelling catheter: (Left) Groin incision was first made to cannulate femoral artery. End of arterial catheter was plugged with microinjection port. (Center) Catheter and injection port were placed under skin, and incision was closed with metal wound clip (1). (Right) Similar steps were taken to cannulate femoral vein in contralateral site (2). When quantitative small-animal PET was performed, blood circulation of animal was accessed using 2 metal tubes (yellow arrowheads) that were poked halfway through skin and inserted into subcutaneous injection ports. Also shown are 2 external adaptors (blue arrowheads) extended from metal tubes.
Although the conscious study was always scheduled to be the second quantitative small-animal PET study of the day, we prepared the rat (∼10 min) for the conscious study first so that this rat would have enough time (>45 min) to recover from the impact of isoflurane anesthesia. This rat was anesthetized under 2% isoflurane, and a 23-gauge sharp needle was used to poke 2 holes through the abdominal skin above the cannulas. The metal-tube end of each external adaptor was then guided through the skin hole and inserted into a subcutaneous injection port. The arterial adaptor was then connected to the transducer of a blood pressure monitor to confirm the blood patency. The monitor was then removed and the rat was wrapped loosely in plastic mesh. A plastic brush with stiff filaments was inserted into the front end of the mesh (i.e., the restrainer) without touching the nose of the animal. The tail of the rat was secured on the table with tape. Normally, the rat woke up a few minutes after removal of the anesthetic, struggled in the restrainer for a few seconds, and then remained calm.
Preparation for the first quantitative small-animal PET study of the day, the unconscious study, was the same except that the unrestrained animal remained under 2% isoflurane anesthesia when we started the blood sampling. A drop of arterial blood was collected first for a glucose measurement (mg/dL) using a FreeStyle meter (Abbott Diabetes Care Inc.). The arterial external adaptor was then connected to a microfluidic blood sampler (6). Seventy-four megabecquerels of 18F-FDG (<0.1 mL) were injected manually in 2 s through the venous adaptor, followed by a saline push (∼0.1 mL). The 18F-FDG dose was higher than the normal dose (∼37 MBq) because of the low sensitivity (∼35%) of the γ-counter (Wallac Wizard 1470; Pekin Elmer Inc.) and the small volume of the blood samples. Fifteen blood samples (0.6 μL/sample) were collected automatically at 3, 9, 16, 23, 30, 60, 90, 150, 300, 600, 900, 1,200, 1,500, 1,800, and 2,100 s after 18F-FDG injection. After the last blood sample had been collected, the arterial adaptor was disconnected from the blood sampler and the animal was immediately transferred to the PET/CT scanner. A 20-min list-mode brain PET scan was acquired under 2% isoflurane anesthesia followed by a 10-min CT scan. The blood-sampling procedure for the conscious rat began immediately after the first rat had been placed on the PET/CT scanner. The rats were returned to their cages after the PET/CT scans.
Derivation of Input Function
In an independent rat study, we programmed the microfluidic blood sampler to draw 8 large (∼80 μL/sample in 4 s) blood samples in addition to the small (0.6-μL) blood samples. The large blood samples were taken at 20, 60, 120, 300, 600, 900, 2,100, and 3,600 s after 18F-FDG injection. The large blood samples were centrifuged, and the 8 plasma-radioactivity–to–WB-radioactivity ratios (RFDG(t)) were calculated. The input function (C*p(t)) was then derived as follows: Eq. 1C*WB(t) were the 15 WB concentrations (MBq/mL) obtained during quantitative small-animal PET. The converted plasma curves were extrapolated to 40 min by fitting the data of the last 3 time points.
Ideally, the blood-sampling procedure with RFDG(t) derivation should be performed at each quantitative small-animal PET study. Unfortunately, the PET facility was not equipped with a centrifuge. Therefore, during the 3-wk study period, we performed only one quantitative small-animal PET study, which had 8 additional large blood samples. From these 8 ratios, we constructed a general function of RFDG(t) and applied this function to all 12 studies.
Definition of Brain Regions
PET images were reconstructed using filtered backprojection and ordered-subset expectation maximization. We manually aligned all 6 sets of CT images of each rat into one orientation (AMIDE, version 1.0.5). The parameters of the rigid coregistrations were then applied to the corresponding PET images so that all PET images of the same rat were aligned. The regions of interest were defined on the coregistered CT and ordered-subset-expectation-maximization PET images. Two symmetric regions of interest (1.7 × 4 × 4 mm) were manually drawn on the left and right parietal cortices.
Calculation of Regional CMRglc
CMRglc (μmol/100 g/min) was calculated using an operational equation (Eq. 2) that included a k*4 (9) to account for the limited PET resolution and tissue heterogeneity. Eq. 2
Eq. 2
 The operational symbol ⊗ denoted convolution. The rate constants (K*1 = 0.420 mL/min/g, k*2 = 0.552 min−1, k*3 = 0.046 min−1, and k*4 = 0.017 min−1, respectively) were obtained from the quantitative small-animal PET images of 8 Sprague–Dawley rats with manually drawn arterial blood samples (unpublished data). C*p(t) was the input function, and Cp was the blood glucose concentration (μmol/100 mL). A lumped constant (LC), 0.71, was used (10). C*tissue(t) was the tissue concentration in filtered backprojection reconstructed brain PET images acquired at 40–45 min after 18F-FDG injection. The image counts (counts/voxel/s) were converted to the radioactivity concentrations (MBq/mL) using a calibration factor obtained from a phantom study. Partial-volume effects of cortical regions were corrected using a recovery coefficient, 0.75, based on a small-animal PET study with different sizes of pipette tips (11). Attenuation was corrected with a 15% increase based on the 18F-FDG rat brain data reported by Yu et al. (12).
RESULTS
Stability of Rat with Prolonged Catheter
The photographs in Figure 1 show how we prepared a prolonged indwelling catheter. Once the subcutaneous cannulas were in place, the blood samples could be withdrawn and the radiotracer injected easily through the external arterial and venous adaptors.
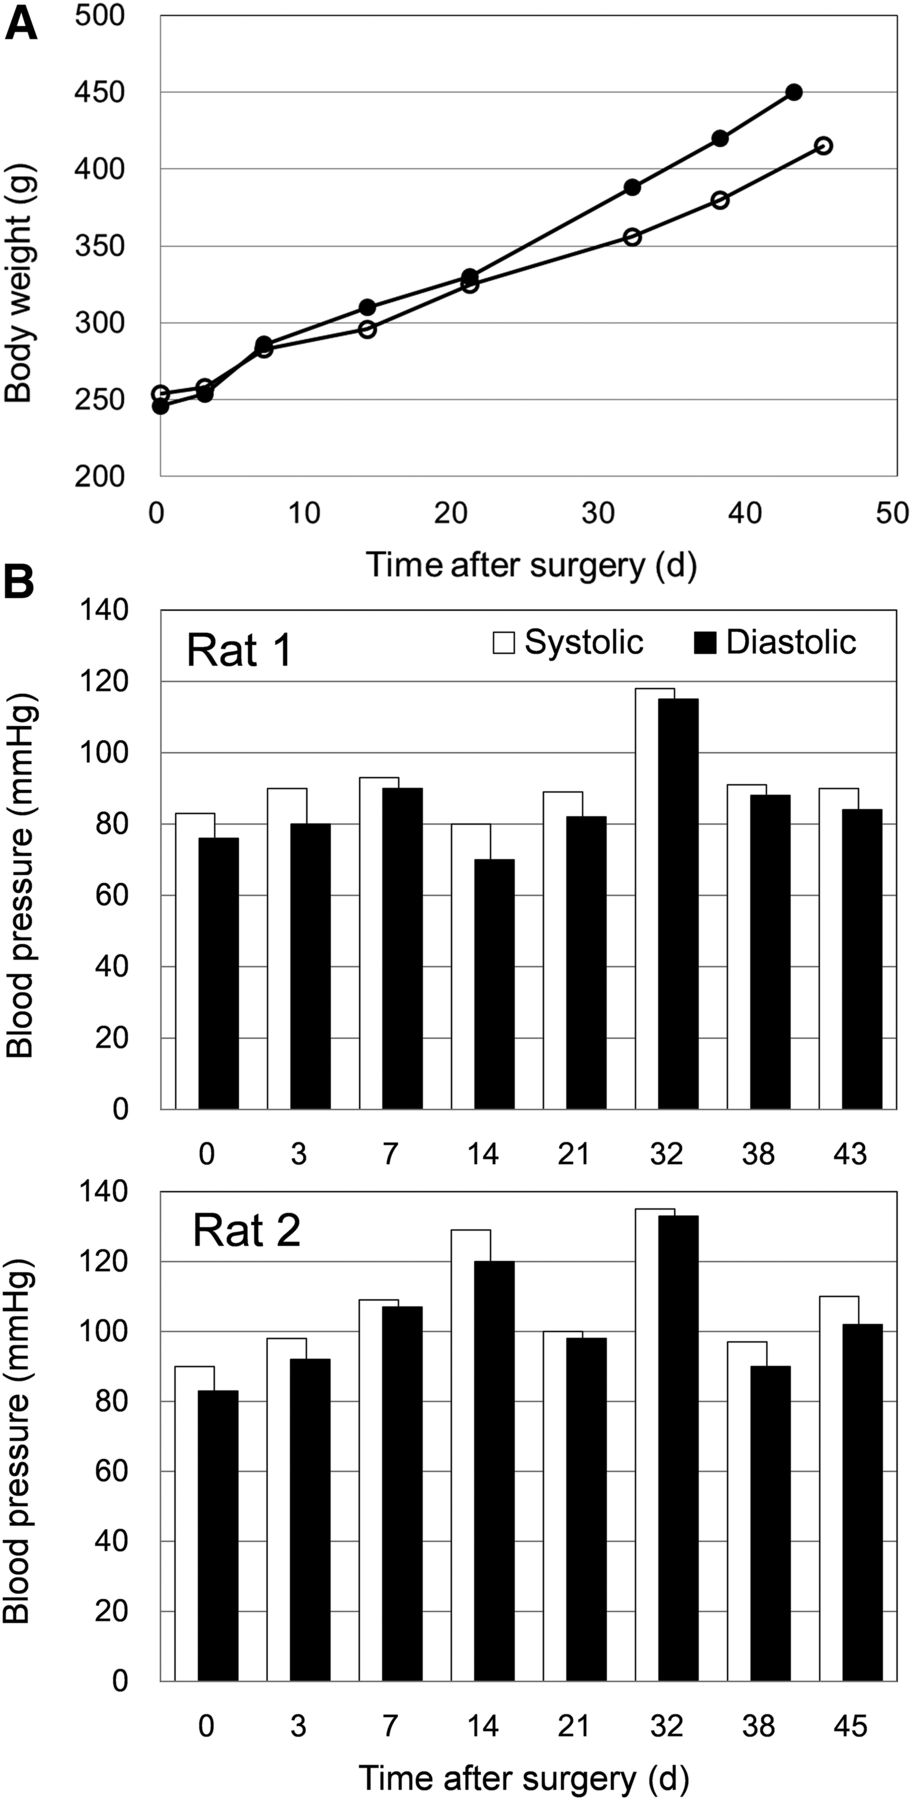
The behavior and appearance of the rats were inspected daily. They behaved normally throughout the study period. Figure 2 shows their recorded body weights and blood pressures. Both rats grew steadily before and after the 6 quantitative small-animal PET studies. Because the transducer of the blood pressure monitor was connected to the external arterial adaptor, the serial tube connections between the cannula and the monitor caused the pressure readings to fluctuate and be lower than those measured directly at the cannulas. Nevertheless, the diastolic and systolic signals confirmed that blood patency was maintained in both rats until the day they were euthanized (i.e., 1 mo after the last quantitative small-animal PET study).

(A) Body weights and (B) blood pressures of 2 catheterized rats recorded from day of surgery (day 0) to day of euthanasia. Each rat underwent 6 quantitative small-animal PET studies between days 7 and 21.
Feasibility of Performing Repeated Quantitative Small-Animal PET
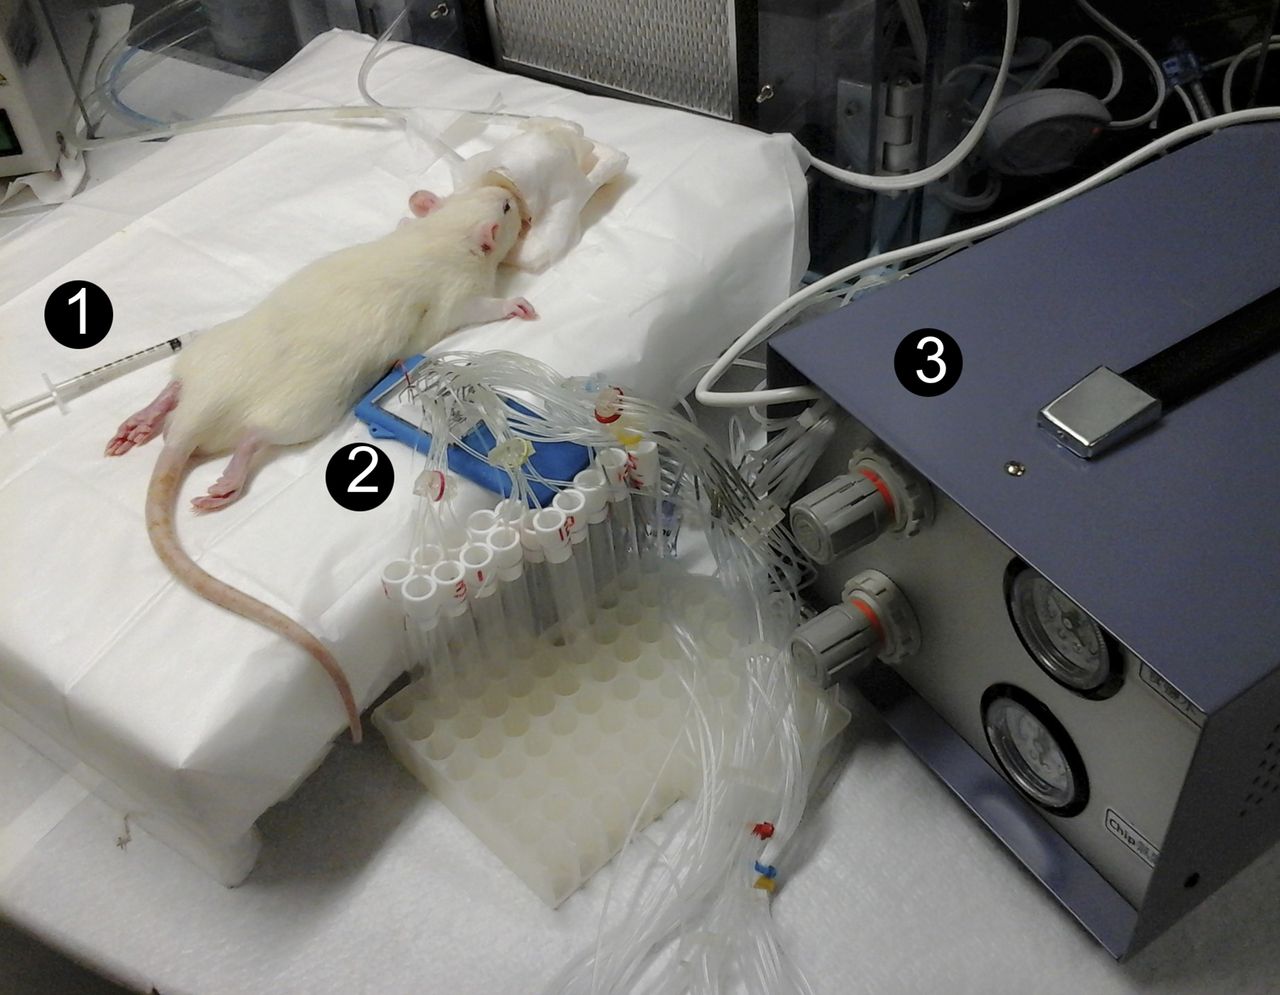
Without delay, we completed 12 18F-FDG quantitative small-animal PET studies within 6 mornings. At every occasion, the rat recovered from the anesthetic and was walking on all 4 feet within 10 min after the scan. The photographs shown in Figures 3 and 4 are of an unconscious and conscious quantitative small-animal PET study, respectively. Except for the PET/CT imaging, all the procedures were handled by the 2 persons from our team. We confirmed a 100% success rate of the 18F-FDG injection by examining the peak heights and areas under the 12 WB curves (SD of areas under the curve, 17%; n = 12).

Photograph taken during quantitative small-animal PET study of unconscious rat. Shown are location of venous external adaptor where 18F-FDG bolus was injected (1) and location of microfluidic blood-sampling device (2), which was operated by programmable controller (3).
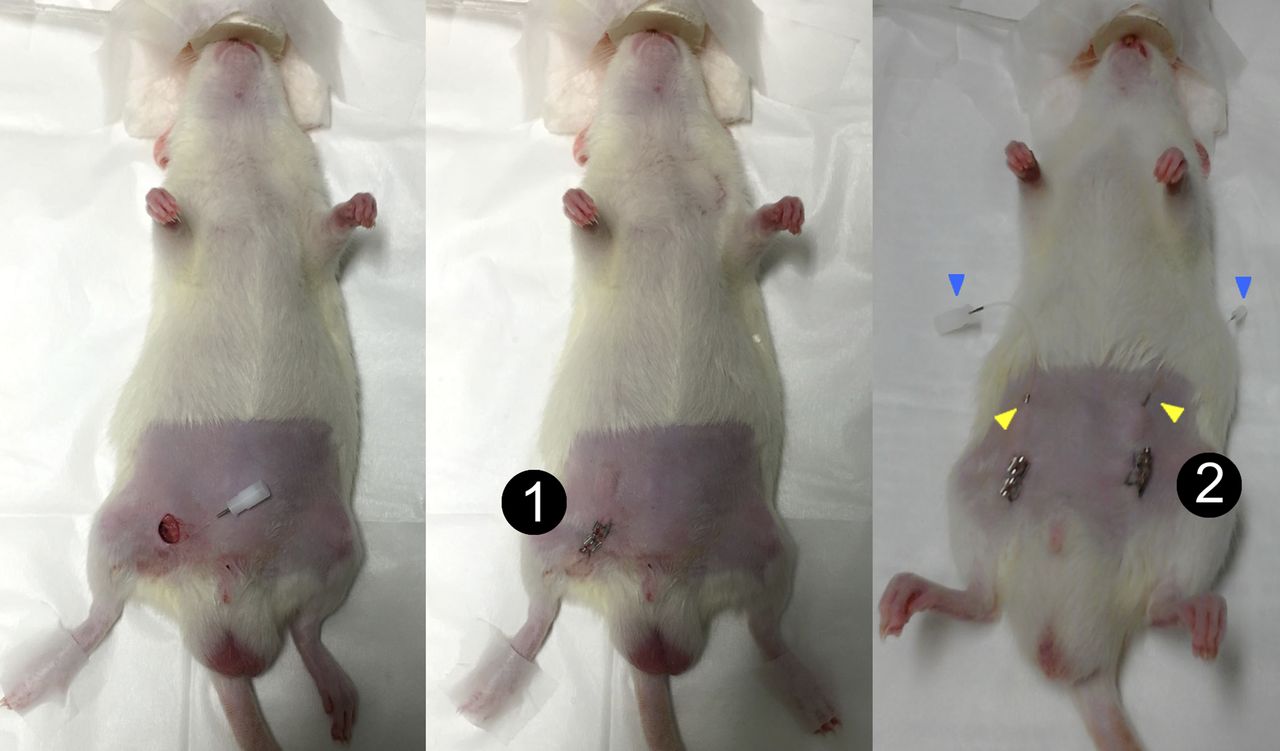
(A) Photograph taken during quantitative small-animal PET study of conscious rat. Before 18F-FDG injection, animal was wrapped loosely in plastic mesh and kept in quiet environment for more than 45 min. (B) To show how subcutaneous cannulas were connected to blood sampler and to injector, animal was flipped supine before being put into restrainer.
Need for a Plasma Input Function
Figure 5A shows the counting rates of the large (i.e., 25 μL pipetted from the 80-μL WB sample collected by the blood sampler) and small (0.6 μL) blood samples obtained from the plasma-to-WB ratio study. The AUC ratios (small vs. large samples) were 1.12 and 1.02 for the first 2 min and first 45 min, respectively, of the 2 blood curves. Figure 5B shows the 8 plasma-to-WB radioactivity ratios obtained from the same study. The ratios decreased rapidly after the bolus injection. The 8 ratios were best fitted by an exponential function of RFDG(t) = 0.619e−0.0842t+1.051 (Eq. 3). Figure 5C shows a WB curve from a quantitative small-animal PET study and the corresponding plasma curve converted using Equations 1 and 3. The CMRglc would be overestimated by about 30% if the WB curve were used as the input function (i.e., C*p(t)) in Equation 2. The large discrepancy between the WB and plasma curves warranted the use of a plasma input function in calculating CMRglc.
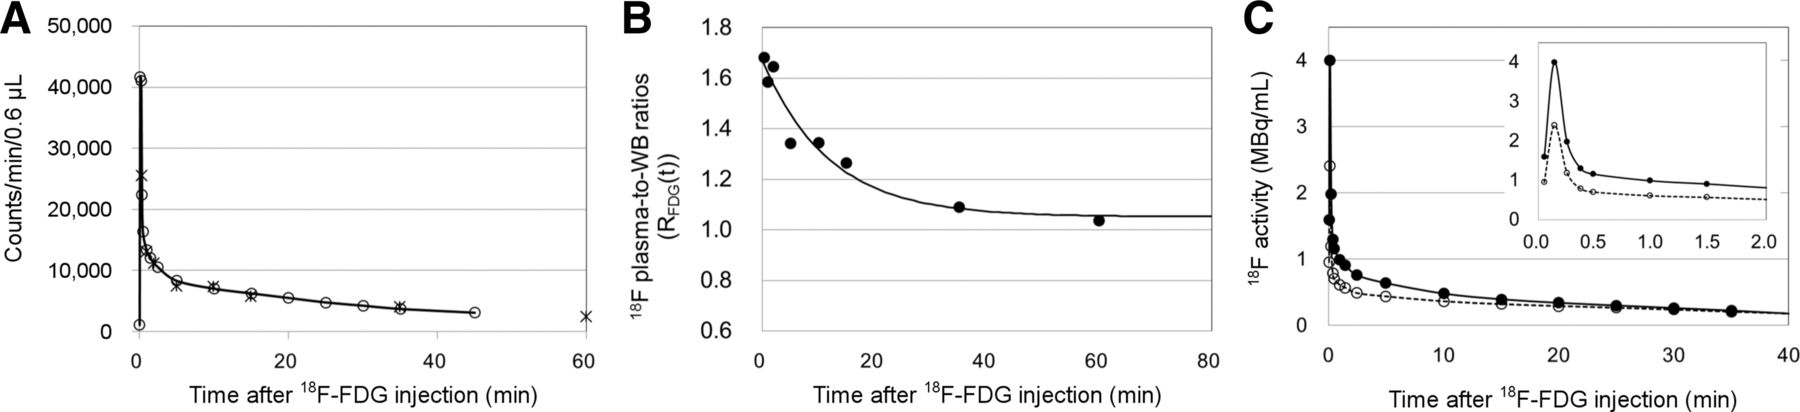
(A) Raw counting rates of WB samples (small samples [○]; large samples normalized to 0.6 μL [×]) obtained from plasma-to-WB ratio study. (B) Eight plasma-to-WB ratios (●) obtained from study. Solid line (RFDG(t) = 0.619e−0.0842t + 1.051 [Eq. 3]) was best exponential fit of 8 ratios. (C) Typical example of plasma input function (●) that was converted from 15 WB samples (○) of quantitative small-animal PET using Eqs. 1 and 3. Inset shows same data from first 2 min.
Brain Uptake of 18F-FDG
Figure 6 shows the typical brain images obtained from the 2 studies performed on consecutive mornings. During blood sampling, the animal was kept awake on the first morning and was anesthetized on the second. Under both conditions, the cortical 18F-FDG uptake was homogeneous and symmetric. Uptake in the harderian gland was similar regardless of whether the rat was conscious or unconscious. Uptake in the cortical brain, on the other hand, was significantly lower when the animal was anesthetized. Similar patterns were observed in the rest of the quantitative small-animal PET studies.
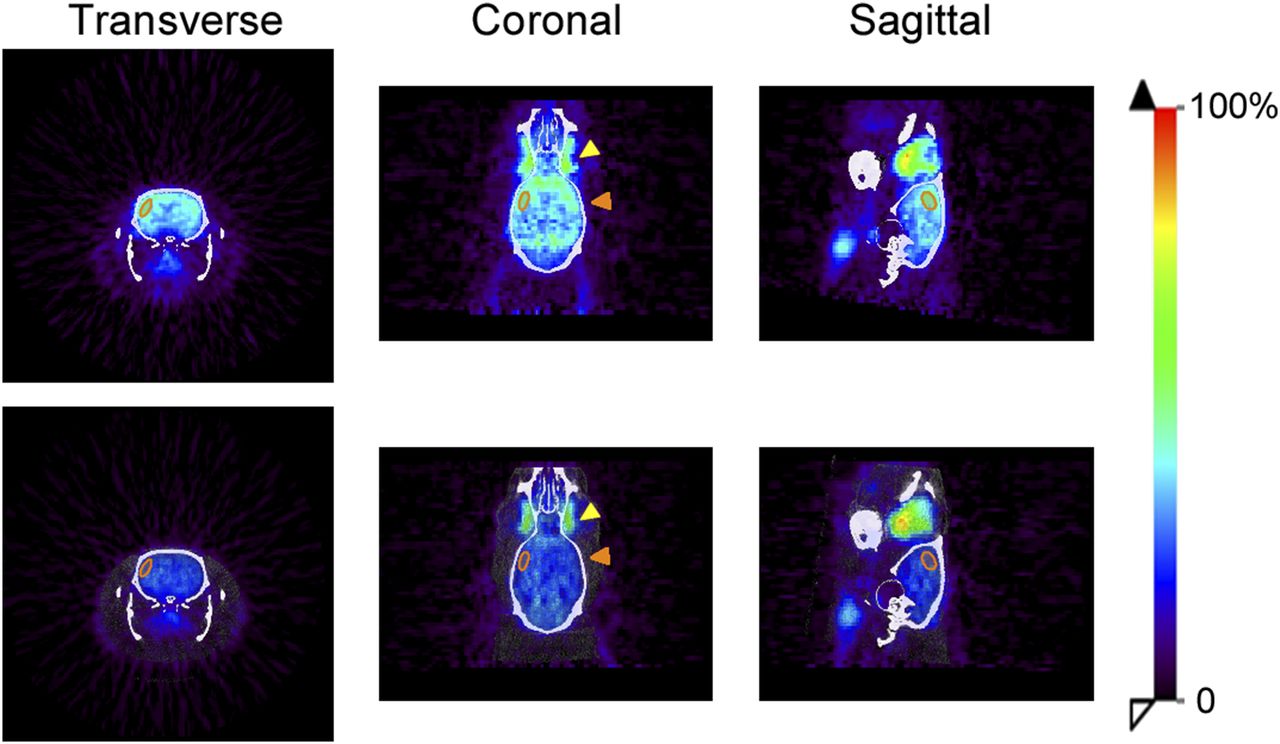
Typical head PET/CT images of rat obtained from 2 consecutive 18F-FDG quantitative small-animal PET studies (top: conscious; bottom; unconscious). Yellow arrowheads point to harderian gland; orange to cortical brain. Orange region of interest depicts parietal brain region that was manually drawn to calculate CMRglc.
CMRglc from Repeated Quantitative Small-Animal PET
Differences in CMRglc between the left and right parietal brain were within 5%. The variations (e.g., the coefficient of variance) among the 3 repeated CMRglc measurements for each rat were less than 11% and less than 15% in conscious and unconscious brain, respectively. Figure 7 shows the CMRglc results of the 12 quantitative small-animal PET studies. CMRglc in conscious brain on PET (e.g., right parietal region, 99.6 ± 10.2 μmol/100 g/min; n = 6) was comparable to that found on 2-14C-deoxyglucose-autoradiography (8,13). CMRglc in the anesthetized unconscious brain on PET (e.g., corresponding right parietal region, 36.2 ± 5.6 μmol/100 g/min; n = 6) was suppressed by more than 50%.

CMRglc of each rat obtained from 6 repeated quantitative small-animal PET studies at different weeks. Charts compare CMRglc between conscious (black bars) and unconscious (white bars) brains.
DISCUSSION
Quantification using small-animal PET requires an input function in addition to the tissue images. Taking discrete, serial blood samples, however, was often complicated by blood coagulation. The conventional method to minimize blood coagulation involves alternation of blood drawing and heparin flushing between serial samples. As a consequence, the animal suffers from hemodynamic instability and the data collected are not reliable (14). For a while, we used externalized catheters for repeated studies on rats (7), but protection of the externalized catheter was difficult, and skin infections often occurred. Although an image-derived input function is a good alternative for repeated PET measurements, acquisition of a set of dynamic images requires that an animal be anesthetized (15). PET findings from an anesthetized animal may not represent the physiology of the conscious brain (16).
In this study, we used subcutaneous cannulas that allowed us to inject radiotracers and sample blood repeatedly from a rat without having to perform a second surgery. The major reason we could maintain the blood patency of a catheterized rat so well was the use of injection ports to seal the subcutaneous catheters. As shown in Figure 4B, one can connect to the bloodstream of a rat easily by puncturing the skin using a metal tube or a syringe. After the tube or needle is withdrawn, the subcutaneous catheter is sealed immediately, easing the blood-drawing and heparin-flushing steps during blood sampling. As for the animals, skin puncture caused minimal stress and healed quickly. Keeping a rat catheterized for repeated quantitative small-animal PET was not difficult either. We maintained the subcutaneous cannulas by replacing the heparinized glycerol (500 IU/mL) in the catheters weekly. Good blood patency was maintained, and the rat grew steadily for 1.5 mo (Fig. 2). Validation of a longer period of catheterization is needed.
Integration of quantitative small-animal PET with an automated, microvolumetric blood-sampling technique contributed another factor to our success (Figs. 3 and 4A). The accuracy and precision of the microfluidic results have been validated in mice (6) and in rats (unpublished data). The microvolumetric blood changes minimize stress to the animal. Blood loss totalled less than 250 μL for each quantitative small-animal PET study and was due mainly to the deliberate, excessive disposal of dead-space fluid (i.e., heparinized blood in catheters) so that real-time, circulated WB samples were collected. The microfluidic device is inexpensive, easy to fabricate, and flexible in automation (17,18). Related microfluidic devices with additional functionalities, such as plasma separation or real-time blood counting, have been developed (19,20). In rats with prolonged catheters, these new devices can certainly facilitate more frequent use of quantitative small-animal PET. Potentially, the techniques of prolonged catheterization can be applied to mice. Our experience shows that maintaining patency in the femoral arteries of mice for 1 mo is not difficult. Cannulation of a femoral vein, however, is rather challenging.
Ideally, brain studies should be performed on freely moving, unanesthetized animals. Routine imaging of a conscious rodent is currently out of reach. Therefore, we adopted the approach of 14C-deoxyglucose autoradiography to study the conscious brain (Fig. 4A) (8). On 6 mornings, we successfully completed 12 18F-FDG quantitative small-animal PET studies on 2 rats. The CMRglc measured by this method was comparable to that reported for 14C-deoxyglucose autoradiographic methods (Fig. 7) (8,13).
There were some limitations to this study that affected the CMRglc outcomes. Ideally, a plasma-to-WB conversion curve (RFDG(t)) should be generated for each 18F-FDG quantitative small-animal PET study to derive an input function. Like others, we performed only one study, which had 8 large blood samples to derive a general conversion curve (i.e., Equation 3) for the reason mentioned in the Materials and Methods. Although Equation 3 might not reliably account for the 18F-FDG transportation rate of every rat at every occasion, the shape of this plasma-to-WB conversion curve was similar to the population conversion curves derived by others (4,6). In fact, the withdrawal of an additional 8 large blood samples did not substantially increase the blood loss of an animal (e.g., 5% vs. 1% of the total blood volume). The blood loss (<10%) in each case was considered minor, and the animal appeared asymptomatic (14). An individual conversion curve can be generated if an in-house centrifuge or in-house PET scanner is available. In the current study, the rate constants used in the operational equation were obtained from the PET studies of 8 normal rats (unpublished data). If the proposed method is applied to a disease state, a new set of rate constants should be evaluated to account for the possible physiologic changes.
Other factors that might have caused the variations among our repeated CMRglc measurements included the readings of blood glucose concentrations (i.e., Cp in Eq. 2). We used a pocket-sized glucose meter at the PET facility. The readings might not be as reproducible as those measured by a standard glucose analyzer. Furthermore, it was suggested that the subject fast 4 h in advance to avoid the influence of an increased serum glucose level and optimize cerebral 18F-FDG uptake (21). We did not keep the animals fasting because it was difficult to control their diets in a remote PET facility. The radioactive animal must be left in the PET facility overnight after a quantitative small-animal 18F-FDG PET study. These hard-to-control factors (e.g., housing climates, diets, and blood glucose) might account for the variations (coefficient of variance < 15%) in CMRglc found in our studies (Fig. 7) (1,8,13).
CONCLUSION
We developed and implemented methods that overcome the difficulties in performing quantitative small-animal PET. We demonstrated the feasibility of repeated quantitative small-animal PET by performing a proof-of-principle study at a remote PET facility. We verified that 18F-FDG can be a reliable tool to monitor the CMRglc of a rat over time. This study suggests that repeated quantitative small-animal PET imaging with an arterial input function can be used extensively to study biology, monitor disease intervention, and establish pharmacokinetics for new drugs.
DISCLOSURE
This work was supported by the Ministry of Science and Technology, ROC grant MOST 102-2314-B-030-008-MY3, and Cathay General Hospital grant 101-CGH-FJU-11. No other potential conflict of interest relevant to this article was reported.
Acknowledgments
The PET studies were performed at the Small Animal PET/CT Core Facility of the Neurobiology and Cognitive Science Center at National Taiwan University. We acknowledge and thank the facility for its support, and we also thank Yu-Sha Hsueh for technical support.
Footnotes
Published online Oct. 27, 2016.
- © 2017 by the Society of Nuclear Medicine and Molecular Imaging.
REFERENCES
- Received for publication August 19, 2016.
- Accepted for publication October 14, 2016.


Jump to section
Related Articles
Cited By...
- No citing articles found.