


Abstract
We addressed the questions of how cerebral glucose transport and phosphorylation change under acute hypoglycemia and what the underlying mechanisms of adaptation are. Methods: Quantitative 18F-FDG PET combined with the acquisition of real-time arterial input function was performed on mice. Hypoglycemia was induced and maintained by insulin infusion. PET data were analyzed with the 2-tissue-compartment model for 18F-FDG, and the results were evaluated with Michaelis–Menten saturation kinetics. Results: Glucose clearance from plasma to brain (K1,glc) and the phosphorylation rate constant increased with decreasing plasma glucose (Gp), in particular at a Gp of less than 2.5 mmol/L. Estimated cerebral glucose extraction ratios taking into account an increased cerebral blood flow (CBF) at a Gp of less than 2 mmol/L were between 0.14 and 0.79. CBF-normalized K1,glc values were in agreement with saturation kinetics. Phosphorylation rate constants indicated intracellular glucose depletion at a Gp of less than 2–3 mmol/L. When brain regions were compared, glucose transport under hypoglycemia was lowest in the hypothalamus. Conclusion: Alterations in glucose transport and phosphorylation, as well as intracellular glucose depletion, under acute hypoglycemia can be modeled by saturation kinetics taking into account an increase in CBF. Distinct transport kinetics in the hypothalamus may be involved in its glucose-sensing function.
Blood-borne glucose is the major source of energy for neuronal activity. The rate-determining processes involved in cerebral glucose consumption are glucose transport by hexose transporters (GLUTs) and glucose phosphorylation by hexokinase I (1). Both processes underlie Michaelis–Menten saturation kinetics and can adapt to some extent to chronic hypo- or hyperglycemia. Studies in rats have revealed several possible processes by which the brain adapts to glucose deprivation during acute, recurrent, or chronic hypoglycemia. Glucose permeability of the blood–brain barrier (BBB) is increased in models of chronic hypoglycemia. Amplified synthesis and translocation of GLUT1 to the plasma membrane of microvascular endothelial cells have been demonstrated (2–4). In addition, upregulation of neuronal GLUT3 expression is likely to be involved in the brain’s adaptation to chronic hypoglycemia (4,5).
Less is known about adaptations under acute hypoglycemia. Cerebral blood flow (CBF) and, therefore, glucose delivery are increased at a plasma glucose level (Gp) of less than 2 mmol/L (6). Increased glucose permeability of the BBB and in particular translocation of GLUT1 to the cell surface have been suggested as causal mechanisms for elevated transport (6–8). Awareness of acute hypoglycemia is a vital response to low Gp. Hypoglycemia unawareness is a life-threatening problem in patients with type 1 insulin-treated diabetes of long duration and repeated episodes of hypoglycemia. There is ample evidence that the hypothalamus has a glucose-sensing function. Although GLUT1 is the major glucose transporter at the BBB in general, some regions in the hypothalamus contain high levels of GLUT2 (9). Two major features of GLUT2 may be involved in glucose sensing. GLUT2 has a higher Michaelis–Menten constant KT than GLUT1 (10), and a glucose-sensing receptor function was described for an intracellular sequence of GLUT2 (9). In addition, the rate of glucose phosphorylation was found to be altered specifically in the hypothalamus after a history of hypoglycemia (11).
Kinetic modeling of brain uptake of the glucose analog 18F-FDG allows investigation of changes in cerebral glucose homeostasis in vivo. So far, 18F-FDG PET studies have focused on the cerebral metabolic rate of glucose (CMRglc) in rats. 18F-FDG PET on mice rather than rats has a greater potential to address specific questions related to human metabolic and neurologic diseases, as the mouse is the preferred species for transgenic disease models. CMRglc can be estimated from PET data without the requirement of a highly time-resolved input function (12). However, CMRglc provides no information on the individual contributions of transport and phosphorylation to glucose consumption. In addition, for a correct determination of CMRglc, the so-called lumped constant (LC) is indispensable, correcting for differences between 18F-FDG and glucose with respect to transport and phosphorylation kinetics, respectively (13,14). LC is often used as a Gp-independent parameter although the relative contributions of transport and phosphorylation may vary, depending on Gp.
The key limiting factor for determining both transport and phosphorylation kinetics in mice is the small blood volume and the resulting difficulty in measuring an adequate arterial input function. To overcome this issue, we adapted an earlier protocol for rats (15) to measurements in mice. This protocol is based on an arteriovenous shunt and a coincidence counter to record input functions with a high temporal resolution (16). With this, the rate constants of the single processes, that is, 18F-FDG transport and phosphorylation, are accessible.
Extending our data from normoglycemic mice (16) to data from mice undergoing insulin-induced acute hypoglycemia, we addressed the question of how acute hypoglycemia affects the kinetics of regional glucose transport and phosphorylation in the mouse brain. We evaluated whether the observed alterations are the consequences of saturation kinetics and increased CBF alone or whether additional physiologic adaptations such as alterations in barrier permeability need to be considered to model the data.
MATERIALS AND METHODS
Animal Preparation
Animal experiments were in accordance with the Swiss Animal Protection Law and were approved by the Veterinary Office of the Canton Zurich. To exclude strain-specific effects, we included 2 strains. Male CD1 (n = 10; weight, 34.2 ± 2.5 g [mean ± SD]) and C57BL/6 (n = 5, 27.1 ± 2.8 g) mice (Charles River) were housed under standard conditions. Data from non–insulin-treated animals (n = 14) were from recent experiments (16). Animals were prepared as described previously for the acquisition of PET/CT and input function (16). Briefly, catheters were inserted into the femoral artery and vein and were connected to form a closed shunt loop, which was guided through a coincidence counter (twilite; Swisstrace) and a peristaltic pump at a constant flow of 120 μL/min. Two 3-way valves were used for insulin and 18F-FDG infusion.
Insulin Infusion and Blood Sampling
Insulin (Actrapid, 1 IU/mL; Novo Nordisk) infusion rates were dependent on the animal weight and the initial and target Gp concentrations. For a mouse weighing 30 g, insulin infusion started with 9 μL/min for 1 min and then was decreased stepwise over 4 min to a constant rate of 3 μL/min. Whole-blood glucose was measured in samples of 5 μL with a blood glucose meter (Ascensia; Bayer HealthCare LLC) up to 4 times before the start of the PET scan. Blood glucose levels reached a steady state 10–15 min after infusion began. A larger arterial blood sample was drawn immediately after the PET scan. Plasma was separated by centrifugation, and Gp was measured with a glucose oxidase/reflectance system (Vitros DT60 II; Ortho Clinical Diagnostics).
Imaging
PET scanning and 18F-FDG infusion were started simultaneously when Gp had reached a plateau of less than 2.5 mmol/L. The isoflurane dose was adjusted to maintain the respiratory rate at between 75 and 100 bpm, and body temperature was kept between 36.5°C and 37.3°C. PET acquisition was performed as described previously with a VISTA eXplore PET/CT scanner (GE Healthcare, 0.9-mm resolution in full width at half maximum in the center of the field of view) (16). PET data were reconstructed to a nominal voxel volume of 0.116 mm3. Whole-blood radioactivity was recorded in real time with the coincidence counter and translated to plasma 18F-FDG concentration (16). Injected 18F-FDG doses were 10–15 MBq (40–60 pmol) in 200 μL, resulting in plasma 18F-FDG concentrations of less than 10 nM.
PET/CT images were coregistered with the PMOD software (PMOD Technologies Inc.) to a mouse brain template provided by PMOD. Template volumes of interest were used to generate time–activity curves for the following structures: cerebrum (362 mm2), cortex (149 mm2), striatum (25.8 mm2), hippocampus (25.0 mm2), thalamus (28.2 mm2), hypothalamus (11.6 mm2), and cerebellum (57.2 mm3) (Supplemental Fig. 1; supplemental materials are available at http://jnm.snmjournals.org).
Kinetic Modeling
Time–activity curves were analyzed by 2-tissue-compartment 18F-FDG kinetic modeling with PMOD as described previously (16) to determine the clearance K1,FDG (mL/min per cm3 tissue) for 18F-FDG transport from plasma to brain and the rate constants (1/min) k2,FDG for reverse transport, k3,FDG for 18F-FDG phosphorylation, and k4,FDG for dephosphorylation (17). Image data were corrected for blood radioactivity with a fractional cerebral blood volume of 5.5% (18). The transport rate of glucose from plasma to tissue (Tglc, μmol/min/100 g) was calculated according to Equation 1, Eq. 1with Gp being in mmol/L and ρ being brain tissue density of 1.04 g/cm3 (19). L1 is the ratio between K1,FDG and K1 of glucose (K1,FDG/K1,glc = 1.48). L1 corrects for differences in 18F-FDG and glucose transport kinetics and was determined in nonsedated humans at a Gp of 3–16 mmol/L and was about 10% lower than estimated for pentobarbital-anesthetized rats (20) (supplemental data).
Influence of CBF on K1,glc and Tglc
The extraction ratio of glucose from plasma to brain tissue (Eglc) was estimated with Equation 2. The permeability–surface area product (PSglc), that is, K1,glc values at infinite CBF, was extrapolated with Equation 3. Hypothetical K1,glc at a given CBF was estimated from PSglc with Equation 4 (21): Eq. 2
Eq. 2 Eq. 3
Eq. 3 Eq. 4with CPF being cerebral plasma flow, that is, the product of [1 − hematocrit = 0.56] (22) and CBF in mL/min/cm3. At a Gp of more than 2 mmol/L, a CBF of 1.30 mL/min/cm3 (averaged from (23), excluding corpus callosum) was used except for the hypothalamus, for which a CBF of 0.86 mL/min/cm3 was used (24). An increase in CBF by 57% (supplemental data: 0%–100%) was assumed at a Gp of less than 2 mmol/L (6,25).
Michaelis–Menten Saturation Kinetics
To estimate Michaelis–Menten parameters, average Gp along the capillary (G′p) was calculated from the arterial Gp with Equation 5. The correction was not applied to Gp in Equation 1, because a similar reduction in the concentration of 18F-FDG (input function) and Gp along the capillary was assumed. K1,FDG is thus underestimated by a factor similar to G′p/Gp. Eq. 5
Eq. 5
Michaelis–Menten functions as shown in Equations 6 and 7 (and the supplemental data) were fit to K1,glc and Tglc, respectively, by least-squares regression analysis (SigmaPlot, version 12.5; Systat Software Inc.). K1,glc values at a Gp of less than 2 mmol/L were normalized to physiologic CBF with Equations 2–4 to exclude the effect of increased CBF. Estimated parameters were the maximal capacity (Tmax), G′p at half Tmax (KT), and Tmax/KT (K1,glc1st order) for glucose transport. Multiplication of Equation 6 by Gp reveals Equation 7. Eq. 6
Eq. 6 Eq. 7
Eq. 7
Equation 6 was used correspondingly to analyze k3,glc (L3 = k3,FDG/k3,glc = 0.38 (20)). Tmax was replaced by Vmax × Gp/Gi, the maximal phosphorylation velocity, where Gp/Gi is the correction factor for the ratio between Gp and intracellular glucose concentration (Gi). KT was replaced by KM, that is, G′p at half maximal Vmax × Gp/Gi. Fitting for (Vmax × Gp/Gi)/KM revealed k3,glc1st order. The 18F-FDG uptake rate constant (KFDG), the relative volume of distribution (VD), and CMRglc were calculated according to Equations 8–10 with LCs as described below. Eq. 8
Eq. 8 Eq. 9
Eq. 9 Eq. 10
LC
The CMRglc of the cerebrum was estimated with 3 LCs: LC1, an invariable LC of 0.6 (26,27); LC2, a Gp-adjusted LC derived from the values reported for awake rats by Suda et al. (13) (for this purpose, we multiplied the LC values in rats by a factor of 1.35, to reach an LC of 0.6 on average in normoglycemic animals); and LC3, the LC derived from experimental parameters as proposed by Backes et al. and shown in Equation 11 (28), assuming L1 = L2 = 1.48 and L3 = 0.38 (20). Eq. 11
Estimation of Intracellular Glucose Concentration
The intracellular glucose concentration Gi was iteratively estimated from Gp according to Equation 12. Eq. 12
Gp/Gi at a Gp of 5 mmol/L, where hexokinase I is saturated but not GLUT1, was determined by iteration; KM was 0.04 mmol/L (29). All other parameters were fit as described above.
Statistics
The influence of brain region on single rate constants, KFDG, and CMRglc was assessed with repeated-measures ANOVA with brain region as the within-subject factor (cortex, striatum, hippocampus, thalamus, cerebellum, and hypothalamus, i.e., df = 5). Significant F values are reported. For the purpose of post hoc testing with 2-tailed, homoscedastic t tests, data from regions with a significant within-subject effect were separated into a hypoglycemic group (Gp < 2.5 mmol/L, corresponding to G′p < 2 mmol/L) and a normoglycemic group (Gp > 2.5 mmol/L). All data are shown with associated SD unless otherwise stated. The supplemental data report R2.
RESULTS
The insulin-clamp protocol resulted in a Gp of 1.9 ± 0.3 mmol/L (n = 14, plus 1 outlier with 3.8 mmol/L because the initial infusion rate was accidentally reduced). 18F-FDG plasma clearance was faster in hypoglycemic than normoglycemic animals (Fig. 1).

Brain time–activity curves and arterial input functions in representative normoglycemic mouse (norm, Gp 6.7 mmol/L) and hypoglycemic mouse (hypo, Gp 2.1 mmol/L).
Influence of CBF on Cerebral Glucose Transport
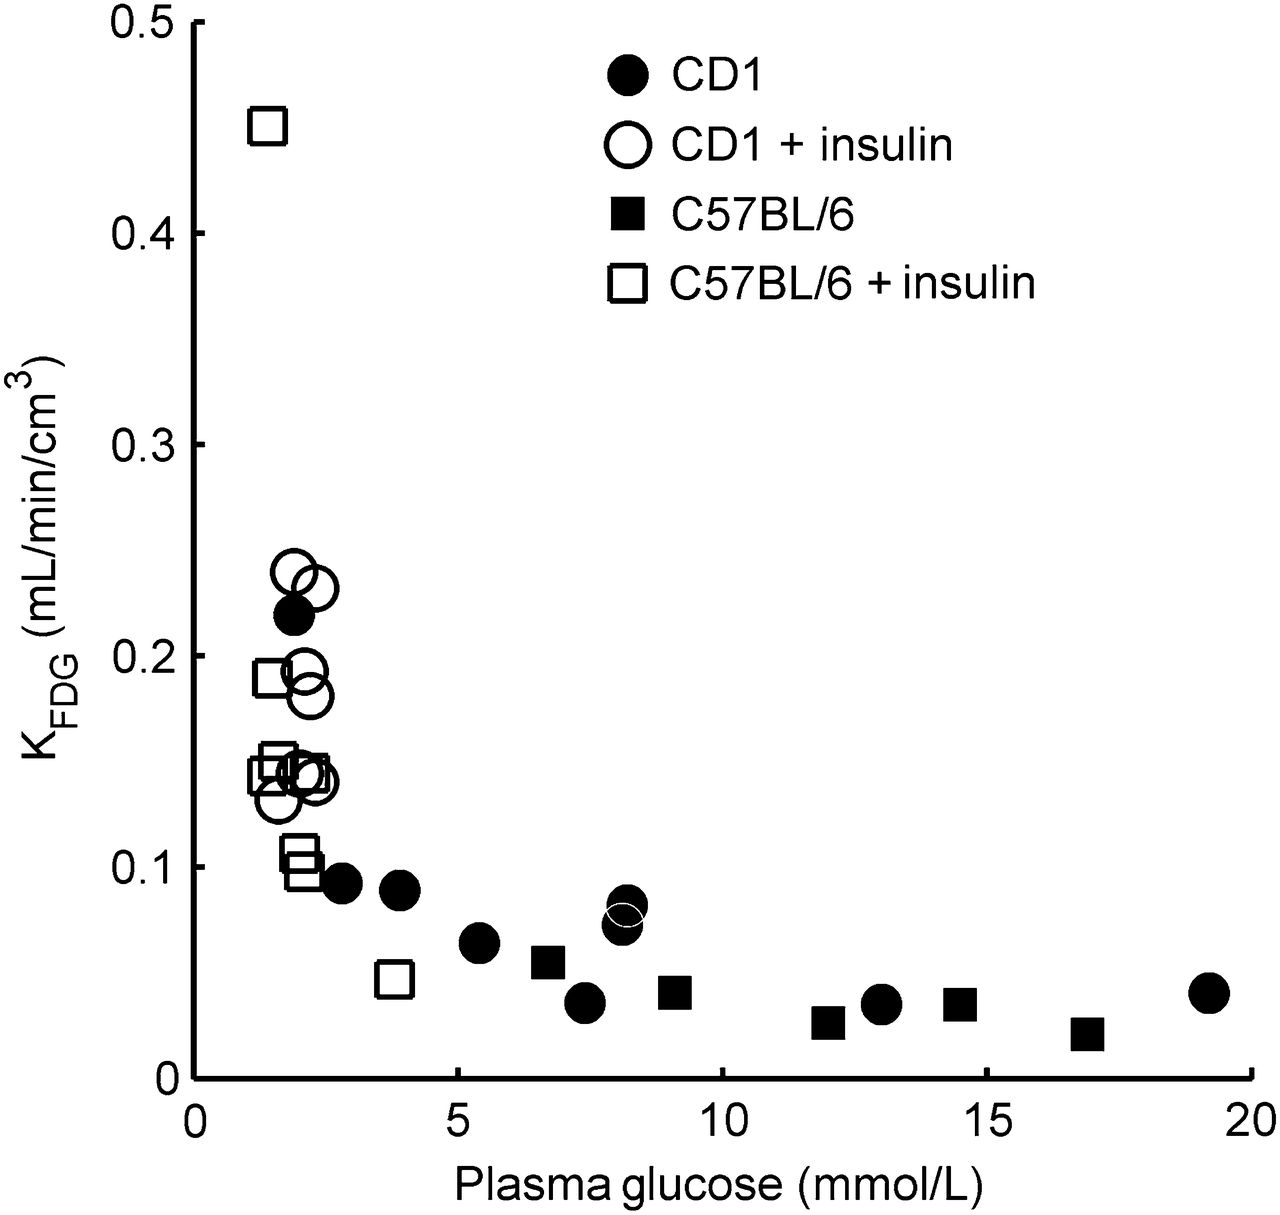
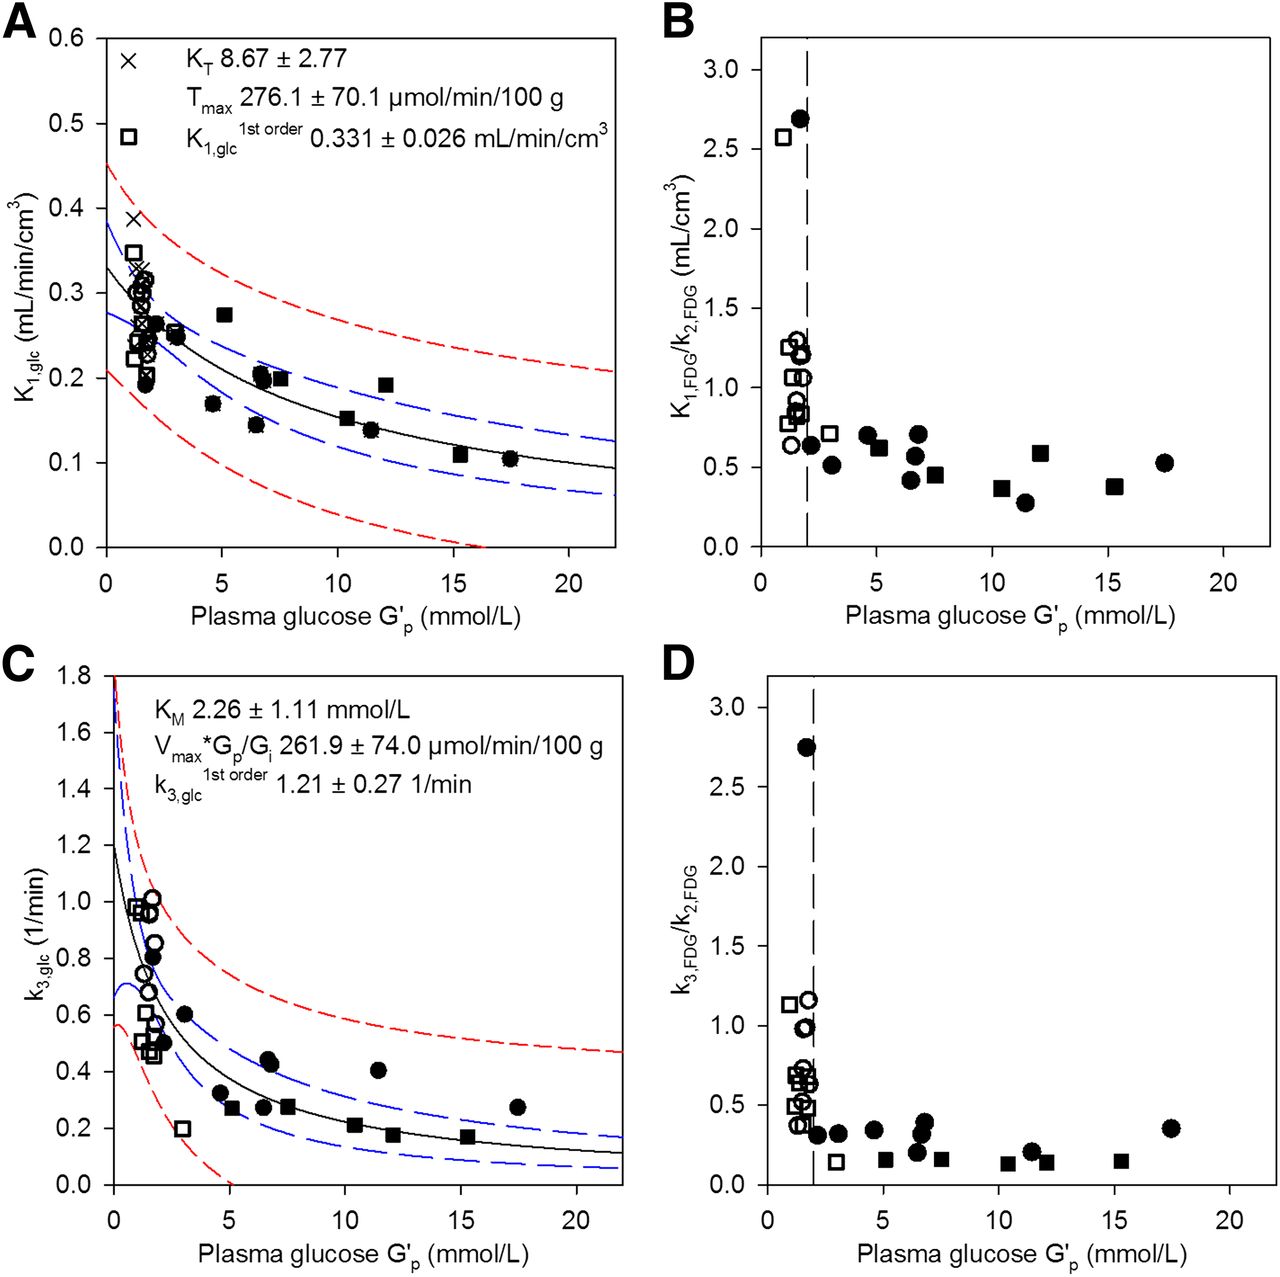
As shown in Figure 2A, K1,glc (K1,FDG/L1) was highest at a low Gp and decreased with increasing Gp. Tglc followed a typical saturation function (Supplemental Fig. 2). Because CBF increases abruptly at a Gp of less than 2 mmol/L in rats (6,25), we first investigated to what extent a similar increase in CBF would affect K1,glc. We assumed a 57% increase in CBF at a Gp of less than 2 mmol/L from 1.30 to 2.04 mL/min/cm3 (6,23,24) and estimated the corresponding hypothetic K1,glc at 1.30 mL/min/cm3 with Equations 2–4. Figure 2A and Supplemental Figure 3 show the uncorrected and CBF-normalized K1,glc values. At a Gp of less than 2 mmol/L (CBF, 2.04 mL/min/cm3), PS ranged from 0.22 to 0.80 mL/min/cm3 (0.40 ± 0.19); at a Gp of 2–3 mmol/L (CBF, 1.30 mL/min/cm3), from 0.24 to 0.41 (0.33 ± 0.06); and at a Gp of more than 3 mmol/L, from 0.11 to 0.35 (0.22 ± 0.07). Eglc was between 0.14 (highest Gp) and 0.79 (lowest Gp). The estimated average increase in K1,glc, Tglc, and KFDG due to the assumed 57% increase in CBF was 9% (6%–19%). Doubling the CBF would result in an estimated average increase of 13% (7%–25%). Simulations for K1,glc, Eglc, and PSglc with CBF increases of between 0% and 100% and 2 different L1 values are shown in Supplemental Figures 4–6. Supplemental Figure 4 also shows G′p in relation to Gp. K1,glc was additionally calculated from PSFDG/L1 to evaluate possible artifacts due to CPF-limited transport when K1,FDG/K1,glc approaches 1 and K1,FDG/L1 underestimates K1,glc (Supplemental Fig. 7).

(A) Glucose clearance K1,glc from plasma to brain increases with decreasing Gp. K1,glc at Gp of less than 2 mmol/L was normalized for CBF. (B) 18F-FDG partitioning at BBB (K1,FDG/k2,FDG) with sharp increase below G′p 2 mmol/L (dashed line). (C) k3,glc sharply increased at G′p of less than 2 mmol/L. (D) Intracellular balance between 18F-FDG phosphorylation and efflux (k3,FDG/k2,FDG). Open symbols = insulin-treated; closed symbols = untreated; squares = 57BL/6 mice; circles = CD1 mice; crosses = not corrected for CBF increase (Supplemental Fig. 3); solid black line = fit with Equation 6 (fit parameters in graph); dashed blue lines = 95% confidence band; dashed red lines = 95% prediction band. R2 = 0.553 (A), 0.616 (C).
Influence of Glucose Concentration on Transport and Phosphorylation
The K1,glc and Tglc of the cerebrum were further analyzed with Michaelis–Menten saturation kinetics. To normalize for changes in CBF, K1,glc and Tglc values at a Gp of less than 2 mmol/L were estimated for physiologic CBF as described above. The fit parameters obtained with Equations 6 and 7 are shown in Figure 2A and Supplemental Figures 4, 5, and 7 for CBF increases of between 0% and 100% and for L1 values of 1.48 (humans) and 1.66 (pentobarbital-anesthetized rats). Depending on L1 and the assumed CBF increase at a Gp of less than 2 mmol/L, Kt varied between 6.7 ± 2.5 mmol/L (L1 = 1.48, no CBF increase) and 9.3 ± 2.9 mmol/L (L1 = 1.48, 100% CBF increase) and Tmax between 215 ± 62 μmol/min/100 g (L = 1.66, no CBF increase) and 289 ± 71 μmol/min/100 g (L = 1.48, 100% CBF increase).
The efflux rate constant k2 scattered between 0.11 and 0.76/min and did not correlate with Gp (Supplemental Fig. 8). To visualize the influence of Gp on glucose partitioning at the BBB, the partition coefficient K1,FDG/k2,FDG was plotted versus G′p (Fig. 2B). Net glucose partitioning from plasma to brain was higher in hypoglycemia than normoglycemia.
Plotting k3,glc over G′p showed a sharp increase in k3,glc at a G′p of less than 2.0 mmol/L (Gp < 2.5 mmol/L; Fig. 2C). Fit parameters of the analysis with Equation 6 are shown in Figure 2C. The intracellular balance between 18F-FDG phosphorylation (k3,FDG × Gi) and efflux (k2,FDG × Gi) is shown in Figure 2D (k3,FDG/k2,FDG). The ratio k3,FDG/k2,FDG was not influenced by a Gp of above 2.5 mmol/L but was significantly increased below 2.5 mmol/L (G′p < 2 mmol/L) (k3/k2 = 0.24 ± 0.10, n = 14, at euglycemia, vs. 0.87 ± 0.60, n = 14, at Gp < 2.5 mmol/L; P < 0.001). Dephosphorylation of FDG-6-phosphate as described by k4,FDG was significantly different from zero in all animals, with high scattering and no obvious dependence on Gp (Supplemental Fig. 9). KFDG and VD were derived from the single rate constants and showed respective patterns (Fig. 3 and Supplemental Fig. 10). Both increased when Gp was reduced.
KFDG shows clear dependence on Gp.
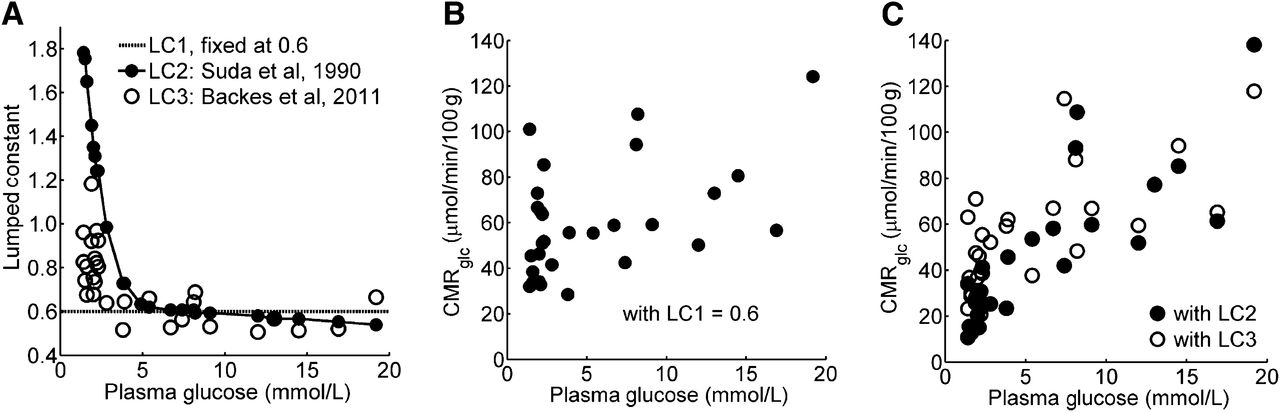
Figure 4A shows the LCs as described in the “Materials and Methods” section. When estimated with a fixed LC of 0.6, CMRglc was independent of Gp (60 ± 5 vs. 51 ± 6 μmol/min/100 g in animals with a Gp greater and less than 2.5 mmol/L, respectively) despite the significant increases in Tglc (Supplemental Fig. 2) and k3,FDG × Gp (not shown) with increasing Gp. However, when LC2 or LC3 was applied, the average CMRglc in animals with a Gp of more than 2.5 mmol/L was higher in all brain structures examined than the average CMRglc in animals with a Gp of less than 2.5 mmol/L (all P < 0.003, Table 1; Figs. 4B and 4C).

CMRglc (μmol/min/100 g) Grouped by Gp, Estimated with Different LC
Brain-Region–Specific Response to Hypoglycemia
Brain region had a significant influence on K1,FDG (F = 7.468, P < 0.0005), KFDG (F = 14.346, P < 0.0005), and CMRglc (F = 24.523, P < 0.0005) but not on k2,FDG, k3,FDG, and k4,FDG (all P > 0.28). CMRglc was estimated with LC1 in this analysis. The use of either LC2 or LC3 yielded the same conclusion. Pairwise comparison showed significantly lower KFDG and CMRglc in the hypothalamus and cortex than in any other brain region included in the analysis. In addition, K1,FDG was lower in the hypothalamus than in any other structure. The differences in K1,FDG and KFDG between the hypothalamus and other brain regions were dependent on Gp: although K1,FDG and KFDG were not significantly different between brain regions at a Gp of more than 2.5 mmol/L, they were less increased (by 15% and 19%) under hypoglycemia in the hypothalamus than in other brain structures. The findings in the cortex were similar (12% and 17% less increase for K1,FDG and KFDG, respectively). These findings are summarized in Table 2, and dot–box plots are shown in Supplemental Figure 11. Differences in CMRglc between the regions were independent of Gp, that is, there was no region × Gp interaction influencing CMRglc.
Post Hoc Tests of Repeated-Measures Variance Analysis
K1,glc, Tglc, and k3,glc of the respective brain regions were fit to G′p with Equations 6 and 7. Figure 5, Supplemental Figure 12, and Supplemental Figure 13 show the respective data and fits for glucose transport. As found for the cerebrum (Fig. 2A and Supplemental Fig. 2), transport in the cortex, striatum, hippocampus, and thalamus followed typical saturation kinetics. However, plots from the cerebellum and in particular the hypothalamus had a less pronounced shape of saturation. When fit with both Equation 6 and Equation 7, the hypothalamus had the highest Tmax and KT at the lowest K1,glc1st order of all studied regions (Fig. 5, Supplemental Fig. 12, and Supplemental Fig. 13). This case was also true when K1,glc was calculated via PSglc/L1 (assuming a 57% CBF increase at a Gp of less than 2 mmol/L) and when normalization was to 1.3 instead of 0.86 mL/min/cm3 CBF, indicating that CBF was not responsible for these observations. The hypothalamus thus has the highest glucose influx at a high Gp but the lowest influx under hypoglycemia. Region-specific k3,glc as a function of G′p had similar patterns for all investigated brain regions (Supplemental Fig. 14).

Influence of Gp on K1,glc in cortex (A), striatum (B), cerebellum (C), and hypothalamus (D). Lines as in Figure 2A. Values at Gp of less than 2.0 mmol/L were corrected for expected increase in CBF by 57%. Hippocampus and thalamus, as well as Tglc vs. G′p, are presented in Supplemental Figures 12 and 13. R2 = 0.524 (A), 0.589 (B), 0.399 (C), and 0.289 (D). Solid black line = fit with Equation 6 (fit parameters in graph); dashed blue lines = 95% confidence band; dashed red lines = 95% prediction band.
Estimation of Intracellular Glucose Concentrations
The estimated cerebral and hypothalamic Gi is shown in Figure 6 as a function of Gp. Although the estimated Gi was similar in both brain regions at a Gp of 6.4 mmol/L (i.e., Gi = 2.0 mmol/L), it was lower in the hypothalamus than in the cerebrum at a lower Gp but higher at a Gp of more than 6.4 mmol/L. The estimated Vmax of phosphorylation (Eq. 12) was 67.4 and 61.0 μmol/min/100 g for the cerebrum and hypothalamus, respectively. These values are close to the CMRglc values reported in Table 1.
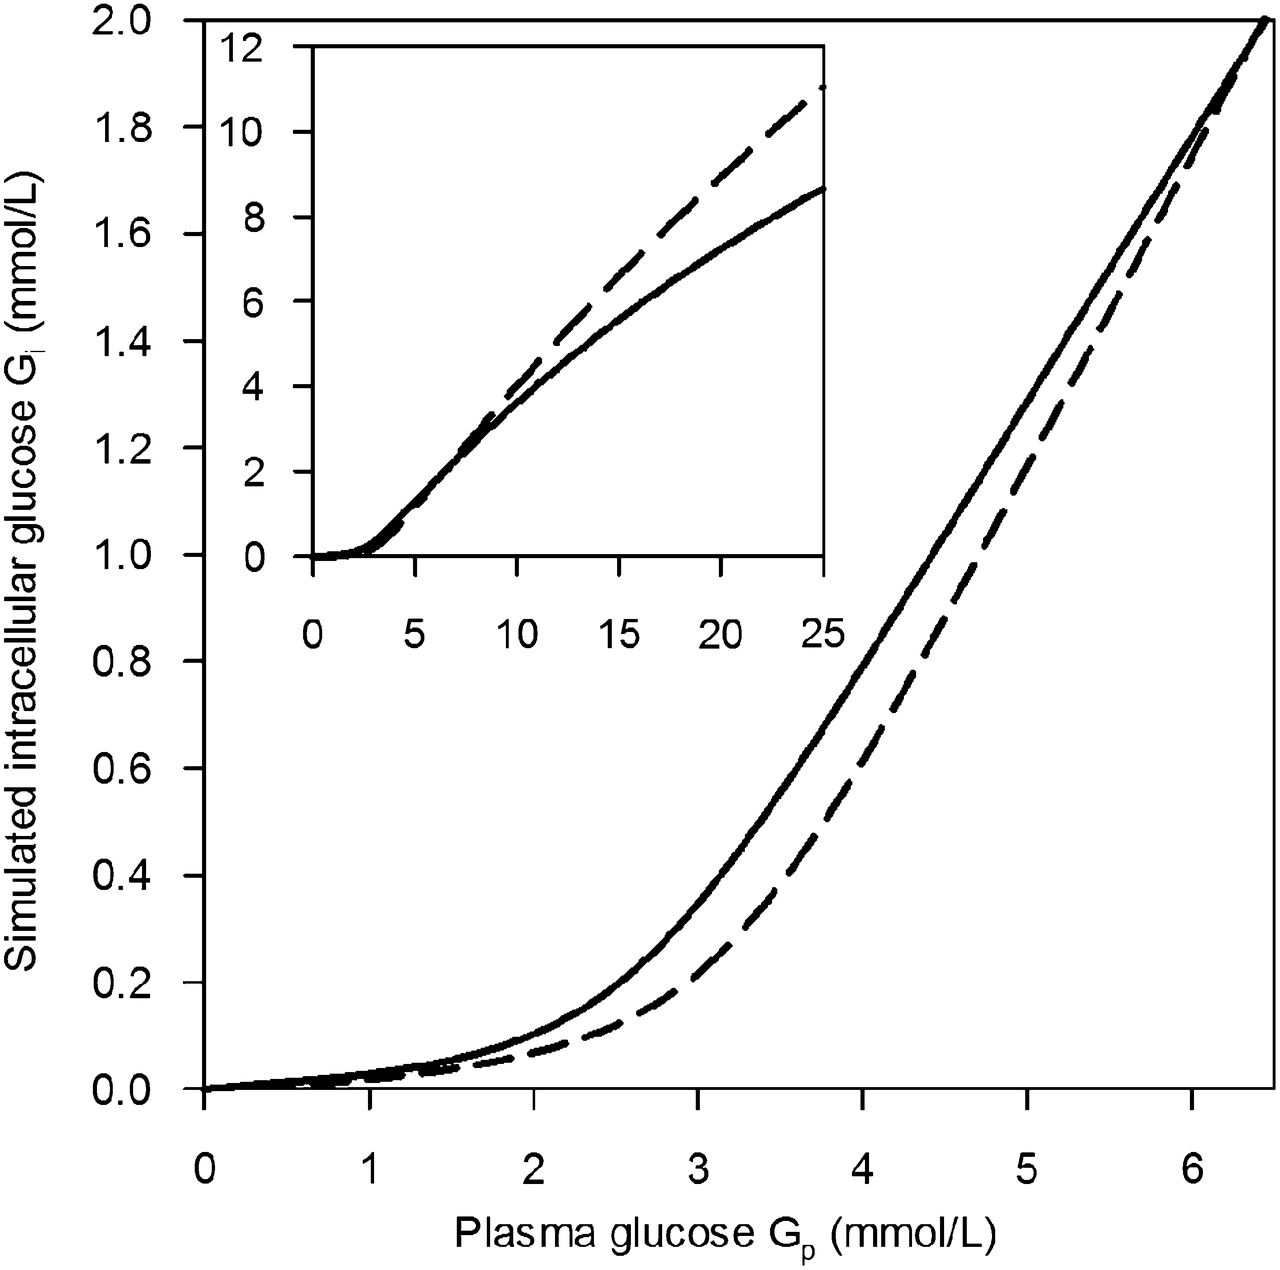
Intracellular glucose concentrations of cerebrum (solid line) and hypothalamus (dashed line) simulated as functions of Gp from fit parameters for transport and phosphorylation. Inset shows extended Gp range.
DISCUSSION
Applying our recently published technique for highly time-resolved monitoring of the 18F-FDG input function in mice (16), we investigated glucose transport and phosphorylation kinetics in mouse brain under acute insulin-induced hypoglycemia. We were able to assign the increase in K1,glc under hypoglycemia to 2 mechanisms. First, our simulations revealed that the expected increase in CBF at a Gp of less than 2 mmol/L (6,25) caused an increase in K1,glc, Tglc, and KFDG by 6%–19%. The elevation in CBF as a response to hypoglycemia was thus effectively improving glucose delivery to the brain parenchyma. In fact, as shown by Equations 2–4, the higher the K1,glc and therefore Eglc were, the stronger was the effect of CBF elevation on glucose transport.
After correction for the effect of CBF elevation at a low Gp, even when assuming doubling of CBF, cerebral K1,glc values were still higher at low than high Gp, and Tglc followed a typical saturation function when plotted against G′p. This finding was expected, as the apparent KT of GLUT1, the major GLUT isoform at the BBB, lies within the studied range of Gp. The fitted KT and Tmax were in the range of published values for rats (1,6,30,31). Applying L1 determined with pentobarbital-anesthetized rats instead of L1 determined with nonsedated humans reduced Tmax by about 10% without affecting Kt. We analyzed our data with the standard (irreversible) Michaelis–Menten model, not taking into account product inhibition—that is, transport inhibition or reversible transport at significant glucose levels on the trans side of the transporter (6). This explains the relatively high (apparent) KT values when compared with experiments under zero trans conditions (6,31). Another simplification was that we assumed only a single mechanism for glucose transport and did not consider additional saturable or nonsaturable routes (32). Regarding k2, we did not expect a marked influence of Gp, as intracellular glucose levels were assumed to be below the apparent KT of GLUT1. Translocation of GLUT1 to the plasma membrane at a low Gp (8) would result in an increase in k2 under hypoglycemia. This possibility was not supported by our data, although the high scattering in k2 would not allow detection of minute changes.
Hexokinase type I is the major hexokinase isoform in the brain (33). The enzyme is saturated under normoglycemia, because KM (40 μmol/L) is far below Gi (>1 mmol/L at Gp > 5 mmol/L) (29,34). G′p at the half maximal phosphorylation rate was 2.3 mmol/L. This value is close to the reported Gp of 2 mmol/L in rats, at which intracellular glucose becomes depleted (6,34). It appears plausible that in our experiments intracellular glucose levels reached the KM of hexokinase I at a G′p of 2.3 mmol/L, resulting in an increase in k3,glc. Our simulation of Gi in the cerebrum revealed that Gi equals 149 μmol/L at a G′p of 2.3 mmol/L. Gi was 40 μmol/L at a G′p of 1.3 mmol/L. Taking into account the several assumptions made for this analysis and the uncertainty of the fits at a low G′p, our results support our hypothesis that the CBF increase and saturation kinetics alone can describe the physiologic responses to hypoglycemia in the mouse brain, including intracellular depletion of glucose at a Gp of less than 2 mmol/L.
One of our key findings is that both brain glucose transport and phosphorylation rate constants determined with 18F-FDG PET depend on Gp. This finding is in agreement with predictions from theoretic analysis of the glia-vascular unit (1) and is supported by MR spectroscopy data (31) but is in contrast to other PET studies (27,35). A main reason for the discrepancies from previous PET studies lies in the choice of the LC (13,14), in particular under hypoglycemia. The influence of Gp was different on K1,FDG and k3,FDG. As CMRglc depends on both parameters, LC is not a constant but is dependent on Gp. Determining K1,FDG-k3,FDG helps to avoid misinterpretations of 18F-FDG PET results by comparing CMRglc values calculated with inaccurate LC values. LC3 (28) allows Gp-dependent LC values, provided that species-specific L1 to L3 is available. However, L1 should be defined as PSFDG/PSglc to take into account the influence of CBF on K1,FDG/K1,glc, as this ratio approaches 1 when CBF becomes rate-limiting. Alternatively, and to validate LC3, experimentally determined LC values are required for mice over a broad Gp range, as done thus far in awake rats (LC2) (13).
The ratio Tmax/CMRglc was constant under euglycemia in various nuclear magnetic resonance experiments. In rats anesthetized with α-chloralose and enflurane, the ratio was 4.5–4.7 and 5.8, respectively, estimated with the irreversible Michaelis–Menten model (6,31). Tmax/CMRglc in mouse cerebrum in our study was 4.2 (LC2) and 4.1 (LC3), respectively, which is in the range of published values for rats.
We found a peculiar pattern for glucose transport in the hypothalamus. Both K1,glc- and Tglc-versus-G′p plots indicated a transport mechanism with either high KT or absence of saturability within the studied Gp range. At high but not low Gp, this finding is in line with reports of a less restrictive BBB for glucose in this brain region (34). Our high KT would be in agreement with the reported presence of GLUT2 in the hypothalamus (36). The KT of GLUT2 is around 17 mmol/L (37). However, the contribution of GLUT2 to overall glucose transport in the hypothalamus is not known. Under hypoglycemia, glucose transport was lowest in the hypothalamus as judged from K1,glc1st order and K1,glc. However, the absolute numbers of the regional analysis must be interpreted with caution considering the strong scattering in the data, spillover, and partial-volume effects.
Decreased 18F-FDG uptake in the hypothalamus was also observed in humans under hypoglycemia (38). Both observations of high transport at high Gp and low transport at low Gp, with the resulting effects on Gi as simulated in this study, are of interest in the context of the suggested mechanism of glucose sensing in the hypothalamus by an intracellular glucose-binding sequence of GLUT2 (9,39). Signaling could be effective at both extremes of Gp.
We cannot exclude a pharmacologic influence of insulin on the measured parameters. Insulin increases cortical blood flow in rats at doses of 120 ng/mL in superfused cerebral spinal fluid (40). We may induce similar insulin levels in cerebral vessels. However, our dataset included a hypoglycemic animal without insulin treatment and a normoglycemic one that received a lower insulin dose. Both datasets were in agreement with the others. Horinaka et al. (25) showed that insulin administered under euglycemia had no effects on CBF, and previous studies suggested no direct influence of insulin on KFDG (35). Isoflurane anesthesia has a significant influence on cerebral glucose metabolism. Our findings, therefore, cannot be directly translated to awake mice or mice under different anesthesia.
CONCLUSION
Glucose plasma-to-brain clearance and phosphorylation rate constant were increased under hypoglycemia. The alterations, including intracellular depletion of glucose, can be quantitatively described taking into account increased CBF and saturation kinetics of GLUT and hexokinase. In contrast to other brain regions, glucose transport in the hypothalamus did not show significant saturation and was lower under hypoglycemia but higher at a high Gp than in other brain regions. This could contribute to the reported glucose-sensing function of the hypothalamus.
DISCLOSURE
The costs of publication of this article were defrayed in part by the payment of page charges. Therefore, and solely to indicate this fact, this article is hereby marked “advertisement” in accordance with 18 USC section 1734. This work was supported by the Swiss National Competence Center for Biomedical Imaging (NCCBI) and in part by the Centre d’Imagerie BioMédicale (CIBM) of the UNIL, UNIGE, HUG, CHUV, EPFL, and the Leenaards and Jeantet Foundations. No other potential conflict of interest relevant to this article was reported.
Acknowledgments
We thank Alfred Buck, Bruno Weber, and Matthias T. Wyss (University of Zurich, Switzerland) for fruitful discussions.
Footnotes
Published online Oct. 24, 2013.
- © 2013 by the Society of Nuclear Medicine and Molecular Imaging, Inc.
REFERENCES
- Received for publication March 6, 2013.
- Accepted for publication July 11, 2013.


Jump to section
Related Articles
Cited By...
- No citing articles found.