


Abstract
Diseases and dysfunction of the central nervous system are often associated with regional changes in cerebral glucose metabolism, which can be measured in vivo by PET using 18F-FDG as the tracer. For quantification, the arterial tracer input function must be determined. For rodents in particular, direct measurement of blood radioactivity concentration is scarcely feasible for follow-up of individual animals because of the invasiveness of blood sampling. We show that the whiskers area of the rat's muzzle serves as an extracerebral reference region. The derived model also takes into account local variations of the lumped constant, which is crucial in pathologic tissue. Methods: In 11 rats, the reference tissue kinetic parameters were determined from PET data and measured whole blood radioactivity concentration. Parametric images of cerebral kinetic rate constants were calculated using the directly measured input function, the reference tissue time–activity curve with individually fitted reference kinetic parameters, and the reference time–activity curve with fixed reference kinetic parameters calculated from the fitted parameters averaged over all animals. The need for kinetic modeling in disease models is demonstrated in 5 rats subjected to acute focal cerebral ischemia. 18F-FDG metabolism and transport rate constants and local cerebral glucose metabolic rates were calculated. Results: Cerebral kinetic constants derived from the 3 methods corresponded closely. The maximum difference in whole-brain kinetic parameters observed between the directly measured input function and the reference tissue time–activity curve with individually fitted reference kinetic parameters was less than 5%. Taking fixed reference parameters (the reference time–activity curve with fixed reference kinetic parameters calculated from the fitted parameters averaged over all animals) still provided whole-brain kinetic parameters with an accuracy of approximately 90%. In the rats subjected to focal cerebral ischemia, 18F-FDG kinetic parameters in healthy tissue were not significantly different from whole-brain kinetic parameters in naive rats. The ischemic region was characterized by preserved glucose metabolism, although 18F-FDG uptake was elevated significantly—that is, the lumped constant in the ischemic region was different from that of healthy brain tissue. Conclusion: The method presented here allows for the quantitative noninvasive determination of cerebral glucose consumption in rats, takes into account local variations of the lumped constant, and is suitable for follow-up measurements of individuals.
Local cerebral glucose metabolism can be measured noninvasively with PET using 18F-FDG as the radiotracer (1–3). For quantification of cerebral metabolic rate of glucose consumption, the tracer input function needs to be determined. In experimental PET, direct measurement of the input function by arterial blood sampling is often not applicable, particularly for follow-up of individual small animals. Alternative approaches have been proposed, including semiquantitative methods based on a definition of a standardized uptake value (4–6), reference tissue models (7–9), application of generalized input functions, or image-derived input functions from PET data (10–12). Standardized uptake values and generalized input functions are prone to tracer injection variability. Reference tissue models are commonly used in receptor binding studies, in which the reference tissue lacks specific binding sites. Intracerebral reference regions are questionable for determination of cerebral metabolic activity because they may be also subject to variations of brain metabolism.
Input functions derived from PET data are not susceptible to these errors and allow for the determination of the full set of the local cerebral kinetic parameters. However, acquiring image-derived input functions from small-animal PET data is not an easy task because small vascular structures are influenced by partial-volume effects. Furthermore, because of the limited field of view in most small-animal PET scanners, the rat's heart—as the preferred vascular volume—and brain cannot be assessed simultaneously.
We here propose the whiskers area in the muzzle as extracerebral reference region for measurement of cerebral glucose metabolism in rats and show that its 18F-FDG kinetics are characterized by 4 parameters that can be well approximated by fixed values. Local cerebral kinetic parameters calculated with the reference tissue model are compared with those obtained using the sampled arterial input function.
Furthermore, by application of the method to rats subjected to focal cerebral ischemia, we show the applicability of the method to disease models and demonstrate the need for full kinetic modeling to account for local variations of the lumped constant in pathologic tissue.
MATERIALS AND METHODS
Animal Preparation
All animal procedures were performed in accordance with the German Regulations for Animal Protection and were approved by the local animal care committee and local government authorities. For validation of the method, male Wistar rats (n = 11; weight, 290–370 g; age, 9–11 wk; food and water ad libitum) were anesthetized with 2.5% isoflurane delivered in 66%/33% nitrous oxide/oxygen. Catheters (polyethylene 50) were inserted into the left and right femoral arteries and veins. After surgery the animals were transferred to the PET scanner and placed in a thermostatically controlled water-heated animal carrier unit (Medres). Temperature and breathing rate were monitored throughout the experiment. Whole-blood glucose level was determined in a blood sample taken from the tail vein immediately after the PET scan. Measured glucose levels ranged from 181 to 282 mg/dL.
PET Measurement
Dynamic PET scans were performed in a microPET Focus 220 small-animal PET scanner (CTI/Siemens) under 2.5% isoflurane anesthesia (13). 18F-FDG (∼75 MBq in 500 μL) was injected into the femoral vein, and emission data were acquired for 60 min. After histogramming in time frames of 6 × 30, 3 × 60, 3 × 120, and 12 × 240 s and Fourier rebinning (14), data were reconstructed using 2-dimensional filtered backprojection with a ramp filter. Data were corrected for dead time (running global average), randoms (subtract delays), and decay. No scatter and attenuation correction were applied; through comparison of corrected and uncorrected data, we estimated the error to be on the order of 10% for our system and setup. Image analysis was performed using the VINCI software (15).
Blood Sampling
Arterial blood was sampled continuously, and radioactivity was measured with an in-house constructed blood sampler (16). Blood was extracted from a catheter placed in the femoral artery with a rate of 0.48 mL/min until 2 min after 18F-FDG injection. The catheter was then shortened, and discrete blood samples were taken at 3, 5, 10, 20, 30, 45, and 60 min. Sample radioactivity was measured in a CompuGamma CS γ-counter (LKB Wallac, Wallac Oy), and sample volume was determined by consecutive weighing. The blood sampler, PET scanner, and γ-counter were cross-calibrated. Plasma radioactivity concentration (CP(t)) was calculated from whole-blood radioactivity concentration (CB(t)) as CP(t) = (1.09 + 0.39exp(−0.072t))CB(t), with t being the time after injection in minutes (17). All values for radioactivity presented here were corrected for radioactive decay with respect to the start time of the PET scan.
Continuously sampled activities were corrected for delay by dividing the tube length from animal to counter by the propagation velocity (3 cm/s). With respect to the 30-s time frames, dispersion effects were negligible.
Rats with Focal Cerebral Ischemia
Ischemia was induced in male Wistar rats (n = 5) by intraarterial injection of TiO2 spheres into the middle cerebral artery (18). After exposure of the left common carotid artery, internal carotid artery (ICA), and external carotid artery, the external carotid artery and the pterygopalatine branch of the ICA were ligated. Polyethylene tubing filled with saline and 4 TiO2 macrospheres (diameter, 0.315–0.355 mm) was advanced through the common carotid artery into the ICA until the tip of the tube lay distal to the origin of the pterygopalatine artery. The macrospheres were conveyed into the ICA by injection of approximately 0.2 mL of saline. A catheter was inserted into the tail vein for PET tracer injection. 18F-FDG PET was performed at 1 h after induction of ischemia for 60 min.
Kinetic parameters in the ischemic and healthy tissue were tested statistically using the software package R (1- and 2-sample independent t test) (19).
Kinetic Modeling
The local cerebral kinetic rate constants of 18F-FDG were determined by fitting a 2-tissue-compartment model with 4 rate constants (1) (supplemental material; available online only at http://jnm.snmjournals.org). Parameters in this model are K1, the unidirectional clearance of 18F-FDG from blood to brain tissue; k2, the rate constant for transport from tissue to blood; k3, the rate constant for phosphorylation; and k4, the rate constant for dephosphorylation (Fig. 1). Parametric images of the rate constants were calculated by voxelwise fitting of Supplemental Equation 10, using a Powell algorithm (20).

18F-FDG pathway and rate constants in reference and cerebral tissue with a free (F) and a metabolized (M) tracer compartment. The rate constant for dephosphorylation in the reference tissue (k4R) is negligible. CF and CFR = free (unphosphorylated) FDG in brain and reference tissue, respectively; CM and CMR = metabolized (phosphorylated) FDG in brain and reference tissue, respectively; k2R = rate constant for transport from reference tissue to blood plasma; k3R (k4R) = rate constant for (de-) phosphorylation in reference tissue.
Reference Tissue Model
Here, we assume that the reference tissue kinetics follow the common irreversible 2-compartment model including vascular space (Fig. 1). The radioactivity concentration in the reference tissue (CR(t)) is then related to the tracer input function (CP(t)), fraction of blood volume in the reference tissue (vR), unidirectional transport rate constant from blood to tissue (K1R), partition coefficient (λR = K1R/k2R), and net 18F-FDG influx rate constant (KR = K1Rk3R/(k2R + k3R)), with k2R being the rate constant for transport from tissue to blood and k3R the phosphorylation rate constant:
Details of the derivation and the explicit functional expression of Equation 2 are given in the supplemental materials.
The tracer input function can be calculated from the reference tissue time–activity curve if the kinetic parameters of the reference tissue are known using Equation 2. In principle, any tissue can serve as a reference, provided its kinetics follow Equation 1 and its kinetic parameters are known. In addition, a reversible tissue could serve as a reference tissue, the formalism for which is given in the supplemental material.
Lumped Constant as Function of K1 and Ki
The differences between 18F-FDG and glucose can be expressed in terms of ratios of their kinetic rate constants: L1 = K1/K1,glc, L2 = k2/k2,glc, and L3 = k3/k3,glc. These parameters split the differences of glucose and deoxyglucose, summarized in the lumped constant (LC), into the underlying processes—that is, into differences in transport and phosphorylation, which are more likely to remain constant even in pathologic conditions (21,22). The glucose consumption rate constant Kglc can then be expressed as (22–24):
Localization of Whiskers Area
The whiskers area could be identified in PET data of the rat's muzzle (rostal of the Harderian glands) as the location with the highest radioactivity concentration during the first 4 min after the 18F-FDG intravenous bolus injection. The voxel with maximum radioactivity concentration was automatically detected and taken as the center of the volume of interest (VOI). This voxel can be either on the left or on the right side of the muzzle. The size of the VOI was chosen to be sufficiently large so as to reduce noise and ensure high reproducibility and low sensitivity of the resulting time–activity curve toward small shifts in the VOI location. We hence chose a size of 2.7 × 2.7 × 4.1 mm. The reference function CR(t) was then given by the time–activity curve of the reference VOI (Fig. 2B).

(A) Structure of whiskers area in rat's muzzle shown as MR image. (B) 18F-FDG PET image of rat's muzzle in transaxial (left), coronal (middle), and sagittal slices (right). Reference VOI is drawn in gray on top of slices. Red in center of VOI marks voxel with highest average radioactivity concentration during first 4 min after 18F-FDG injection. (C) Reference time–activity curve of rat 1, fitted time–activity curve, and time–activity curve calculated from sampled input function and fixed reference kinetic parameters from Table 1. (D) Directly measured input function (red), input function calculated from reference time–activity curve using fixed reference kinetic parameters, and directly measured input function in PET time frames. (E) Difference between input function calculated from reference time–activity curve using fixed reference kinetic parameters and directly measured input function in PET time frames as percentage of directly measured input function. Average and SD were calculated from all animals (n = 11). TAC = time–activity curve.
To visualize the anatomic structure of the whiskers area, MRI scans were obtained in 1 animal in a 4.7-T BioSpec animal scanner (Bruker BioSpin) using a quadrature transmit and receive birdcage coil (Rapid Biomedical) with an inner diameter of 38 mm. A T2-weighted sequence, rapid acquisition with relaxation enhancement, was used: rapid acquisition with relaxation enhancement factor, 8; repetition time/effective echo time, 5,000/56.0; averages, 2; matrix size, 256 × 256; field of view, 4.6 × 4.6 cm; 21 slices; slice thickness, 1.3 mm; and interslice spacing, 1.8 mm.
Determination and Validation of Reference Tissue Kinetic Parameters
To qualify as a suitable reference tissue, the whiskers area has to fulfill 2 requirements. First, the local cerebral 18F-FDG kinetic parameters obtained with the directly measured input function have to be comparable to those calculated with the reference tissue–derived input function. Second, the substitution of the reference tissue kinetic parameters by fixed kinetic parameters should still provide local cerebral 18F-FDG kinetic parameters with high accuracy.
The reference tissue kinetic parameters of 11 rats were determined by fitting Equation 1 with the directly measured input function from blood sampling to the reference VOI time–activity curve (CR(t)) using the Powell algorithm (20). The quality of the kinetic parameters was tested for each animal by comparing the directly measured input function with the input function calculated from CR(t), inserting the kinetic parameters of the reference tissue into Equation 2 (supplemental material).
Parametric images of cerebral 18F-FDG kinetic rate constants were calculated by voxelwise fitting of Supplemental Equation 10 for each rat using the directly measured input function, input function derived from the reference tissue time–activity curve and the individually determined kinetic parameters of the reference tissue (labeled fit), and input function derived from the reference tissue time–activity curve and fixed kinetic parameters calculated from the fitted parameters averaged over all animals (labeled mod).
The fractional blood volume (vB) was fixed to 0.05 in these calculations.
For comparison of the methods, average kinetic parameters within a whole-brain VOI were calculated from the parametric images. The linear correlation coefficient of Pearson product–moment correlation (ρ) was calculated to test the agreement of whole-brain kinetic parameters derived from the 3 methods. Additionally, the whole-brain kinetic parameters from the reference tissue model (mod) were compared in a Bland–Altman plot with those obtained using the directly measured input function.
RESULTS
The location of the whiskers area and anatomic structure are illustrated in Figures 2A and 2B. The extracted reference tissue time–activity curve (of rat 1) and the fit from Equation 1 are plotted in Figure 2C. The excellent agreement between the fitted and measured reference curves demonstrates that the reference tissue can be well described by the model. The resulting reference tissue kinetic parameters are listed in Table 1 for all animals. The average values (mean ± SD) are K1R = 0.37 ± 0.06 mL/cm3/min, λR = 0.55 ± 0.03, KR = 0.0040 ± 0.0014 mL/cm3/min, and vR = 0.14 ± 0.03. These were used as fixed parameters for the reference tissue model. The reference tissue time–activity curve calculated with Equation 1, with the fixed parameters and measured input function inserted, is shown in Figure 2C. The reference model input function was derived from the reference tissue time–activity curve and fixed reference kinetic parameters using the procedure described in the supplemental material. Sampled and model-derived input functions for a single rat (rat 1) are shown in Figure 2D, and their differences across all rats (n = 11) are shown in Figure 2E. In the second time frame, the model-derived input function overestimated the real input function by 30% on average, whereas there was a good agreement for the rest of the measurement time.
Kinetic Parameters of Whiskers Reference Region
Tables 2–6 list whole-brain kinetic rate constants (K1, k2, k3, k4, and Ki) obtained using the input function determined from blood sampling, respective rate constants derived from the reference tissue model with individually fitted reference tissue kinetic parameters (subscript “fit,” reference tissue kinetic parameters are listed in Table 1) and rate constants derived from the reference tissue model using fixed kinetic parameters of the reference region (subscript “mod”). Although the deviation of the fit parameters from the measured input function–derived parameters was less than 5% for all rate constants except for k4 (8.5%), the deviation of the average model (mod) was on the order of 10% (20% for k4). The kinetic parameters of fit and mod correlated significantly (P < 0.05 for k4; P < 0.001 for the other rate constants), with high correlation coefficients (ρ > 0.7), with those obtained using the input function from blood sampling. Supplemental Figure 1 shows parametric images from 1 rat (rat 1 in Tables 1–6) calculated with the 3 different methods.
Whole-Brain Kinetic Parameters: K1
Whole-Brain Kinetic Parameters: k2
Whole-Brain Kinetic Parameters: k3
Whole-Brain Kinetic Parameters: k4
Whole-Brain Kinetic Parameters: Ki
Differences in whole-brain parameters from the reference tissue model (mod) and respective parameters determined with the input function from blood sampling are illustrated in a Bland–Altman plot (Supplemental Fig. 2). The difference between the 2 methods did not depend on the magnitude of the kinetic parameters, and the bias was below 3%.
The sensitivity of the cerebral kinetic parameters with respect to changes in the reference VOI location was tested. A shift in the VOI location by 1 voxel (0.82 mm in the axial direction) caused changes in the cerebral kinetic parameters of less than 3% (<10% for k4).
Figure 3A displays parametric images of a rat at 1 h after middle cerebral artery occlusion (Supplemental Fig. 3). Average kinetic parameters in the healthy hemisphere of the animals with ischemia were not significantly different from whole-brain average parameters of the naive animals used for the validation of our model (K1 = 0.116 ± 0.015, t(4.6) = 1.98, P = 0.11; Ki = 0.021 ± 0.006, t(4.97) = 1.75, P = 0.14; Tables 2 and 6). In the animal shown in Figure 3, the acute ischemic tissue was characterized by a reduction of K1 (∼60% of healthy tissue), an increase of Ki (∼160% of healthy tissue), and a nearly preserved glucose consumption rate. Although there was heterogenous tissue response to ischemia, acute ischemic tissue with these properties (reduction of K1, increase of Ki, preserved glucose consumption rate) could be identified in all 5 animals. The ratio of the parameters in a VOI (1.14 × 1.14 × 2.46 mm) in the ischemic tissue and its contralateral counterpart are shown in Figure 3C. K1 was significantly reduced to 70% ± 7% (t(7.56) = −3.67, P = 0.007), Ki increased to 139% ± 25% (t(7.94) = 2.48, P = 0.038), and glucose consumption rate was preserved (103% ± 8%, t(7.36) = 0.35, P = 0.735).
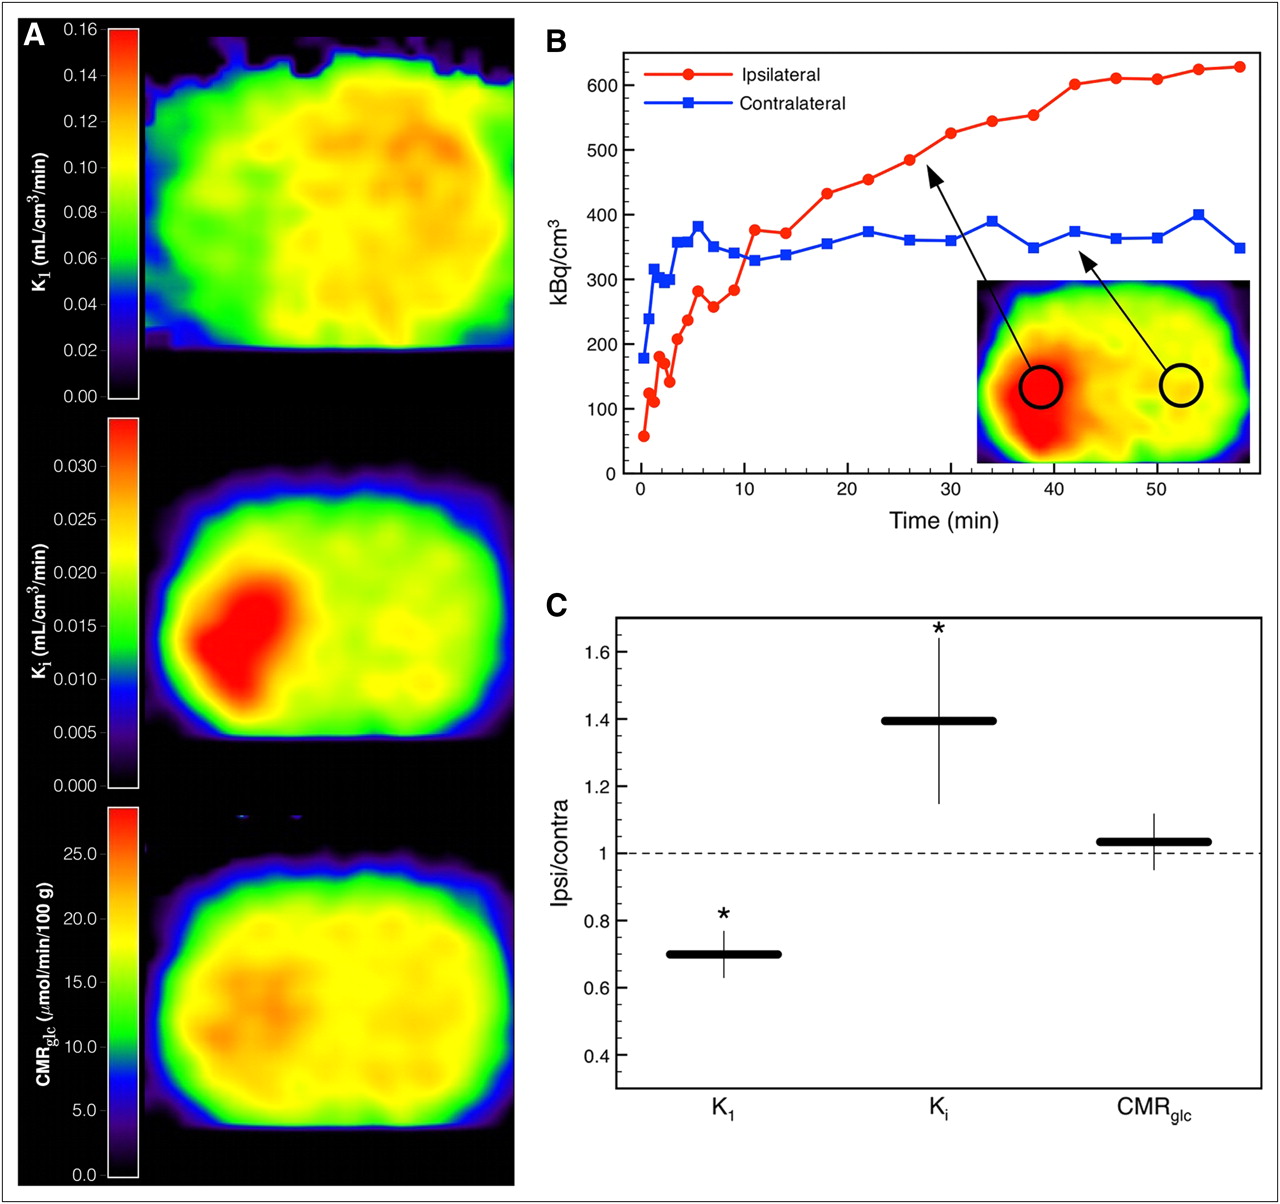
(A) Parametric images of 18F-FDG transport rate constant K1, net influx rate constant Ki, and glucose consumption rate CMRglc of a rat at 1 h after occlusion of left middle cerebral artery. (B) Tissue time–activity curves of ischemic and contralateral tissue. (C) Ratios of kinetic parameters in VOI (1.14 × 1.14 × 2.46 mm) in ischemic tissue and in respective contralateral healthy tissue averaged over 5 animals. Error bars show SD (*P < 0.05). Contra = contralateral; Ipsi = ipsilateral.
DISCUSSION
Reference Tissue Model
In contrast to the reference tissue models applied to receptor binding for which the reference tissue can be described by a 1-tissue-compartment model, our model is applicable to reference tissue according a 2-tissue-compartment model. Metabolic activity in the whiskers area is not negligible (KR ≠ 0). Although the KR values in the reference region were more than an order of magnitude lower than values of the transport rate constants (K1R), omission of KR produced a systematic underestimation of the cerebral metabolic rate constant Ki on the order of 30%.
As Figure 2 indicates, the 18F-FDG kinetics in the whiskers area could be excellently described by Equation 1. An approximate input function could be calculated from the reference tissue time–activity curve with fixed average reference kinetic parameters (Table 1). The resulting input function was a good approximation for the measured input function presented in the PET time framing (Fig. 2D). The overestimation in the second time frame (Fig. 2E) is followed by small underestimation in the consecutive 5 time frames and could be caused by the omission of dispersion correction for the continuously sampled input function. However, this omission did not have a noticeable influence on the derivation of cerebral kinetic parameters, because whole-brain kinetic parameters calculated with the different input functions showed good agreement (Tables 2–6).
To test the effect of shorter time frames on the estimation of the input function, the first 3 min of data of 4 animals were rebinned in 10-s frames. Whiskers area–derived input functions were then used for kinetic modeling. Cerebral kinetic parameters differed at maximum by 2% (K1), 6% (k2), 6% (k3), 24% (k4), and 1% (Ki) from the corresponding values obtained with 30-s time frames. Thus, we conclude that 30-s time frames are sufficient to describe 18F-FDG kinetics. Moreover, the shortest time scale for variations of cerebral 18F-FDG concentrations is 1/k2 > 5 min.
Whiskers Area as Reference Tissue
The whiskers area in the rat's muzzle constitutes a suitable reference region for the following reasons: it is located some distance away from the brain but close enough to be within the field of view when scanning the rat's brain, the roots of the whiskers are surrounded by arterial cylinders contributing a noticeable vascular fraction to the reference VOI (∼10%, Fig. 2); arterial cylinders display the highest radioactivity concentration within the muzzle during the first minutes after bolus injection of 18F-FDG and therefore the localization can be easily automatized; and its kinetics are well described by Equation 1 and can be approximated quite accurately using fixed average kinetic parameters.
The input function can also be derived from a reference tissue according to the kinetics of a reversible 2-tissue-compartment model (Supplemental Eq. 10). The procedure for calculating CP(t) in this case is described in the supplemental materials.
Limitations of Model
The application of the whiskers area reference tissue model is limited to cases in which 18F-FDG kinetics in the whiskers area are not altered by the disease model, medication, and such. For example, if the cerebral metabolism of transgenic rats is to be compared with that of wild-type rats, the whiskers area kinetic parameters of the transgenic rats need to be determined either to ensure that these are not different from those of the wild types or to determine the suitable parameters for the transgenic group.
Although demonstrated here for intravenous bolus injection, the model is also valid for all types of injections. Intraperitoneal injections and constant infusion are feasible, but a different relationship between whole-blood and plasma radioactivity concentrations has to be considered and the automatic localization of the whiskers area would then fail. Because the peaking radioactivity concentration in the rat's muzzle during the first minute after tracer injection is seen only after intravenous bolus injections, the region would have to be defined by other means when using other injection techniques.
Need for Kinetic Modeling in Disease Models
The reference tissue method described here allows noninvasive determination of the full set of cerebral 18F-FDG kinetic parameters. To test our method in a stroke animal model and to demonstrate the need for kinetic modeling in pathologic brain tissue, we applied the method to rats with acute focal ischemia measured at 1 h after permanent occlusion of the middle cerebral artery. Acute ischemic tissue was characterized by a reduction of the 18F-FDG rate constant K1 and an increase of the net 18F-FDG influx rate constant Ki indicating hypermetabolism (Fig. 3). To derive the glucose consumption rate from the 18F-FDG kinetic constants, Ki has to be divided by the LC, taking into account the differences in transport and phosphorylation of glucose and 18F-FDG. It has been shown that in healthy brain tissue LC is approximately constant. Reported values range from 0.42 to 0.89 (3,25–28). More precisely, LC can be expressed as a function of the 18F-FDG transport rate constant K1 and the net influx rate constant Ki (Eq. 3) (22). Thus, the glucose consumption rate constant can be calculated using either of the rate constants from kinetic modeling, which in our example yielded close to normal metabolism in the ischemic tissue, implying an elevated LC. Taking only Ki and ignoring the alterations of LC would produce ambiguous results and could lead to wrong conclusions. Ischemic tissue expressing these changes of LC could be identified in all 5 ischemic rats that were examined (Fig. 3C).
Our findings that the glucose consumption rate is more or less preserved in parts of the acute ischemic tissue is in accordance with the preserved oxygen consumption rate that has been observed in cats and baboons in the early phase after induction of ischemia (29,30). In the case of oxygen, the reduced delivery (cerebral blood flow) is compensated by an elevated oxygen extraction fraction. In the case of glucose, the reduced delivery (K1) is compensated by an elevated phosphorylation rate (hexokinase activity), leading, because of the different properties of 18F-FDG and glucose, to an increase in the 18F-FDG net influx rate constant (Ki), whereas the glucose consumption rate (Kglc) is preserved. A more detailed analysis and characterization of the ischemic tissue in terms of the 18F-FDG kinetic rate constants is beyond the scope of this work.
CONCLUSION
The method presented here allows full kinetic modeling of cerebral 18F-FDG uptake in rats by taking the whiskers area of the rat's muzzle as an extracerebral reference region. Kinetic modeling is especially important in pathologic tissue to account for variations in the local lumped constant. The method provides a tool for quantitative long-term follow-up measurements in individual rats.
DISCLOSURE STATEMENT
The costs of publication of this article were defrayed in part by the payment of page charges. Therefore, and solely to indicate this fact, this article is hereby marked “advertisement” in accordance with 18 USC section 1734.
Acknowledgments
We thank Annika Lindemann for the excellent technical assistance and Delphine Feuerstein for her supportive contributions to the preparation of the manuscript. No potential conflict of interest relevant to this article was reported.
- © 2011 by Society of Nuclear Medicine
REFERENCES
- Received for publication November 11, 2010.
- Accepted for publication March 31, 2011.


Jump to section
Related Articles
Cited By...
- Deficiency of Orexin Receptor Type 1 in Dopaminergic Neurons Increases Novelty-Induced Locomotion and Exploration
- Time Courses of Cortical Glucose Metabolism and Microglial Activity Across the Life Span of Wild-Type Mice: A PET Study
- Brain Glucose Transport and Phosphorylation Under Acute Insulin-Induced Hypoglycemia in Mice: An 18F-FDG PET Study
- Potential of Early [18F]-2-Fluoro-2-Deoxy-D-Glucose Positron Emission Tomography for Identifying Hypoperfusion and Predicting Fate of Tissue in a Rat Embolic Stroke Model