


Abstract
PET imaging of nonhuman primates (NHPs) requires correction of head motion if the subjects are scanned awake and their heads are unrestrained, because the NHPs move their heads faster and more frequently than human subjects. This work focuses on designing and validating 2 motion-correction algorithms for awake NHP brain PET imaging. Methods: Two motion-correction methods were implemented for awake NHP brain PET imaging: multiacquisition frame (MAF) and event-by-event (EBE). Motion data were acquired from an external motion-tracking device. The MAF method divides scan data into short subframes, reconstructs each subframe individually, and registers them to a reference orientation. This method suffers from residual intraframe motion and data loss when motion is large because a minimum frame duration is often required. The EBE method, previously implemented for a human brain scanner and adapted for a small-animal PET scanner in this work, eliminates intraframe motion and should have a best accuracy. We first evaluated the accuracy of both motion-correction methods with moving phantom scans. Both motion-correction methods were then applied to awake NHP brain PET studies with a gamma-aminobutyric acid A-benzodiazepine receptor ligand, 11C-flumazenil, and the reconstructed images were compared with those from a motion-free anesthetized study. Results: The phantom studies showed that EBE motion correction recovers the contrast (within 3%) similarly to the static study, whereas MAF motion correction using the standard algorithm setting showed a 25% reduction in contrast from the static case. In awake NHP brain PET imaging, EBE motion correction better recovers the fine structures than the MAF method, as compared with anesthetized studies. Conclusion: The large magnitude and frequency of NHP head motion suggests that EBE motion correction with accurate externally measured motion data can noticeably alleviate image blurring due to the intraframe motion in the MAF motion-correction method.
PET imaging of nonhuman primates (NHPs) is an important approach in understanding brain function and in evaluating the mechanisms of action of pharmacologic agents (1,2). Most NHP brain PET studies are conducted under anesthesia for obvious practical reasons including the elimination of head motion. With a high-resolution animal scanner, researchers can accurately measure the activity in small brain regions in NHPs in the anesthetized state. However, anesthesia has been shown to have significant effects on PET metabolic and receptor binding measures (3,4). If scanned awake and unrestrained, head motion would cause image blurring and inaccurate activity quantification. Alternatively, head fixation has been used in a few centers (5,6). This method is likely to create stress in the subjects (7) and requires extensive acclimation and training. Therefore, motion correction is essential to remove image blurring in awake NHP brain PET studies.
Various motion-correction methods have been proposed and applied in PET. Picard and Thompson (8) proposed a multiple-acquisition frame (MAF) method, in which a new acquisition frame is started when the motion exceeds a threshold. This method has been implemented for small-animal (9) and NHP PET imaging (10). However, the high speed and frequency of NHP head motion may introduce undesirable image blurring due to the intraframe motion, uncorrected by the MAF method. In theory, event-by-event (EBE) motion correction has the potential for the highest accuracy, because each event is relocated to the line of response (LOR) where it belongs. This method has been developed in the motion-compensation ordered-subset expectation maximization (OSEM) list-mode algorithm for resolution-recovery reconstruction (MOLAR) (11) for the HRRT (12) and the biograph mCT (13).
The goal of this study was to develop and evaluate the accuracy of both MAF and EBE motion-correction methods for awake NHP PET imaging on the small-animal PET FOCUS-220 (Siemens Medical Solutions). Motion data were acquired using the Vicra system (NDI) with a time-synchronization technique to align the PET and the motion data. For the MAF method, the raw list-mode data are divided into subframes based on an intraframe motion threshold (IFMT) and a minimum-frame-duration threshold (MFDT). For EBE motion correction, we adapted the MOLAR algorithm for the FOCUS-220. The modified version retains the theoretic framework of MOLAR, with major adjustments to accommodate the scanner geometry and normalization procedure. The accuracy of both motion-correction algorithms was first validated with moving phantoms and was then applied to awake NHP PET studies.
MATERIALS AND METHODS
Small-Animal PET FOCUS-220 Scanner
The small-animal PET FOCUS-220 (14) is a high-resolution PET scanner for imaging NHP and small animals. It consists of 168 detector blocks, each of which is divided into 12 × 12 lutetium oxyorthosilicate crystals, which measure 1.51 × 1.51 × 10 mm. The axial field of view (FOV) is 7.6 cm, and the transverse FOV is 19 cm. Scan data are acquired in list-mode as 48-bit binary data packets.
Motion Tracking
Subject motion was recorded with a Vicra optical tracking system controlled by a dedicated PC (Vicra PC). The Vicra uses infrared illuminators and stereo cameras to sense 3-dimensional positions of reflective spheres, which are mounted on a head tool. Multiple tools can be tracked simultaneously at 20 Hz. Tool position and orientation can be calculated relative to the Vicra’s internal coordinate system. To allow motion data to be independent of possible Vicra sensor vibration or movement, a reference tool is permanently attached to the scanner’s frame. A 1-time calibration establishes the relationship between the scanner and reference tool coordinate systems (15). Using the measured reference tool to scanner relationship, post processing software calculates head tool motion relative to the scanner coordinate system. Ultimately, a set of time-stamped affine transformation matrices are calculated and used to correct PET event data back to some strategically selected reference location.
Time Synchronization Between PET Data and Motion Data
Precise synchronization of the motion data to the PET list-mode data is necessary, because awake NHP subjects exhibit frequent and rapid head movements. To synchronize the 2 data streams, a time injection algorithm was developed that periodically encodes and sends the absolute clock time of the Vicra PC into the PET list-mode data stream via a scanner physiologic gating input. The algorithm and a validation scan are provided in the supplemental data (supplemental materials are available at http://jnm.snmjournals.org).
MAF-Based Motion Correction
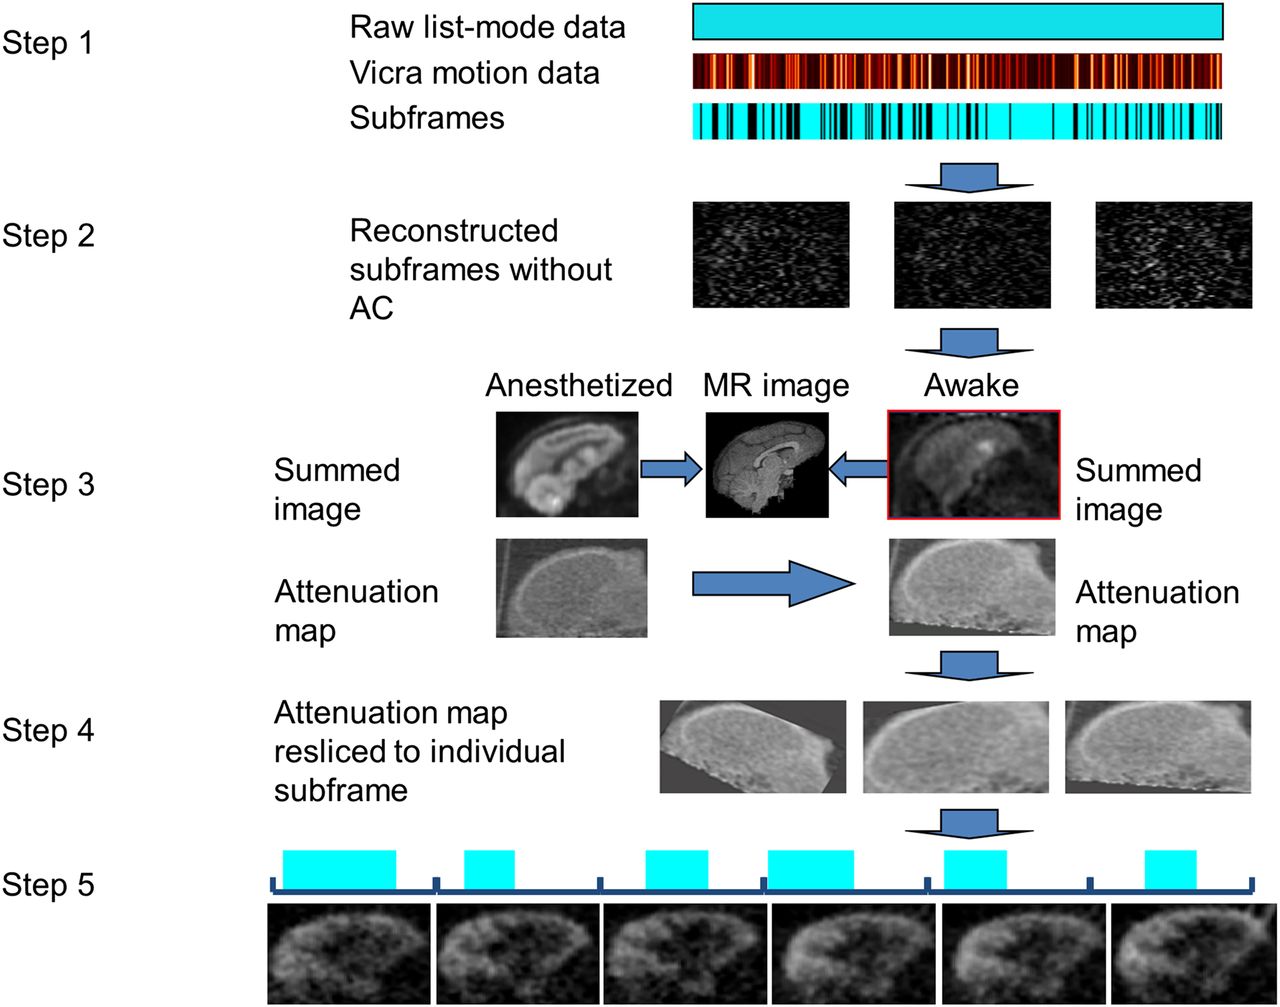
The MAF method is summarized in Figure 1. First, the list-mode data were divided into subframes based on the measured motion (step 1), using an IFMT of, for example, 1 or 2 mm such that a new subframe begins when the motion magnitude, M, exceeds the IFMT. To calculate M, 8 points were selected as the vertices of a virtual rectangular box (10 × 10 × 6 cm) centered in the scanner FOV, and the motion magnitude, m, for each point is calculated using Equation 1. Eq. 1 For each point, its transformed position is calculated using the motion-transformation matrix at 20 Hz, and the SD of the resulting x, y, and y coordinates are σx, σy, and σz. This definition of m was chosen because, if the subject stays at one location for the first half of the frame and moves a distance, m, away for the second half, the motion magnitude within this frame is m. Within each subframe, the average motion of the 8 points is M, which is continuously updated for each new motion data to determine whether the IFMT has been exceeded.

Steps in MAF-based motion-correction method. Raw list-mode data are divided into subframes (step 1). Durations of subframes are 8.6 ± 8.7 s for 5 awake NHP studies. Each subframe is reconstructed using FBP with ramp filter at Nyquist frequency, without attenuation or scatter corrections (step 2). Transmission image of same subject from anesthetized study is resliced to awake reference orientation (step 3). Transmission image is resliced to orientation of each subframe (step 4). Each subframe is rereconstructed with attenuation and scatter corrections (step 5). Finally, subframe images are transformed to reference orientation and grouped to 5-min frames. AC = attenuation correction.
In addition, an MFDT of, for example, 2–4 s, is set to limit the computation demands of the algorithm. Specifically, when the intraframe motion of a subframe exceeds the IFMT, the duration of the subframe is compared with the MFDT. The subframe is kept if the frame duration exceeds the MFDT. Otherwise, the subframe is discarded. This results in loss of data when the subject moves rapidly within short intervals.
Each subframe is reconstructed using filtered back projection (FBP) with a ramp filter with cutoff at the Nyquist frequency (step 2). This first reconstruction includes normalization, randoms, and decay correction but ignores attenuation and scatter corrections, because an attenuation image at the orientation of this subframe is not available at this point. Next, the reconstructed image of each subframe is transformed to a reference orientation by the average motion data within that subframe (step 3). The average transformation matrix for each subframe is computed by averaging the quaternion components of all the transformation matrices with equal weight within the subframe. These images are summed together, and the transmission image of the same subject from an anesthetized study is mapped into the awake reference orientation by registering summed emission images of the anesthetized and awake studies to the MR image (10). The transmission image is then resliced to the orientation of each subframe with the inverse of the transformation matrices from step 2 (step 4). Each subframe is then rereconstructed with attenuation and scatter corrections and transformed to the reference orientation. Adjacent subframes are regrouped into 5-min frames by summing the subframe images, weighted by their durations (step 5). The effective frame duration of each grouped frame is the sum of the subframe durations, and the effective frame mid time is the weighted average of the subframes mid times. Finally, all grouped images are decay-corrected to the injection time for quantitative analyses.
EBE Motion Correction
List-mode reconstruction with EBE motion correction was performed with MOLAR, an Ordinary Poisson (OP)-OSEM algorithm: Eq. 2Each time frame of duration T (s) is divided into nT subbins of duration Δt in seconds. k represents the index of each detected event, ik represents the LOR index of event k, and tk represents the time stamp for event k. ci,t,j, the system matrix, represents the contribution of voxel j to LOR i in time bin t, accounting for geometry, resolution, solid angle, and motion effects. A spatially invariant gaussian point-spread function (PSF) of 1.5 mm in full width at half maximum was used. Li,t is the dimensionless product of decay factor at time t, live time at time t, and positron branching fraction. Ai,t is the dimensionless attenuation factor. Ni is a sensitivity (normalization) factor, in units of (counts/s)/(Bq/mL × mm), which converts the forward projection through the image grid λ (Bq/mL) to units of counts/s. Normalization was performed with a component-based model that includes detector efficiencies, transaxial and axial geometric effects, detector interference effects, and parallax effects (16). Ri,t is the random coincidence rate in counts per second, estimated from the singles rates of the each detector pair. Si,t is the scattered coincidence rate in counts per second, estimated using the single scatter simulation model (17). When motion data are available, EBE motion correction transforms the locations of the endpoints of the LOR of each detected event to the reference position. Attenuation (A), scatter (S), and the system matrix (c) use the motion-corrected LOR, as denoted by the tilde sign (˜) in Equation 2. For example,
  represents the attenuation factor for the motion-corrected event k detected on LOR ik at time tk. The reference position motion correction is defined as the orientation of the head during the transmission scan. Therefore, motion correction maps each LOR back to where the head was during the transmission scan, thus correctly aligning the attenuation map to the emission scan. In this way, no special processing of transmission data is required. Scatter is estimated iteratively during the iteration process based on the image at that iteration/subset. Every event is motion-corrected before the scatter estimation step. Therefore, scatter estimation uses all the motion-corrected events. A sensitivity image Q, in units of counts per second/(Bq/mL), is calculated uniquely for each frame. In principle, the summation in Equation 2 occurs over all LORs i over all time periods t in the time frame. In MOLAR, Q is approximated by a random and unique sampling of LORs for each reconstruction, to avoid the calculation for all possible LORs, while accounting for the unique motion in each frame by repositioning the randomly sampled LORs (15). The final image sensitivity values are scaled to correct for the undersampling.
The list-mode data were divided into 30 subsets, with subsets defined on the basis of the order of arrival of each event. Images were reconstructed for 4 iterations for the phantom studies and 2 iterations for the awake NHP studies to control noise in the low-count NHP studies. The initial value of λ is uniform (8,500 Bq/mL) within the attenuating object and 0 outside it.
Moving Phantom Scan
To validate the motion-correction algorithm, a moving mini-Derenzo phantom (Data Spectrum) was scanned and reconstructed with each motion-correction algorithm. The diameters of the rod structures in the phantom were 1.2, 1.6, 2.4, 3.2, 4.0, and 4.8 mm. The phantom was filled with 37 MBq of 18F-FDG and was positioned at 4 cm off the center of the transaxial FOV. A transmission scan was first obtained to generate an attenuation map. A 5-min static scan was acquired, followed by a 5-min dynamic scan, in which the phantom was moved manually. Reflective markers were attached to the phantom, and motion data were recorded by the Vicra system. The motion magnitude was calculated by dividing the scan data into 1-s subframes and calculating the displacement within each second. In this moving-phantom scan, the average speed of motion was 1.4 mm/s, and the motion magnitude in the entire scan was 48.2 mm, moderately larger than that of an NHP head motion in an awake study.
Awake NHP Brain Scans
Studies were performed in rhesus monkeys under a protocol approved by the Yale Institutional Animal Care and Use Committee. Awake rhesus monkeys were scanned in the FOCUS-220 fitted with a lifter-tilter (Agile Technologies) (Supplemental Fig. 4), a mechanical device that lifts and rotates the scanner. The monkeys were trained to sit in a custom chair and tilted back approximately 35°, such that the long axis of their brain was centered in the scanner’s axial FOV when the scanner was tilted forward approximately 45°. Initial studies were performed using a bolus–infusion administration of 252 MBq of the gamma-aminobutyric acid A-benzodiazepine ligand 11C-flumazenil. List-mode data were acquired beginning 30 min after injection for 30 min. The motion-tracking tool was mounted onto a silicon rubber plug, which was adhered to the scalp via skin glue. The median speeds of motion for the awake NHP studies ranged from 1.0 to 2.4 mm/s across studies. For list-mode reconstruction with MOLAR, one 30-min frame was reconstructed. The equivalent motion magnitude M during the 30-min scan was 34 ± 6 mm for the 5 awake NHP studies. All PET images were registered to an NHP template via a linear transformation from the PET to the MR image space for the same monkey and a nonlinear transformation from the MR space to the NHP template.
For a 30-min awake NHP study of 30 M events, the MAF method involves reconstructing approximately 100 subframes twice, before and after processing of the subframes. The total computation time is approximately 10 h (CPU speed, 3.0 GHz). The EBE method based on the MOLAR platform takes approximately 6 h (~1 h for each 5-min frame) on 16 cluster nodes (CPU speed, 3,200 MHz).
RESULTS
Mini-Derenzo Phantom Scan
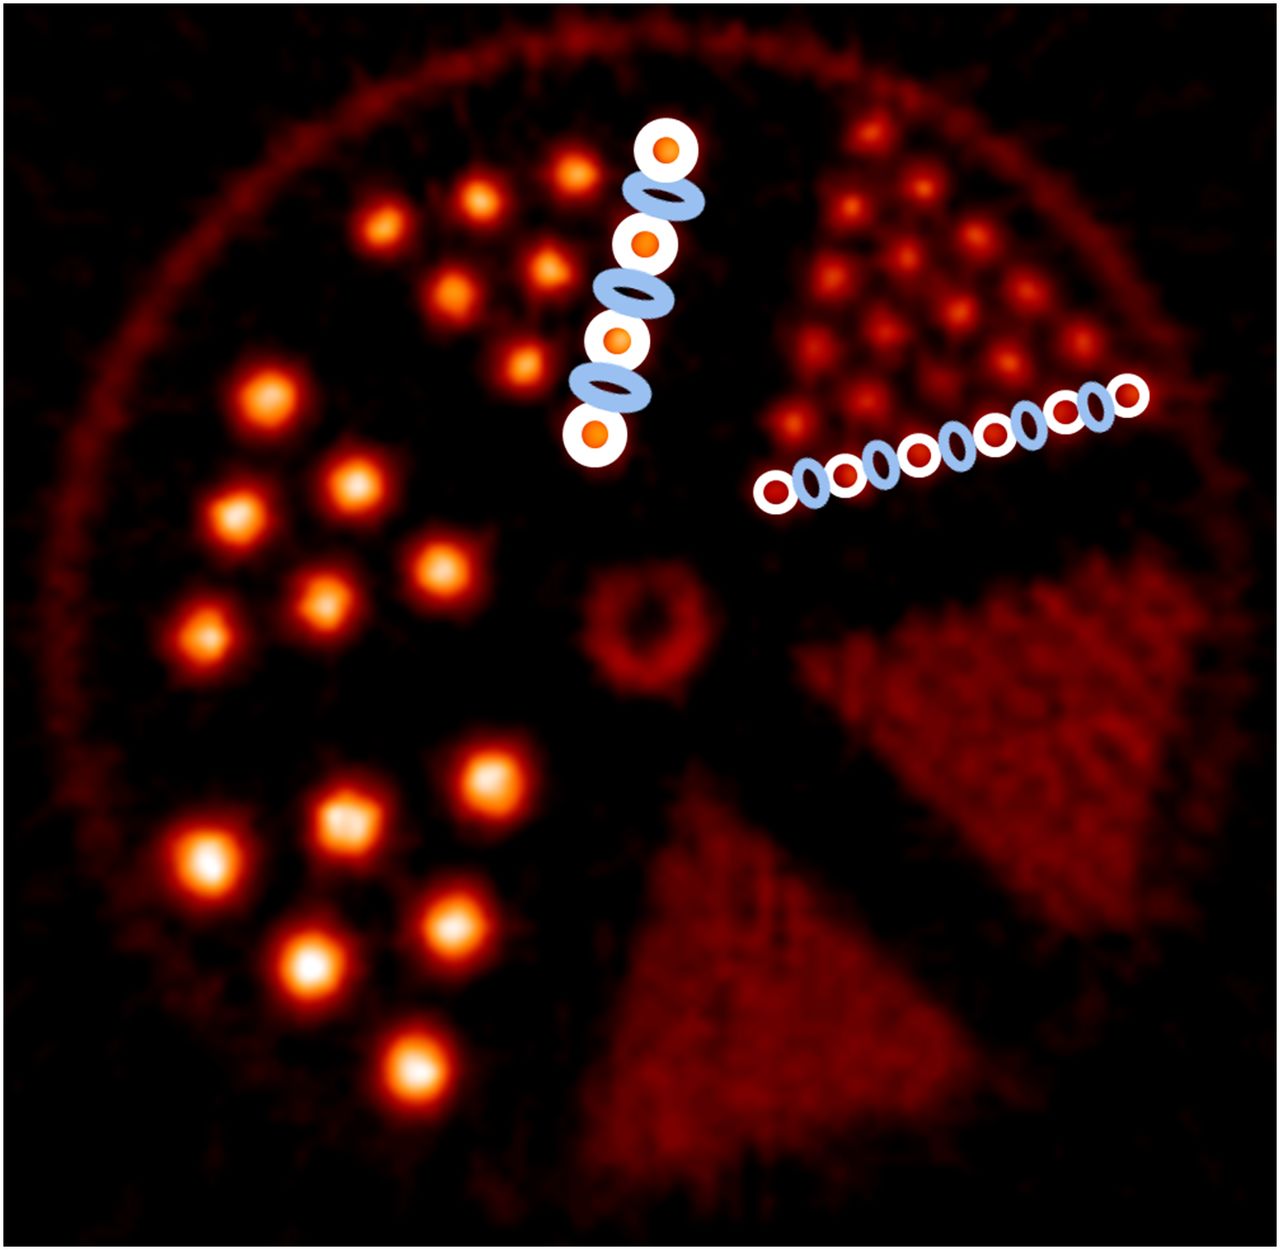
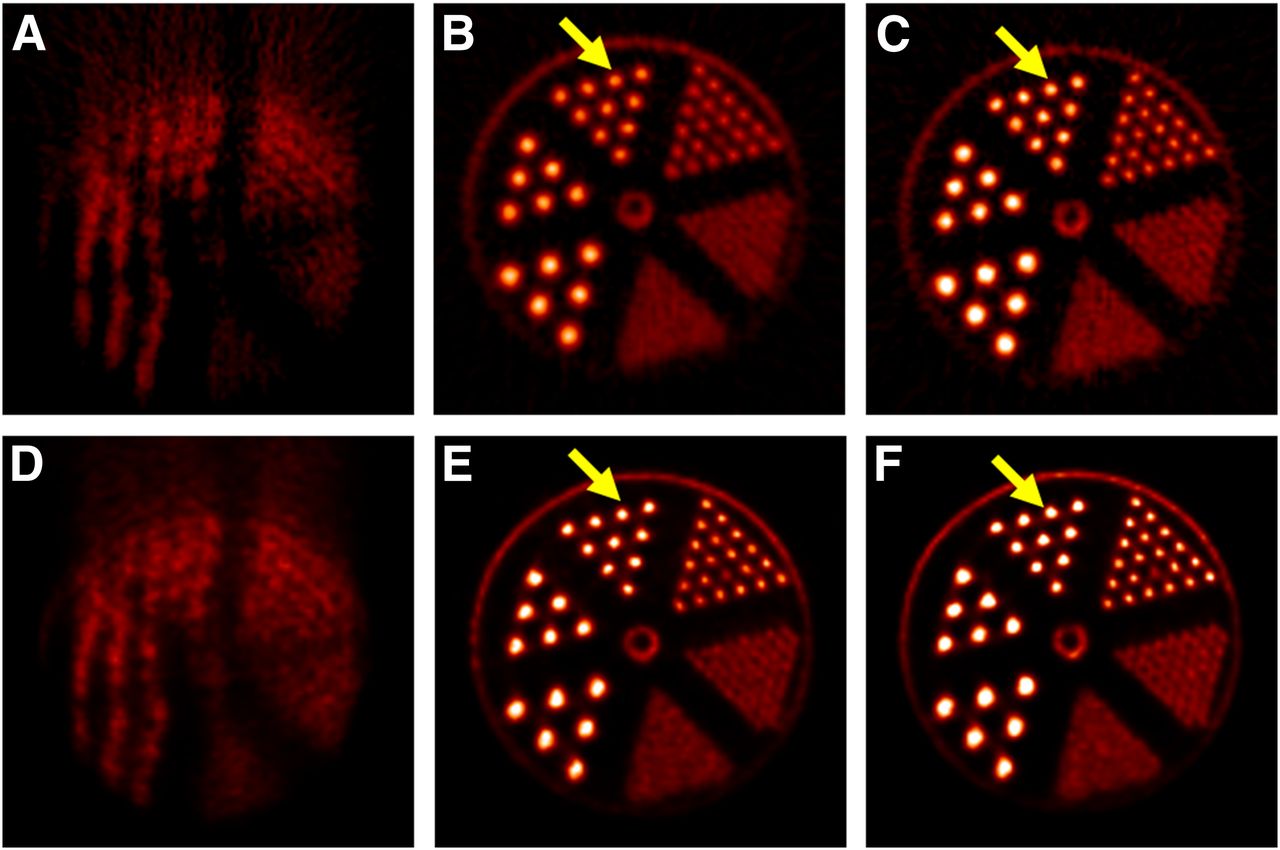
Figure 2 shows the reconstructed images of the static and the moving mini-Derenzo phantom using both motion-correction methods with time synchronization between the scan data and the motion data. All images are displayed in the transaxial view, and the image intensities are displayed to a global scale. In this implementation, with the phantom positioned 4 cm off center, the 1.6-mm rods were not clearly resolvable with OP-OSEM, even for static scans using 4 iterations and 30 subsets. These rods can be resolved by additional iterations (10) when the phantom is positioned at the center of the FOV (data not shown). MAF motion correction, which is shown in Figure 2B, with 1-mm IFMT and 3-s MFDT corrects most of the motion, as compared with Figure 2A. However, this frame division setting keeps only 31% of the events. Residual intraframe motion causes slight blurring of the rod structures and reduced intensities in the rods (arrows), as compared with Figure 2C, in which the same FBP reconstruction algorithm was performed on a static scan with the same number of events as Figure 2B. EBE motion correction (Fig. 2E) used all of the counts and gave image quality comparable to the static scan (Fig. 2F).

Reconstructed images of moving mini-Derenzo phantom study (left and center columns) and static mini-Derenzo phantom study (right column). Top row shows reconstructed images using FBP for moving phantom without motion correction (A), with MAF motion correction (IMFT = 1 mm, MDFT = 3 s) (B), and static phantom with same total counts (C). Bottom row shows reconstructed images using MOLAR for moving phantom without motion correction (D), with EBE motion correction (E), and static phantom with same total counts (F). All images are displayed in transaxial view, with image intensities displayed to global scale. As denoted by arrows, rod structures are blurred in B, compared with C, due to residual intraframe motion of MAF method. For EBE, rod structures in E give intensity levels comparable to F.
The contrast recovery coefficient (CRC), here defined as (hot − cold)/hot, was used to examine the image resolution of the mini-Derenzo phantom. As shown in Figure 3, regions of interest (ROIs) were defined on Figure 2C. The hot ROIs were defined on the 2.4- and the 3.2-mm diameter rods. For the 2.4-mm-group, each hot rod contains 5 pixels of 0.95 × 0.95 mm. The elliptic cold ROIs, defined in the space between the hot ROIs, contain 4 pixels each. For the 3.2-mm-diameter rods, each hot rod contains 9 pixels, and each cold ROI contains 8 pixels. The intensity of the hot and the cold region was the average intensity within the hot and the cold regions, respectively. The CRC was calculated from the images on Figures 2B, 2C, 2E, and 2F and is shown in Table 1. For the 3.2-mm group, the CRC for the MAF method using 1-mm IMFT (Fig. 2B) was 0.77. For the static phantom (Fig. 2C), the CRC for the image reconstructed with FBP was 0.84, 9% higher than MAF using 1-mm IFMT, due to the intraframe motion. The CRC for EBE motion correction (Fig. 2E) was 0.85, within 3% from the CRC for the static phantom reconstructed with MOLAR (0.87) (Fig. 2F). Figure 2F gives higher CRC than Figure 2C because of the resolution recovery PSF in MOLAR. The slight improvement in CRC between Figures 2E and 2F is likely due to the uncertainty in the motion data (see the “Discussion” section). For 2-mm IFMT, the CRC for the 3.2-mm rods was 0.63, a 25% reduction from the static case. For 3-mm IFMT, the CRC dropped by 38% from the static case. A similar trend was observed for the 2.4-mm rods. Varying the MFDT did not affect the CRC values, as expected, because the MFDT affects image noise instead of resolution.
CRC calculation on mini-Derenzo phantom. Each hot ROI contained 5 pixels of 0.95 × 0.95 mm for 2.4-mm rods and 9 pixels for 3.2-mm rods, and each cold ROI contained 4 pixels for 2.4-mm rods and 5 pixels for 3.2-mm rods. CRC was calculated on Figures 2B, 2C, 2E, and 2F.
CRC for Different Motion-Correction Methods
Awake NHP Studies
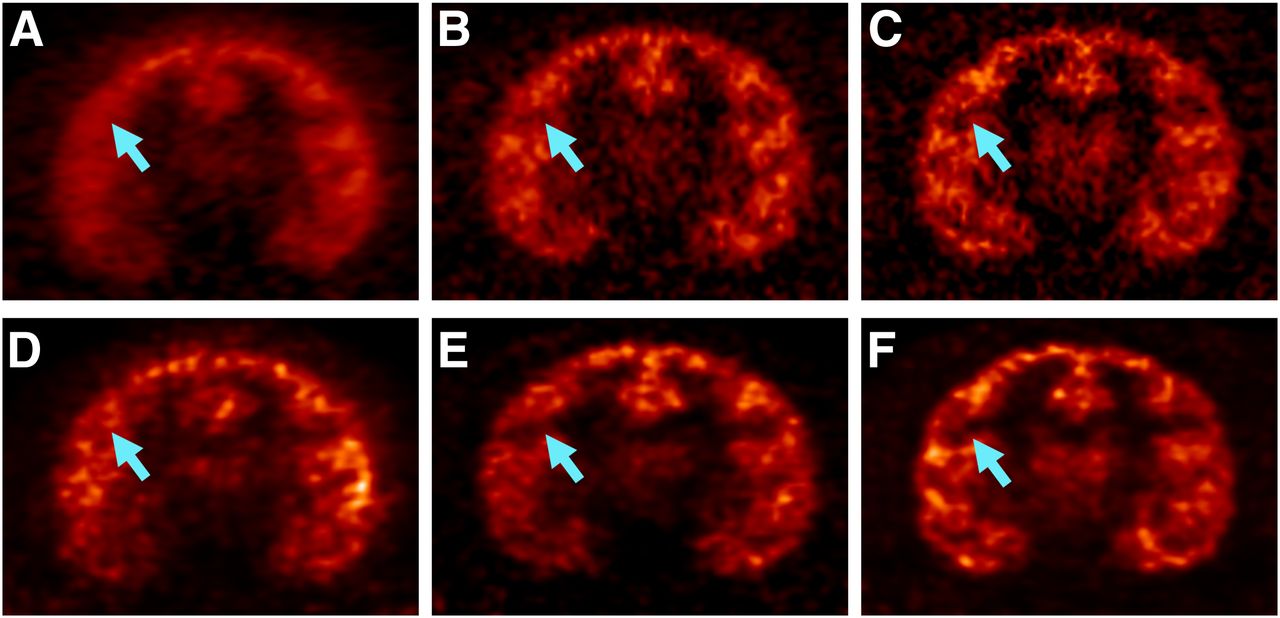
Figure 4 shows the reconstructed images of an awake (left and center columns) and an anesthetized NHP study (right column) in the same animal. The motion magnitude for the awake study was 1.3 mm/s. The top row shows the images reconstructed using FBP with a ramp filter at Nyquist frequency, and the bottom row shows the respective images reconstructed with MOLAR in the same study as the top row. Without motion correction (Figs. 4A and 4D), substantial blurring is observed. MAF motion correction (Fig. 4B) was able to correct for most of the motion, although some blurring is present in the fine cortical regions (arrows) when compared with an anesthetized scan of the same counts reconstructed with the same algorithm (Fig. 4C). MAF included 2-mm intraframe motion with 3-s MFDT, which retained 57% of the data. The subframe durations are 8.6 ± 8.8 s for 5 awake NHP studies using this setting. EBE motion correction (Fig. 4E) gave contrast comparable to the anesthetized study (Fig. 4F) in the fine cortical regions indicated by the arrow. For MAF (Fig. 4B), some blurring was observed in the same cortical regions when compared with the anesthetized study (Fig. 4C). The noise level for EBE was improved over MAF because no counts were discarded for the EBE method.

NHP images for awake study (A, B, D, and E) (11C-flumazenil, with data taken from 30 to 60 min after injection) and anesthetized study (C and F) using same tracer, with comparable counts in same animal. Top row shows images reconstructed with FBP of awake study without motion correction (A), with MAF motion correction (B), and anesthetized study (C). Bottom row shows images reconstructed with MOLAR of awake study without motion correction (D), with EBE motion correction (E), and anesthetized study (F). All images were registered to NHP template and are displayed on common scale. As indicated by arrows, contrasts of cortical structures are comparable in E and F, whereas some blurring is observed in B, compared with C, due to residual intraframe motion of MAF method.
DISCUSSION
In this study, we designed and evaluated the quality of MAF and EBE motion-correction methods for awake NHP studies on the FOCUS-220. The image resolution of MAF depends on the residual motion allowed within each subframe. A low IFMT reduces residual motion, at the price of low statistics in each subframe. Also, the images from the subframes are transformed to a reference orientation, which may create additional image blurring due to interpolation of image pixels. In comparison, EBE motion correction uses all the counts without introducing image blurring caused by intraframe motion. Compared with another EBE algorithm based on LOR rebinning (18), in MOLAR, the coordinates of each motion-corrected LOR are used in the reconstruction without binning into sinogram bins, eliminating the loss of resolution due to the LOR rebinning.
The speed of motion is substantially higher in awake, unrestrained NHP head studies than in human brain imaging. The head motion of more than 500 human brain studies (healthy controls and numerous patient populations), scanned on the human brain PET scanner HRRT, was also tracked with the Vicra camera. The fraction of instantaneous velocity of the head that is greater than 1 mm/s is approximately 0.8% in human studies, compared with approximately 16% in the 5 awake NHP brain studies. For instantaneous velocity greater than 5 mm/s, the fraction is approximately 0.02% in human studies, compared with approximately 2.3% in awake NHP brain imaging. In addition, the system resolution of the FOCUS-220 is 1.5 mm, better than the resolution of the HRRT (2.5 mm or higher). Therefore, whereas the MAF motion correction may be suitable for human brain PET imaging (8,19,20), EBE motion correction is superior in high-resolution brain PET imaging of awake NHPs.
In MAF, the IFMT defines the permitted intraframe motion, and the MFDT controls the computation time by avoiding too many short subframes. The relationship between these 2 parameters and the fraction of data retained is shown in Table 2, based on 5 awake NHP studies. Little data are kept if the IFMT is less than 1 mm, due to the intrinsic uncertainty (∼0.4 mm root mean square [RMS]) of the Vicra system. Reducing the MFDT retains more counts but is computationally expensive. In a typical awake NHP study, reducing the MFDT from 4 to 2 s increases the number of subframes from 76 to 133 for a 30-min acquisition. To balance the trade-off between resolution and noise, the default setting was 2-mm IFMT and 3-s MFDT. Note that loss of counts may be acceptable in preclinical studies, if the injected dose can be increased.
Percentage of Count Data Retained for MAF Method
For MAF motion correction, the subframes were reconstructed with FBP to avoid possible low-count bias in the OSEM algorithm (21,22). If no scan data were discarded, the MAF method would generate approximately 1,700 subframes for a 30-min study. The average subframe duration would be approximately 1 s. In the awake NHP studies, the average counting rate was approximately 40,000/s. As such, 59% of the subframes would be shorter than 0.25 s and have less than 10,000 events, which is in the range of low-count bias in OSEM reconstructions (23). The choice of the reconstruction algorithm also affected the image resolution for MAF, in addition to intraframe motion. This is because no spatial resolution recovery kernel is applied in the FBP reconstruction, whereas the MOLAR OSEM reconstruction uses a resolution recovering PSF. This can be seen in Figure 2, in which the static phantom reconstructed with FBP (Fig. 2C) has lower CRC than MOLAR (Fig. 2F).
In our implementation of the MAF method, a new frame was started when the intraframe motion exceeds a threshold M. More ideally, the criteria to start a new subframe might include a threshold for large step motion, which indicates the start of a new subframe. To calculate the motion transformation matrix for each subframe, we averaged the rotational components of the transformation by calculating the mean of the quaternion angles and took the arithmetic mean of the translational components. An alternative procedure has been reported to estimate the average transformation matrix using Karcher’s weighted-mean transformation (24).
In the awake NHP scans, we affixed the reflective markers to a rigid tool, which was mounted onto a silicon rubber plug and adhered to the scalp via skin glue. We have observed cases where the reflective markers move on the loose skin of the NHP head. It is therefore necessary to avoid the forehead of the NHP when affixing the marker tool. Attaching the head tool to the rear of the NHP head may move the markers outside the FOV of the Vicra camera, resulting in missing motion data. In practice, using the lifter-tilter, we positioned the scanner such that the subject head was well centered in the scanner FOV and adjusted the angle of the Vicra camera to include the largest possible range of detection. In this way, missing motion data were reduced to 0.1% in 4 studies.
Accurate time synchronization between the motion data and the scan data is necessary due to the high-speed head motion of NHPs. Given the 1.5-mm intrinsic resolution of the FOCUS-220, 1 mm of motion may introduce noticeable image blurring. Our time-synchronization method can reduce the temporal uncertainty in the motion data to 17 ms. To generate 1 mm of image blurring, the subject would need to move 60 mm/s. In our awake NHP studies, the top speed (95th percentile) of motion ranged from 12 to 23 mm/s, substantially below the 60 mm/s threshold for noticeable resolution degradation. Therefore, an uncertainty of 17 ms in time should not affect the image resolution in this study.
Degradation in the spatial resolution was observed when the mini-Derenzo phantom was scanned at 4 cm off the center of the transaxial FOV in Figure 2. The resolution degradation occurs primarily in the radial direction because of the uncertainty in the depth of interaction of the γ photons with the detector crystals. In Figure 2F, the largest (4.8 mm) rod became elliptic with the long axis in the radial direction. The effect of resolution degradation is more substantial in awake NHP PET imaging than human brain imaging, both because of larger motion and the reduced FOV of the FOCUS-220, compared with human brain PET scanners. This effect may be alleviated with a spatially dependent resolution model. A probability density function model that is particularly suited for list-mode reconstruction has been proposed by Yao et al. (25). Initial implementation of the spatially dependent resolution model for the FOCUS-220 has been performed, and additional validation is under way.
A quantitative assessment of the image quality would be helpful in comparing images to a reference image. In this work, 2 anesthetized images (FBP and OSEM) were used as reference images. However, the noise properties of FBP and OSEM images differ, making a numeric comparison difficult. A quantitative assessment to 1 reference image would enable a more definitive comparison, which will be our future work.
CONCLUSION
In this study, both MAF and EBE motion-correction methods for awake NHP brain PET imaging were developed and evaluated. Moving-phantom scans and awake NHP brain PET studies demonstrated that EBE motion correction can reduce image blurring caused by residual intraframe motion in MAF. MAF discards a substantial amount of scan data, due to the rapid motion of the subject, based on the selection of a minimum subframe duration. This process leads to lower statistics than the EBE method. Future work will focus on the validation of a spatially variant resolution model to achieve uniform resolution throughout the FOV.
DISCLOSURE
The costs of publication of this article were defrayed in part by the payment of page charges. Therefore, and solely to indicate this fact, this article is hereby marked “advertisement” in accordance with 18 USC section 1734. This work was supported by Grant Number R01NS058360 from the National Institute of Neurological Disorders and Stroke. This publication was also made possible by CTSA Grant Number UL1 RR024139 from the National Center for Research Resources (NCRR) and the National Center for Advancing Translational Science (NCATS), components of the National Institutes of Health (NIH), and NIH roadmap for Medical Research. Its contents are solely the responsibility of the authors and do not necessarily represent the official view of NIH. No other potential conflict of interest relevant to this article was reported.
Acknowledgments
We thank the NHP team at the Yale-PET center and the laboratory of Drs. Graham Williams and Stacy Castner for performing the awake NHP studies that formed the basis of this work. We also thank Zhongdong Sun for programming support.
Footnotes
Published online Jan. 16, 2014.
- © 2014 by the Society of Nuclear Medicine and Molecular Imaging, Inc.
REFERENCES
- Received for publication March 17, 2013.
- Accepted for publication October 10, 2013.


