


Abstract
This feasibility study was undertaken to determine whether myocardial blood flow (MBF, mL/g/min) could be quantified noninvasively in small rodents using microPET and 15O-water or 1-11C-acetate. Methods: MBF was measured in 18 healthy rats using PET and 15O-water (MBF-W) under different interventions and compared with direct measurements obtained with microspheres (MBF-M). Subsequently, MBF was estimated in 24 rats at rest using 1-11C-acetate (MBF-Ace) and compared with measurements obtained with 15O-water. Using factor analysis, images were processed to obtain 1 blood and 1 myocardial time–activity curve per tracer per study. MBF-W was calculated using a well-validated 1-compartment kinetic model. MBF-Ace was estimated using a simple 1-compartment model to estimate net tracer uptake, K1 (K1 (mL/g/min) = MBF·E; E = first-pass myocardial extraction of 1-11C-acetate) and washout (k2 (min−1)) along with FBM (spillover correction) after fixing FMM (partial-volume correction) to values obtained from 15O-water modeling. K1 values were converted to MBF values using a first-pass myocardial extraction/flow relationship measured in rats (E = 1.0−0.74·exp(−1.13/MBF)). Results: In the first study, MBF-W correlated well with MBF-M (y = 0.74x + 0.96; n = 18, r = 0.91, P < 0.0001). However, the slope was different than unity, P < 0.05). Refitting of the data after forcing the intercept to be zero resulted in a nonbias correlation between MBF-W and MBF-M (y = 0.95x + 0.0; n = 18, r = 0.86, P < 0.0001) demonstrating that the underestimation of the slope could be attributed to the overestimation of MBF-W for 2 MBF-M values lower than 1.50 mL/g/min. In the second study, MBF-Ace values correlated well with MBF-W with no underestimation of MBF (y = 0.91x + 0.35; n = 24, r = 0.87, P < 0.0001). Conclusion: MBF can be quantified by PET using 15O-water or 1-11C-acetate in healthy rats. Future studies are needed to determine the accuracy of the methods in low-flow states and to develop an approach for a partial-volume correction when 1-11C-acetate is used.
The first stage in applying small-animal PET to study of rodent cardiac disease models is the validation of the techniques and methods of analysis used. Small-animal PET, now firmly established as an important tool for the imaging scientist, does suffer from certain limitations. Partial-volume and spillover effects due to the relatively poor intrinsic resolution of the cameras relative to the small size of the rodent heart, as well as motion artifacts, can hinder the ability to quantify cardiac PET data in rodents.
Accurate measurements of myocardial perfusion are central to the study of cardiac physiology and metabolism. Determination of cardiac metabolism requires the accurate measurement of myocardial blood flow (MBF, mL/g/min). Small-animal PET has been used for the sequential measurements of cardiac metabolic rates in the same animal (1–3). However, accurate determination of myocardial perfusion can be seriously hindered by the limitations described. The current study was undertaken to investigate whether noninvasive measurements of MBF in the rat heart could be obtained using 2 different perfusion tracers, 15O-water and 1-11C-acetate, in conjunction with small-animal PET and kinetic modeling.
Because the decay characteristics of 15O degrade image quality (4), it is not clear whether the use 15O-water in the small-animal PET camera (microPET) would result in sufficient resolution for the quantification of MBF. The first aim of this study was to investigate whether MBF could be quantified in rats using microPET and 15O-water by comparing 15O-water MBF values obtained over a wide range of physiologic flows with those measured directly with radioactive microspheres in an open-chest model. As many metabolic cardiac studies involve the use of 1-11C-acetate to measure both myocardial oxygen consumption (5–10) and perfusion (8–11), the second aim of this study was to investigate whether measurements of MBF using 1-11C-acetate are comparable to those obtained with 15O-water so that measurements of MBF and myocardial oxygen consumption (MVO2) could potentially be done using the same tracer. No direct measurements of perfusion were done for the second aim as it would be challenging to keep the animals alive for 2 microsphere injections with an open-heart model.
MATERIALS AND METHODS
Materials and Equipment
Unless stated otherwise, all chemicals were purchased from Aldrich Chemical Co., Inc. 15O-Water (12–15) was synthesized accordingly to published methods. 1-11C-Acetate is produced routinely in our laboratory with a commercially available acetate module (CTI). Radioactive samples were counted on a Beckman 8000 γ-counter. All small-animal PET was performed on the microPET-R4 camera (16) (Concorde Microsystems Inc.) housed in a temperature-controlled imaging suite.
Animal Protocols
All animal experiments were conducted in compliance with the Guidelines for the Care and Use of Research Animals established by Washington University's Animal Studies Committee. Optimal animal handling methods for small-animal PET have been studied extensively by our group and have been reported elsewhere (17). Before imaging studies, rats were placed in metabolism cages and fasted from food for 6 h with water being given ad libitum. On each study day the rodents were anesthetized with 2%–2.5% isoflurane-inhaled anesthesia via an induction chamber. Maintenance anesthesia throughout the procedure consisted of 1%–1.5% isoflurane via a custom designed nose cone. The rodent's neck was shaved and scrubbed in preparation for a sterile cutdown procedure. A 1- to 1.5-cm incision was made over the right jugular vein. The vein was exposed and ligated, and a microrenathane catheter (0.025 outer diameter × 0.012 inner diameter) was sutured in place. The rodent was globally heparinized (10 mg/kg) to prevent the catheter from clotting. Body temperature was maintained using a circulating water blanket as well as a heat lamp. Pediatric electrocardiograpy leads (Red Dot Infant Electrodes; M.M.M. Co.) were placed on the rodent's hind limbs to measure and record heart rate. The animal was secured in the custom-designed acrylic restraining device and placed within the PET scanner.
15O-Water Study
Eighteen healthy mature Sprague–Dawley rats (261.8 ± 81.3 g) were studied (Charles River Laboratories, Inc.) and prepared as described. Myocardial perfusion was measured with either 85Sr- or 46Sc-labeled microspheres (15 μm in 0.01% Tween; 74 kBq/dose [20 μCi/dose]) following published methods (18,19). An open-chest procedure was used for direct cardiac injection with a femoral arterial catheter for blood withdrawal. To generate a broad range of MBF, after preparation and before imaging, 2 of 18 rats were administered the β-blocker propranolol (1.0 mg/kg intravenously) to reduce MBF, 6 of 18 were given dobutamine (intravenously) to increase MBF, and the remaining rats (10/18) did not receive either intervention. Two minutes before 15O-water injection, a constant intravenous infusion of dobutamine (at a rate of 12.5 μg/kg/min) was given through a catheter placed in the femoral vein. This infusion rate was maintained until the time of euthanasia.
Measurement of MBF Using Microspheres
To measure MBF in the entire myocardium, immediately after the end of each 15O-water study, the animal was removed from the scanner, the thoracic cavity was opened, and 15-μm radioactive microspheres (85Sr or 46Sc) were injected as a bolus into the left ventricle (LV) cavity. Blood was withdrawn at a rate of 0.5 mL/min for 1 min (total blood volume, 1.0 mL) from a femoral catheter that was advanced into the descending aorta. This blood was counted in a Beckman 3000 well counter to obtain blood-to-tissue ratios necessary for conversion to mL/g/min. After a 2-min wait to account for the first pass of the microspheres throughout the circulation, the animal was euthanized, and the heart was excised from the chest cavity and cut from base to apex in 4 transverse slices. Heart samples were sectioned into 4 regions for counting (apex, midventricular, upper ventricular, and base of the heart). Both the syringe used for blood withdrawal and the femoral catheter used for delivery of microspheres were counted in a Beckman scintillation well counter to ensure that no significant counts were remaining. This step was necessary because of the small delivery volumes and blood sample sizes. Radioactivity (cpm/g) in each heart slice was counted in a γ-counter, averaged for the 4 slices, and then converted to mL/g/min using the microsphere reference method (18–21).
1-11C-Acetate Study
Another 24 healthy mature Sprague–Dawley rats (281.9 ± 60.1 g) were studied at rest using 1-11C-acetate and 15O-water.
PET Data Acquisition
In both studies, 30–40 MBq of 15O-water were administered as an intravenous bolus and dynamic PET data were acquired for 5 min (2 s × 15 frames, 3 s × 10 frames, 5 s × 12 frames, 10 s × 6 frames, 30 s × 4 frames). In the acetate study, 15O-water acquisition was followed by a bolus of 11–15 MBq of 1-11C-acetate and data were collected for 20 min (5 s × 24-frames, 15 s × 12-frames, 30 s × 10-frames, 60 s × 10-frames). During imaging of 1-11C-acetate, approximately 15 μL of venous whole blood was taken at 2, 5, 10, 15, and 20 min, resulting in a total volume of approximately 70–90 μL. These blood samples were used to measure the contribution of 11CO2 to the total blood radioactive counts (11CO2, %) (17).
Image Analysis
To define the kinetics of both blood (input function) (22) and myocardial tracer activity over time, time–activity curves (counts/pixel/min) were extracted from myocardial sequential PET images using factor analysis (FA) methods based on the methodology of Wu (23) and Di Paola (24), which has been previously validated for use in rodents (22,25). In brief, in nuclear medicine dynamic imaging, images are the result of overlapping activity concentrations from various organs or structures due to the limitation of scanner resolution. Factor analysis assumes a limited number of structures (or factors) in the dynamic images; each of these structures is characterized by a specified kinetics or function and extracts the “pure” (i.e., noncontaminated) factors. Each factor has a unique time–activity curve that depends on the kinetics of the tracer used. To extract pure blood and myocardial time–activity curves from the PET images using FA, it was assumed that PET heart images were composed of 3 factors: the LV, the right ventricle (RV), and the myocardium.
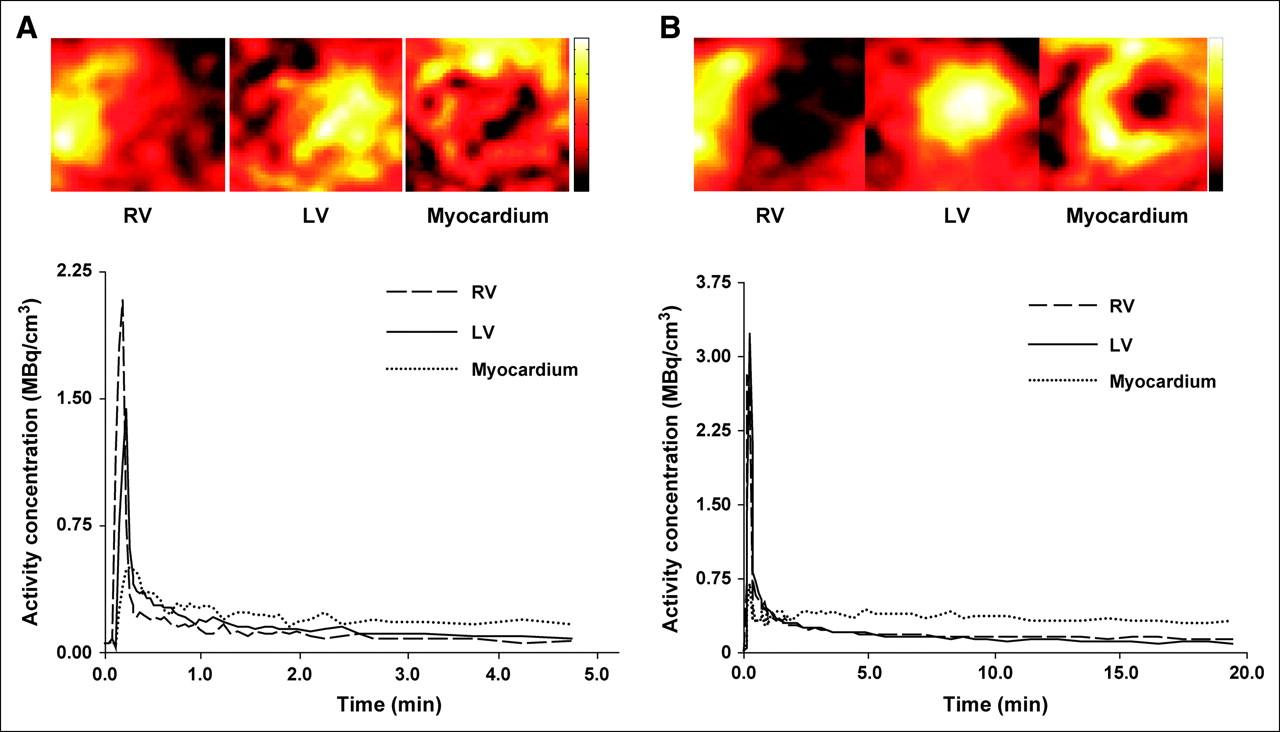
15O-Water and 1-11C-acetate myocardial and blood activity curves representing the first 2 min (for 15O-water) or 5 min (for 1-11C-acetate) of dynamic data after tracer injection were extracted from the PET images using FA (23) to extract the 3 factors (RV, LV, and myocardium) and their corresponding factor images. First, 4 or 5 myocardial midventricular transaxial slices were manually selected and added together. The heart was masked to minimize noise from outside the heart. Each time-dependent pixel in the masked images was normalized by the individual maximum value of each time-dependent pixel. Second, after image processing, a principal component analysis was performed. The covariance matrix, eigenvectors, and eigenvalues (loadings) of the normalized time-dependent pixels were calculated for the 3 structures. The third step was the determination of a new factor axis that corresponds to the best representation without negative components for the 3 structures describing the dynamic data. These axes were calculated from the set of loading values for which the triangle subtended by the combination of any 3 loading values, within the loading value space, leads to the maximum area. The normalized time–activity curves and the corresponding factor images were generated using these new factor axes. The final time–activity curves were then normalized by the linear interpolation between the maximum and minimum values in the original images. Finally, a constant given by the difference between the last data point of the FA blood input function and the last blood sample was added to LV and RV time–activity curves. The LV (input function) and myocardial factors generated for each animal were used in conjunction with kinetic modeling to estimate MBF. Because only one global myocardial time–activity curve was generated per animal, only global—not regional—MBF was measured. Factor images of the LV, RV, and myocardium and their corresponding factors obtained from PET cardiac images of 15O-water or 1-11C-acetate from rats studied at rest are shown in Figures 1A and 1B.

Factor images of LV, RV, and myocardium and their corresponding factors obtained from PET cardiac images of 15O-water (A) or 1-11C-acetate (B) from rats studied at rest.
Kinetic Modeling
15O-Water.
Myocardial perfusion using 15O-water was measured using a well-established 1-compartmental modeling approach that allows for noninvasive estimation of MBF as well as PET resolution correction factors (12–15). These PET factors are the tissue recovery coefficient, the fraction of true tracer activity observed in the myocardium (FMM); and the blood-to-tissue spillover fraction, the fraction of activity originating in the blood pool and observed in the myocardium (FBM). The unique advantages of this approach are that no a priori knowledge of cardiac dimensions is required and that, because these correction fractions are estimated along with the kinetics obtained from a moving heart, they incorporate the smearing effects of cardiac and respiratory motion.
For each animal, MBF, FMM, and FBM were estimated from the kinetic of 15O-water after assuming that the LV time–activity curve obtained from FA was the true input function (23) free of partial-volume and spillover effects.
1-11C-Acetate.
To obtain 1-11C-acetate blood activity (input function) from blood 11C activity measured from microPET imaging and FA, LV 11C activity was corrected for the presence of 11CO2 (17) in blood. Using the corrected LV time–activity curve in conjunction with the myocardial time–activity curve, estimates of MBF from 1-11C-acetate kinetics were obtained in 2-steps. First, a simple 1-compartment model was used to estimate net tracer uptake, K1 (mL/g/min) and washout (k2 (min−1) along with FBM with FMM fixed to values obtained from the 15O-water estimates. Then, K1 values (where K1 is the product of MBF and first-pass myocardial tracer extraction (E)) were converted to MBF values using a first-pass myocardial extraction/flow relationship measured in rats (E = 1.0−0.74·exp(−1.13/MBF) (26). The rationale for the modeling approach chosen for 1-11C-acetate, where FMM was fixed to known values (and not estimated) and a simple compartment model was used to estimate tracer uptake (vs. a more complex one to estimate MBF directly), was designed to minimize uncertainty of the parameter estimates, which would result in poor or bias estimates of MBF. By minimizing the uncertainty in MBF estimates due to modeling, it could be assumed that most of the error or bias of MBF estimates must be due to noisy or bias data such as the input and myocardial time–activity curves.
Statistical Analysis.
Linear regression analysis was performed to correlate the MBF measurements obtained from 15O-water PET and the MBF values measured directly with microspheres. A t test was used to compare rest with dobutamine studies. P values < 0.05 were considered statistically significant.
RESULTS
15O-Water/Microsphere Study
Hemodynamic and perfusion measurements during 15O-water studies are summarized in Table 1. When compared with rest studies, heart rate was higher and diastolic blood pressure was lower during dobutamine studies, resulting in comparable rate·pressure products between the 2 groups. Consistent with comparable rate·pressure products, MBF measurements with either microspheres or 15O-water did not differ between rest and dobutamine studies. Infusion of propranolol resulted in a trend toward a lower heart rate, diastolic blood pressure, and MBF.
Hemodynamic and Perfusion Measurements During 15O-Water Studies
Overall group mean, variation, and range of PET parameters for 15O-water and microsphere MBFs are shown in Table 2. Mean values of FMM and FBM estimated from the kinetic of 15O-water show that FA does not result in completely pure myocardial time–activity curves because, on average, only 81% of total counts are observed in the myocardium and 24% of counts from blood are found in the myocardium. There were no statistical differences between MBF estimated from 15O-water kinetics and MBF measured directly with microspheres at rest or with dobutamine. Overall MBF variability, as expressed in Table 2 by the coefficient of variation (COV [100·SD/mean]), did not differ between microsphere and 15O-water measurements.
Descriptive Statistics of PET Parameters and Perfusion Measurements During 15O-Water/Microsphere Study
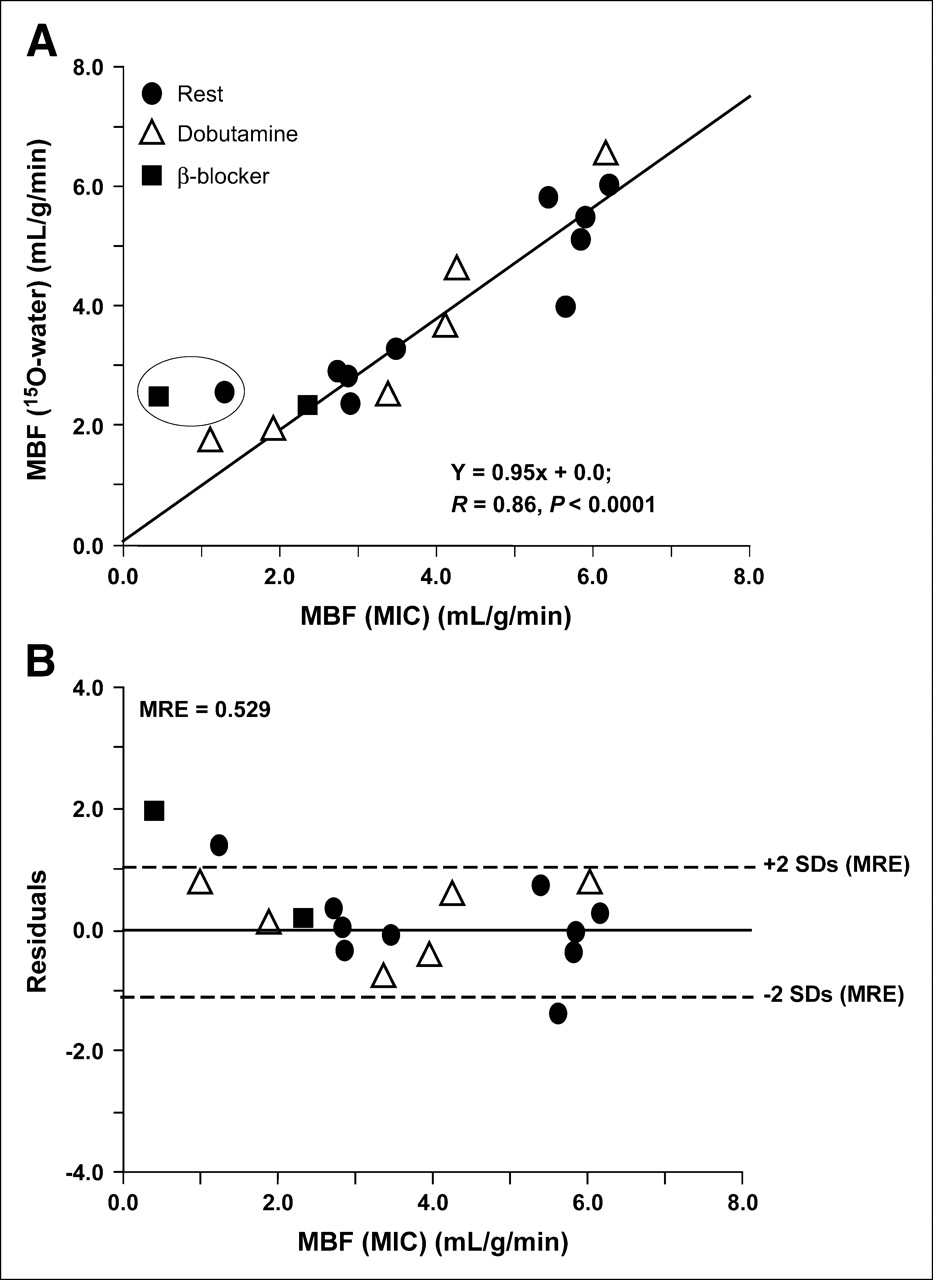
Noninvasive measurements of MBF by 15O-water correlated well with direct measurements of MBF with microspheres over a wide range of physiologic perfusion values obtained from 3 different interventions (r = 0.91, P < 0.0001) (Fig. 2A). Consistent with the hemodynamic profiles shown on Table 1, MBF measurements obtained with dobutamine (▵, Fig. 2A) were comparable to those obtained under resting conditions (•, Fig. 2A). However, the regression slope was significantly different from unity (slope = 0.74; confidence limits [0.56–0.93], P < 0.05), suggesting that measurements of MBF using 15O-water might be underestimated by as much as 26%. Visual inspection of the regression and residual plots showed that 2 MBF values under 1.5 mL/g/min tended to be overestimated by 15O-water independent of the intervention performed. Refitting the data after forcing the intercept to be zero resulted in a slope not different from unity (slope = 0.95; confident limits [0.86–1.05], P = not significant [NS]) (Fig. 3A) and showed that the overall underestimation of MBF using 15O-water could be attributed to these 2 perfusion values (0.45 [dobutamine] and 1.25 [rest]) (Fig. 3B).
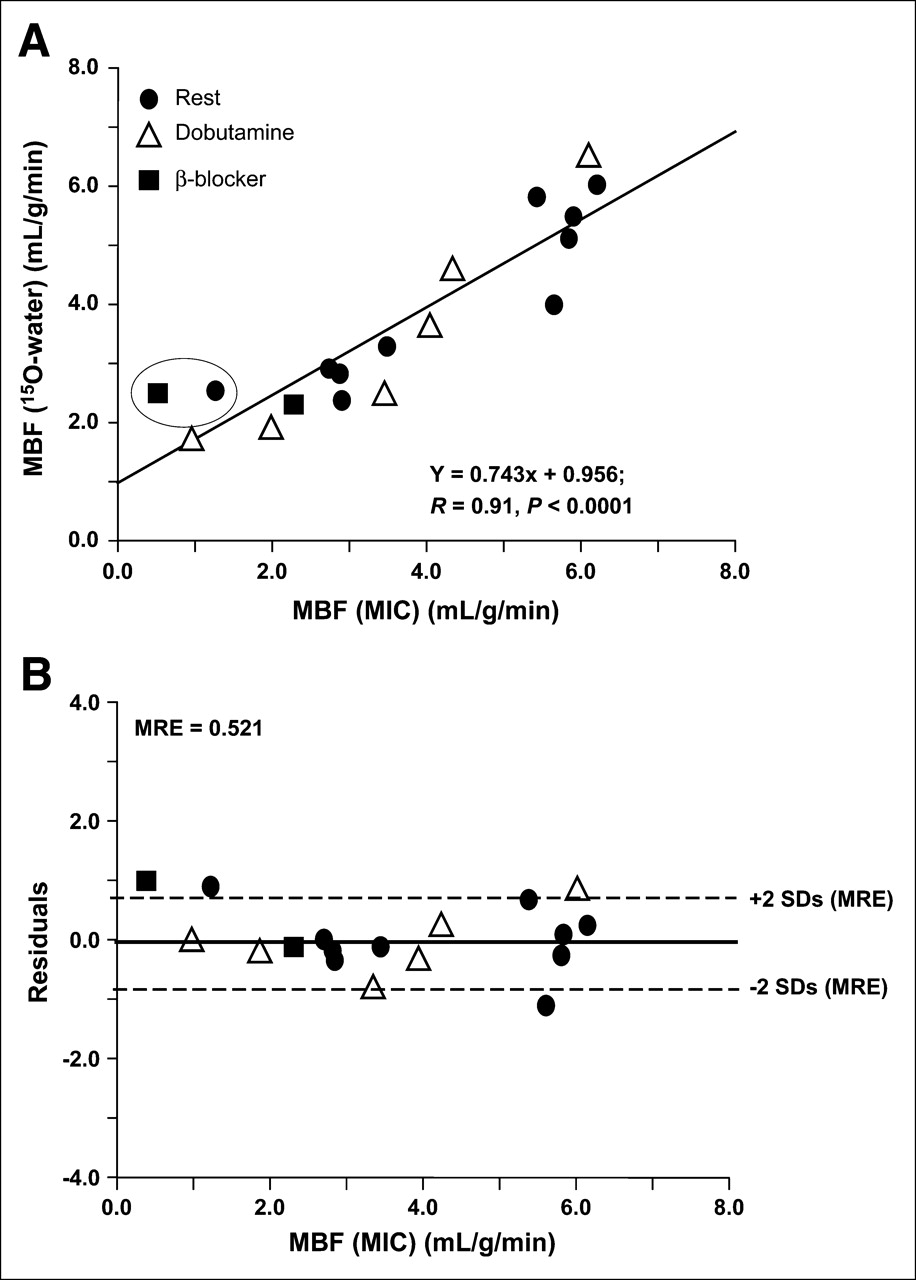
Correlation between MBF estimated from 15O-water and MBF measured directly using radiolabeled microspheres (MIC) (A) and the corresponding residual plot (B). Mean residual error (MRE) was calculated as the average of the absolute difference between measured and predicted MBF values from the regression analysis in A. •, resting perfusion; ▵, perfusion during dobutamine; ▪, perfusion during propranolol infusion.

Correlation between MBF estimates shown in Figure 2 after forcing the intercept to zero (A) and the corresponding residual plot (B). Mean residual error (MRE) was calculated as the average of the absolute difference between measured and predicted MBF values from the regression analysis in A. •, resting perfusion; ▵, perfusion during dobutamine; ▪, perfusion during propranolol infusion. MIC = radiolabeled microspheres.
1-11C-Acetate/15O-Water Study
Group mean and variation for fractional 11CO2 in blood, FBM, K1, and MBF for 1-11C-acetate and MBF for 15O-water are shown in Table 3. By 2 min after tracer injection, 51% of 11C blood activity was in the form of 11CO2. FBM estimates were quite variable among studies and between tracers. Mean values of FMM and FBM estimated from 15O-water kinetics in this study were comparable to those estimated from 15O-water kinetics from the 15O-water/microsphere study (FMM: 0.84 ± 0.14 vs. 0.81 ± 0.18, P = NS; FBM: 0.18 ± 0.14 vs. 0.24 ± 0.13, P = NS). However, FBM estimated from 1-11C-acetate kinetics was significantly lower than the corresponding FBM estimated from the 15O-water kinetics (0.085 ± 0.076 vs. 0.18 ± 14, P < 0.0001). Figure 4 shows representative blood and myocardial time–activity curves for 15O-water and 1-11C-acetate for low (Fig. 4A), medium (Fig. 4B), and high (Fig. 4C) MBF values. Note that all but one myocardial curve exhibit early peaks matching the blood peaks, indicative of the presence of blood-to-tissue spillover. These peaks are consistent with estimated FBM values greater than zero and demonstrate that the myocardial factor extracted from PET images was not free of resolution effects.

Representative blood and myocardial time–activity curves for 15O-water and 1-11C-acetate for low (A), medium (B), and high (C) MBF values. TAC = time–activity curve.
Descriptive Statistics of Arterial 11CO2, PET Parameters, and Perfusion Measurements During 1-11C-Acetate/15O-Water Study
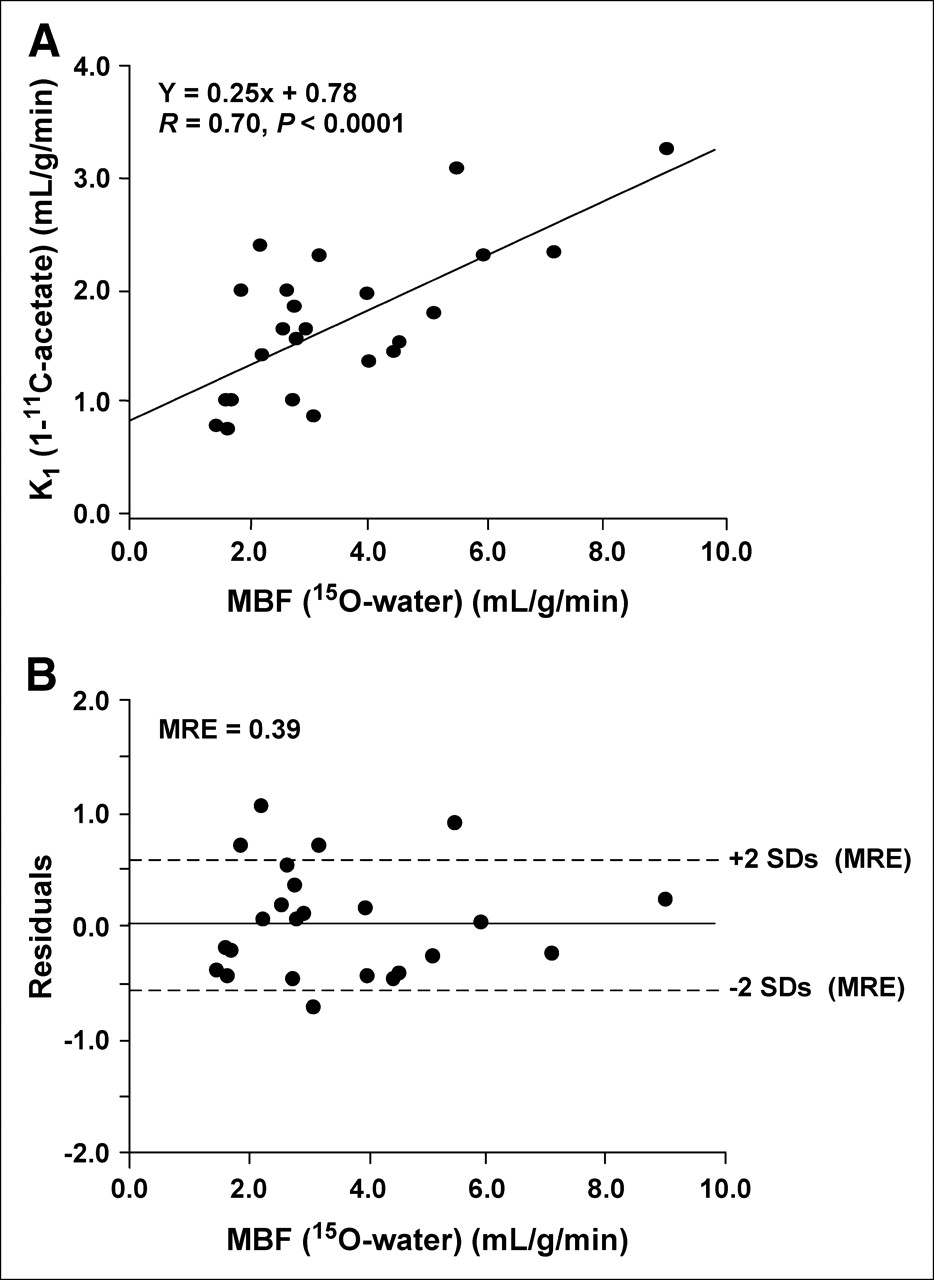
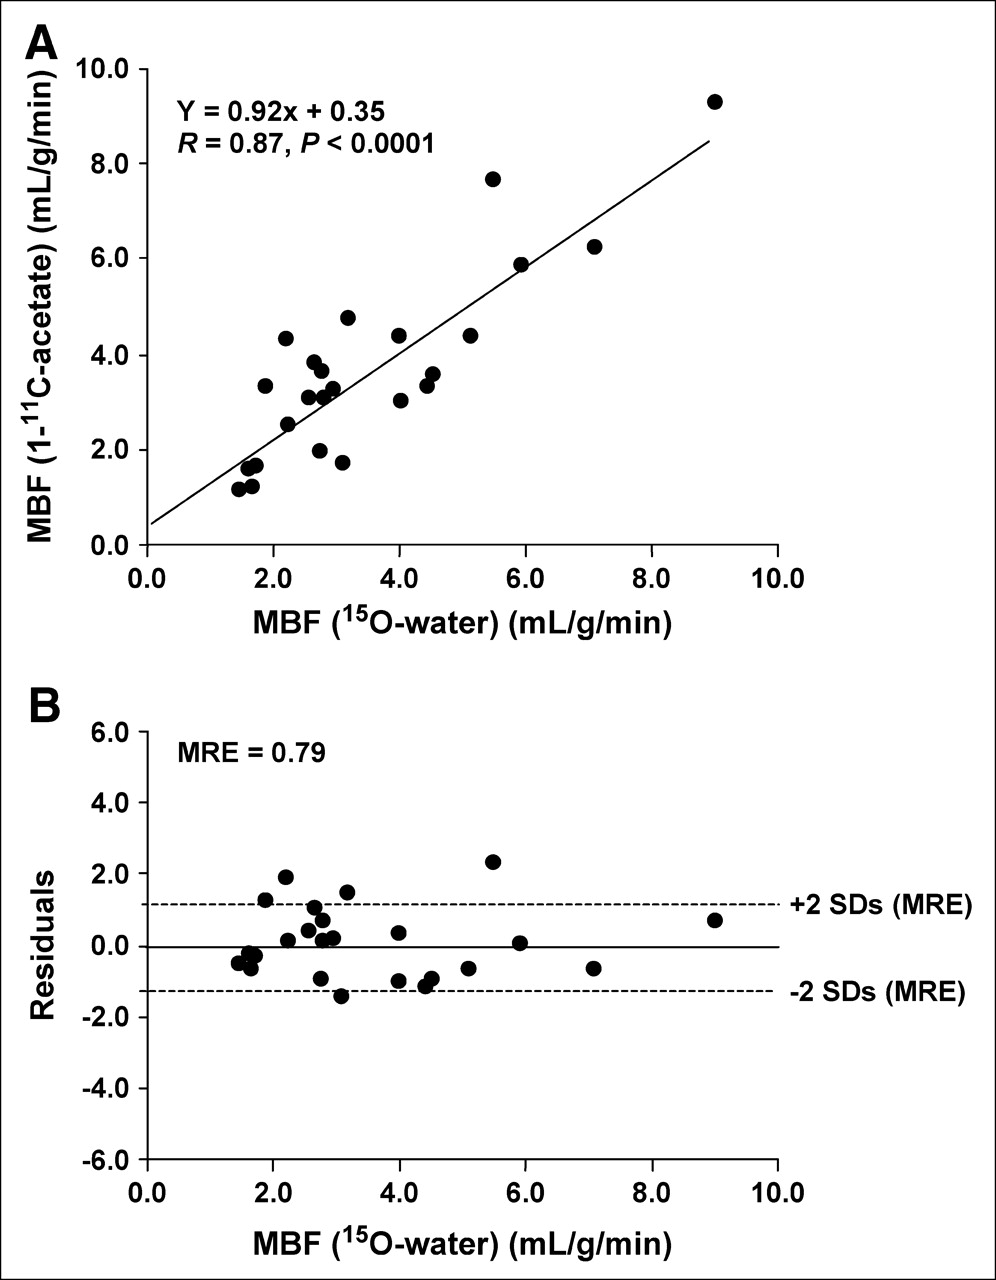
As anticipated, K1 values estimated from 1-11C-acetate kinetics were significantly lower than MBF estimated from 15O-water (Table 3; 1.66 ± 0.67 vs. 3.56 ± 1.89, P < 0.0001) and correlated poorly with MBF as determined by 15O-water (Fig. 5). However, when K1 values were converted to MBF using a first-pass myocardial extraction/flow relationship measured in rats, MBF estimates from 1-11C-acetate were not significantly different from those obtained with 15O-water (3.61 ± 2.0 vs. 3.56 ± 1.89, P = NS) and correlated well with MBF as determined by 15O-water (Fig. 6), with a slope of 0.92 not significantly different from unity and an intercept of 0.32 not different from zero.

Correlation between K1 estimated from 1-11C-acetate and MBF estimated from 15O-water (A) and the corresponding residual plot as a function of 15O-water MBF (B). Mean residual error (MRE) was calculated as the average of the absolute difference between measured and predicted MBF values from the regression analysis in A.

Correlation between MBF estimated from 1-11C-acetate and MBF estimated from 15O-water (A) and the corresponding residual plot as a function of 15O-water MBF (B). No significant residual bias was observed. Mean residual error (MRE) was calculated as the average of the absolute difference between measured and predicted MBF values from the regression analysis in A.
DISCUSSION
The advent of miniaturization of current noninvasive imaging technologies used in humans has permitted imaging of small animals (27–29). The goal of these small-animal imaging devices is to obtain the same anatomic, physiologic, or biochemical information in small-animal models of disease as that obtainable in humans and, thus, facilitate the correlation of research findings between bench and bedside. Moreover, the noninvasive capability of these imaging methods permits multiple acquisitions of this information, thus facilitating the assessment of temporal changes in disease or responses to new therapies in the same animal.
Accurate noninvasive measurements of myocardial perfusion are critical in the characterization of changes in myocardial perfusion due to cardiac diseases as well as for the assessments of therapies designed to improve myocardial perfusion. PET is used extensively in research and clinical environments to quantify myocardial blood flow noninvasively using several perfusion tracers—such as 13N-ammonia, 1-11C-acetate, 82Rb, and 15O-water—in conjunction with well-validated kinetic models (5,12–15,30,31). 15O-Water is currently used by our group to measure MBF in clinical research studies designed to assess myocardial substrate metabolism in the normal and diseased heart using PET metabolic tracers and kinetic modeling (12–14). Our group is interested in translating these methodologies to rodent models of cardiac diseases to better understand the mechanisms by which derangements in substrate metabolism due to cardiac diseases—such as obesity, diabetes, and cardiomyopathies—contribute to cardiac dysfunction. To accomplish this, PET methodologies used in humans must be validated in small animals using small-animal PET. In the present study 15O-water and 1-11C-acetate were used in conjunction with small-animal PET and kinetic modeling to assess MBF in rats.
It is evident from the data (Figs. 2 and 3) that the use of 15O-water to determine the MBF in rat myocardium on small-animal PET is valid with a good correlation shown against values obtained with radioactive microspheres. It has also been shown that estimates of MBF using 1-11C-acetate and a simple kinetic approach correlated well with measurements of MBF estimated for 15O-water for a wide range of physiologic flows (Fig. 5). Thus, the results of these studies show that it is feasible to quantify MBF in rats from the kinetics of 15O-water and that estimates of MBF obtained with 1-11C-acetate are comparable to those obtained with 15O-water. However, there are several issues that must be addressed.
The resolution of the microPET scanner (2.1-mm full width at half maximum [FWHM]) used in these studies in relation to the dimensions of the rat heart (approximately 2 mm) results in contaminated blood and myocardial time–activity curves generated directly from dynamic cardiac microPET images. The theoretic FMM value expected for a 2-mm myocardial wall with a 2-mm FWHM resolution is 0.76, decreasing significantly in the presence of cardiac and respiratory motion. Blood (input function) and myocardial time–activity curves, the key data required for kinetic modeling, must be corrected for these resolution effects. To minimize these effects, blood and myocardial time–activity curves for both tracers were extracted from PET cardiac images using FA (23–25). Wu et al. have (23) shown in small-animal studies that the FA approach used in the present study, which uses positive constraints and a single pure blood sample as an additional constraint, resulted in pure blood time–activity curves. However, to our knowledge, to date, there are no studies investigating whether a unique and pure myocardial factor can be extracted from the heart of small animals using this approach. In fact, it is well known that that one of the major shortcomings of the use of FA is that factors extracted using only positive constraints are not mathematically unique (32). The potential nonuniqueness of the method most probably contributed to the poor quality and bias of the FA images obtained with 15O-water (Fig. 1A) when compared with those obtained with 1-11C-acetate. The similar kinetics between blood and myocardial curves obtained with 15O-water (Figs. 1 and 4) contributed most probably to the poor resolution of the 3 factor images—specifically, the myocardial image, where it appears that a perfusion defect is present in the lateral or inferior region of the heart from a healthy, nonischemic rat.
In spite of poor factor images, this approach resulted in myocardial time–activity curves (Fig. 4) that were consistent with the myocardial kinetics of the tracers, with myocardial curves from freely diffusible 15O-water showing fast uptake and washout of tracer and myocardial curves from partially retained and quickly oxidized 1-11C-acetate showing uptake, retention, and fast clearance of tracer (Fig. 4). The myocardial curves were also relatively free of severe partial-volume and spillover effects (15O-water myocardial activity obtained from PET images contained an average of 82% of true myocardial activity [FMM] and 21% of blood activity [FBM]) and, in conjunction with FA blood time–activity curves, resulted in good estimates of MBF (Figs. 2, 3, and 6). These observations strongly suggest that myocardial time–activity curves generated from FA and positive constraints, though they might not be unique, are physiologic curves.
Another key limitation in the use of FA is that it does not allow for the extraction of regional myocardial curves, because only one global myocardial curve per study is generated from FA—thus, limiting the usefulness of this approach to perfusion studies in nonischemic animals. Our group is currently implementing new reconstruction algorithms as well as cardiac gating strategies designed to minimize these resolution effects so that regional analysis of myocardial data could be implemented (33,34) to allow for perfusion measurements in ischemic or infarcted regions.
Myocardial partial-volume and spillover effects (FMM and FBM) present in the PET myocardial 15O-water time–activity curves were considered by estimating FMM and FBM in conjunction with MBF from the kinetics of PET 15O-water time–activity curves. The results of this study clearly show that it is feasible to measure MBF over a wide range of nonischemic perfusion using 15O-water and a well-established kinetic modeling approach (12–15). Although the range of MBF in the 15O-water study obtained in this investigation spanned from 0.45 to 6.18.mL/g/min, dobutamine infusion did not result in hyperemic flows. This is most probably attributed to the infusion protocol used. Using 13N-ammonia, Croteau et al. (35) obtained mean MBF values during dobutamine infusion in rats of 9.3 ± 3.1 mL/g/min (from rest values of 4.3 ± 1.0 mL/g/min) by infusing dobutamine at rates of 5 μg/kg/min for 2 min, 10 μg/kg/min for 2 min, and 20 μg/kg/min for 9 min, with injection of the tracer 5 min after the last dobutamine plateau. In contrast, in our study, dobutamine was given at a dose of 12.5 μg/kg/min 2 min before 15O-water injection and continued until euthanasia. Because the scan period was only 5 min, it is most probable that a high enough dose of dobutamine in blood was not achieved to generate a hyperemic response.
The wide range of flows observed at rest was due to MBF values greater than 5.0 mL/g/min in 5 of the 10 rats studied at rest (Figs. 1A and 2A). These high perfusion values are consistent with the vasodilating effect of isoflorane anesthesia, which increases coronary flow, resulting in increased MBF (36,37). When Iltis et al. (38) examined the impact of 4 different anesthetic protocols on rat MBF, they observed that isoflurane resulted in the highest MBF (5.9 ± 1.1). Although the wide range of MBF obtained in both studies allowed for a sound validation of the PET kinetic methods under nonischemic conditions, the lack of hyperemic response to dobutamine and the wide range of MBF obtained under resting conditions render the animal model chosen in this study useless in studies designed to detect physiologic (i.e., disease) or induced (i.e., adenosine) changes in MBF. Alternative rat models using different anesthetics and hyperemic agents with the appropriate doses need to be investigated to ensure that physiologic resting perfusion and proper response to different vasodilators within the same animal is attained with 15O-water and 1-11C-acetate and small-animal PET.
15O-Water is an excellent myocardial perfusion tracer that has been validated extensively in large animals and is used widely in clinical perfusion studies by several centers. Consistent with the studies in large animals, we have shown in the present study that 15O-water is also an excellent tracer to measure MBF in rats at rest. However, partially extracted tracers—such as 13N-ammonia, 82Rb, and, to a lesser extent, 1-11C-acetate—are used to measure MBF. The unique advantage of using 1-11C-acetate as a perfusion tracer is that as an excellent tracer for measurements of MVO2, 2 key measurements done routinely in cardiac studies, MVO2 and MBF, could be obtained with one single tracer. To investigate whether 1-11C-acetate could be used as a perfusion tracer in small animals, given that fractional tissue recovery (FMM) is known a priori, estimates of MBF from the PET kinetics of 1-11C-acetate were done after fixing FMM for each animal to the FMM value obtained from its 15O-water study and compared with measurements of MBF using 15O-water. Estimated MBF values using this approach correlate well with MBF values estimated from 15O-water (Fig. 6). However, this is not a practical approach, because another perfusion tracer was required to measure FMM. Approaches in which FMM is either estimated from the microPET kinetics of the tracer in a fashion similar to what is currently done with 15O-water or measured a priori using other microimaging techniques, such as microCT, should be further investigated.
Measurements of MBF in the current study were done under a wide range of resting flows in healthy myocardium. Validation of these methodologies under ischemic or infarcted and reperfusion conditions will add extra layers of complexity as partial-volume and spillover effects will be more pronounced than in healthy myocardium because of the thinning of myocardium as well as the presence of flow heterogeneity during ischemia. However, to truly make these methodologies useful in the study of cardiac diseases using rodent models, they must be validated under ischemic, infarcted, and reperfusion conditions.
It is important to note that the studies presented here have been performed in a rat heart and translation to the mouse (the most common form of transgenic model) will require an additional stage of validation or improved resolution accomplished with either improved scanner or reconstruction algorithms. Spatial resolution and sensitivity may be issues if syndromes such as ischemia are to be examined. We are continuing to develop methods to use with the mouse myocardium, such as the implementation of both cardiac and respiratory gating (2–4), and new reconstruction algorithms, such 3-dimensional Maximum a posteriori (MAP) (39), to overcome these potential limitations.
CONCLUSION
Accurate measurements of MBF can be performed in the rat heart by small-animal PET and 15O-water. Although this requires further study, it appears that quantification of MBF is possible using 1-11C-acetate, thus potentially facilitating the simultaneous measurement of MBF and MVO2.
Acknowledgments
We thank Carmen S. Dence, Nicole Fettig, Mark Nolte, Lori Strong, Margaret M. Morris, Jerrel Rutlin, and Lynne Jones for technical assistance. We also thank Kooresh Shoghi, PhD, for helpful discussions. This work was supported by NIH/NHLBI grant 2-PO1-HL-13851.
References
- Received for publication March 30, 2005.
- Accepted for publication December 19, 2005.


Jump to section
Related Articles
Cited By...
- Feasibility of 11C-Acetate PET/CT for Imaging of Fatty Acid Synthesis in the Atherosclerotic Vessel Wall
- Targeting Angiogenesis Using a C-Type Atrial Natriuretic Factor-Conjugated Nanoprobe and PET
- In Vivo Metabolic Phenotyping of Myocardial Substrate Metabolism in Rodents: Differential Efficacy of Metformin and Rosiglitazone Monotherapy
- Time Course of Alterations in Myocardial Glucose Utilization in the Zucker Diabetic Fatty Rat with Correlation to Gene Expression of Glucose Transporters: A Small-Animal PET Investigation
- Initial Characterization of an 18F-Labeled Myocardial Perfusion Tracer
- Assessment of Myocardial Metabolism in Diabetic Rats Using Small-Animal PET: A Feasibility Study