


Abstract
The microPET Focus 120 scanner is a third-generation animal PET scanner dedicated to rodent imaging. Here, we report the results of scanner performance testing. Methods: A 68Ge point source was used to measure energy resolution, which was determined for each crystal and averaged. Spatial resolution was measured using a 22Na point source with a nominal size of 0.25 mm at the system center and various off-center positions. Absolute sensitivity without attenuation was determined by extrapolating the data measured using an 18F line source and multiple layers of absorbers. Scatter fraction and counting rate performance were measured using 2 different cylindric phantoms simulating rat and mouse bodies. Sensitivity, scatter fraction, and noise equivalent counting rate (NECR) experiments were repeated under 4 different conditions (energy window, 250∼750 keV or 350∼650 keV; coincidence window, 6 or 10 ns). A performance phantom with hot-rod inserts of various sizes was scanned, and several animal studies were also performed. Results: Energy resolution at a 511-keV photopeak was 18.3% on average. Radial, tangential, and axial resolution of images reconstructed with the Fourier rebinning (FORE) and filtered backprojection (FBP) algorithms were 1.18 (radial), 1.13 (tangential), and 1.45 mm full width at half maximum (FWHM) (axial) at center and 2.35 (radial), 1.66 (tangential), and 2.00 mm FWHM (axial) at a radial offset of 2 cm. Absolute sensitivities at transaxial and axial centers were 7.0% (250∼750 keV, 10 ns), 6.7% (250∼750 keV, 6 ns), 4.0% (350∼650 keV, 10 ns), and 3.8% (350∼650 keV, 6 ns). Scatter fractions were 15.9% (mouse phantom) and 35.0% (rat phantom) for 250∼750 keV and 6 ns. Peak NECR was 869 kcps at 3,242 kBq/mL (mouse phantom) and 228 kcps at 290 kBq/mL (rat phantom) at 250∼750 keV and 6 ns. Hot-rod inserts of 1.6-mm diameter were clearly identified, and animal studies illustrated the feasibility of this system for studies of whole rodents and mid-sized animal brains. Conclusion: The results of this independent field test showed the improved physical characteristics of the F120 scanner over the previous microPET series systems. This system will be useful for imaging studies on small rodents and brains of larger animals.
PET is a noninvasive, diagnostic imaging technique that produces functional or biochemical images of a body (1–4). Although PET is regarded as a powerful translational research tool between animal models and human clinical applications (5–8), clinical PET scanners used for human studies do not have satisfactory spatial resolution or sensitivity for studies of small animals, such as rats and mice (9–11). Because the linear dimensions of organs in these animals are 10 or more times smaller in each dimension than in human subjects, the spatial resolution of a suitable PET scanner must be similarly higher and the voxel size should also be reduced according to sampling theory (9,10). To obtain images of the same quality as in humans, the sensitivity of such high-resolution PET scanners must also be increased, as the number of counts per voxel is inversely proportional to voxel volume. Therefore, detector ring diameter and crystal element size must be reduced to increase photon-detection efficiency and spatial resolution.
The microPET Focus 120 (F120) is a third-generation microPET scanner dedicated to animal imaging and was developed by Siemens Medical Solutions, Inc. It features higher light collection efficiency, better optical isolation between adjacent elements, and a denser detector block packing fraction than previously released microPET series with equivalent detector ring diameters and axial field of view (FOV) (12). Although the physical characteristics of this unit were reported previously at a conference (13), to our knowledge, no full performance measurement results by independent users have been reported in the literature. Here, we report the results of independent field tests on the system performance of the F120, including its spatial resolution, sensitivity, scatter fraction, and counting rate performance. In addition, the utility of this system for animal PET studies is discussed.
MATERIALS AND METHODS
System Description
F120 is a ring-type, high-sensitivity, high-resolution PET scanner intended for imaging small animals, such as rats, mice, and cats. Its detector array consists of 96 detector blocks around a circle such that the face-to-face diameter of the ring is 15 cm. Each detector module is placed in time coincidence with 7 opposite modules to give an effective transaxial FOV of approximately 10 cm and an axial FOV of 7.6 cm. Each detector module consists of a 12 × 12 array of lutetium oxyorthosilicate (LSO) crystals of size 1.5 × 1.5 × 10 mm. The LSO end is optically coupled to a position-sensitive photomultiplier tube via an 8 × 8 bundle of optical fibers.
PET data are acquired in list mode, and list-mode data can be sorted into 3-dimensional (3D) sinograms using different span numbers and ring differences or directly into 2-dimensional (2D) sinograms by single-slice rebinning (SSRB) (14). Images can be reconstructed directly from the 3D sinograms using 3D ordered-subset expectation maximization (OSEM 3D), a 3D reprojection algorithm (3DRP), or a 3D maximum a posteriori (MAP) (15–17). Filtered backprojection (FBP) or 2D ordered-subset expectation maximization (OSEM 2D) can be applied to 2D sinograms resorted by SSRB or a Fourier rebinning algorithm (FORE) (18).
We compare the specification of this scanner with those of a previous microPET system with the same ring diameter (microPET R4; R4) and with another Focus scanner with a larger diameter (microPET Focus 220; F220) (Table 1) (12,19).
Specification Comparison of microPET Systems Related to Focus 120
Energy Resolution
Crystal energy spectra within an energy window of 100∼811 keV were obtained. Events were acquired using a 68Ge point source for 600 s in energy-spectrum mode.
Energy resolution was determined for each crystal in the system and calculated as full width at half maximum (FWHM) of a 511-keV energy peak divided by the energy peak value (ΔE/E = FWHM/E). The mean value of all crystal energy resolutions was calculated.
Spatial Resolution
Spatial resolution was measured using a 22Na point source with a nominal diameter of 0.25 mm, embedded in a lucite disk (Isotope Products Laboratories). The activity of the point source was 673.4 kBq (18.2 μCi). Spatial resolution measurements were not corrected for source dimension, positron range, or acolinearity of positron annihilation (12,20).
The point source was placed on the microPET Focus imaging bed and centered in transaxial and axial FOVs. Data were acquired for 1 min in list mode with an energy window of 250∼750 keV and a timing window of 6 ns. At least 1.5 million counts were acquired. Point source positions were ensured by examining reconstructed images using the FBP algorithm and adjusted manually until the center of the point source was located at the center of transaxial and axial FOVs. After acquiring data at the center of a FOV, the point source was moved in the vertical direction in steps of 1 mm from 0 to 10 mm and in steps of 2 mm from 12 to 32 mm (maximum offset) to acquire data for measuring off-center resolutions according to radial offset. The vertical direction in the gantry (real space) corresponded to the radial direction in transaxial images. Measurements along the radial direction were repeated 4 times with the source stepped along the axial direction using a step size of 0.2 mm (one eighth of the crystal pitch) to obtain oversampled axial profiles by interleaving (12).
List-mode PET data were sorted into 3D sinograms. Delayed and random events were subtracted from prompt events. 3D sinograms were rebinned into 2D sinograms using FORE and reconstructed using FBP with a ramp filter cutoff at the Nyquist frequency after detector normalization using the component-based normalization method (21). The pixel size of reconstructed images was 0.087 × 0.087 mm (10× image zoom).
To determine transaxial radial and tangential resolutions at each position, profiles through count distribution peaks were drawn in 2 orthogonal directions on middle slices. FWHM and full width at tenth maximum (FWTM) values were then determined by linear interpolation between adjacent pixels at a half or tenth of the profile maximum value, which was determined by parabolic fit using peak points and their 2 nearest neighboring points (22,23). Axial profiles were also drawn to determine axial resolution with or without axial oversampling. Finally, volumetric resolution was calculated as the product of the axial, transaxial radial, and transaxial tangential resolutions.
Sensitivity
Sensitivity was defined by the ratio of the collected true coincidence counting rate to radioactivity (counts/s/kBq, cps/kBq). To measure sensitivity, a 18F line source (148∼370 kBq) was embedded in a glass capillary tube of the same length as the axial FOV of the scanner (7.6 cm); an inner tube diameter of 1.1 mm was used. The line source was placed along the axis of the scanner and centered in the transaxial and axial direction. After confirming that the dead-time loss was <1%, the line source, surrounded by 1∼5 aluminum sleeves of thickness 1 mm and different diameters, was scanned to determine the sensitivity free of photon attenuation and scatter. PET data were acquired for 10 min under 4 different conditions (energy window of 250∼750 or 350∼650 keV; coincidence window of 6 or 10 ns). The scan time was sufficiently long to collect >10,000 true counts. The number of coincidences was measured for every attenuating thickness(1, 2, 3, 4, and 5 mm), and delayed coincidences and intrinsic radioactivities of LSO crystals (24–26) were subtracted to obtain true counting rates, which were corrected for 18F activity decay and plotted against attenuator thickness to extrapolate true counting rates with no attenuation from these measurements (19,22,23,27). To assess sensitivity at the periphery of the transaxial FOV, the same experiments were repeated at a 20-mm radial offset from the center. The measured sensitivity values using the line source were multiplied by 2 to obtain the absolute sensitivity values of the scanner for a central point source (19,28) and corrected for the 18F branching ratio (0.967).
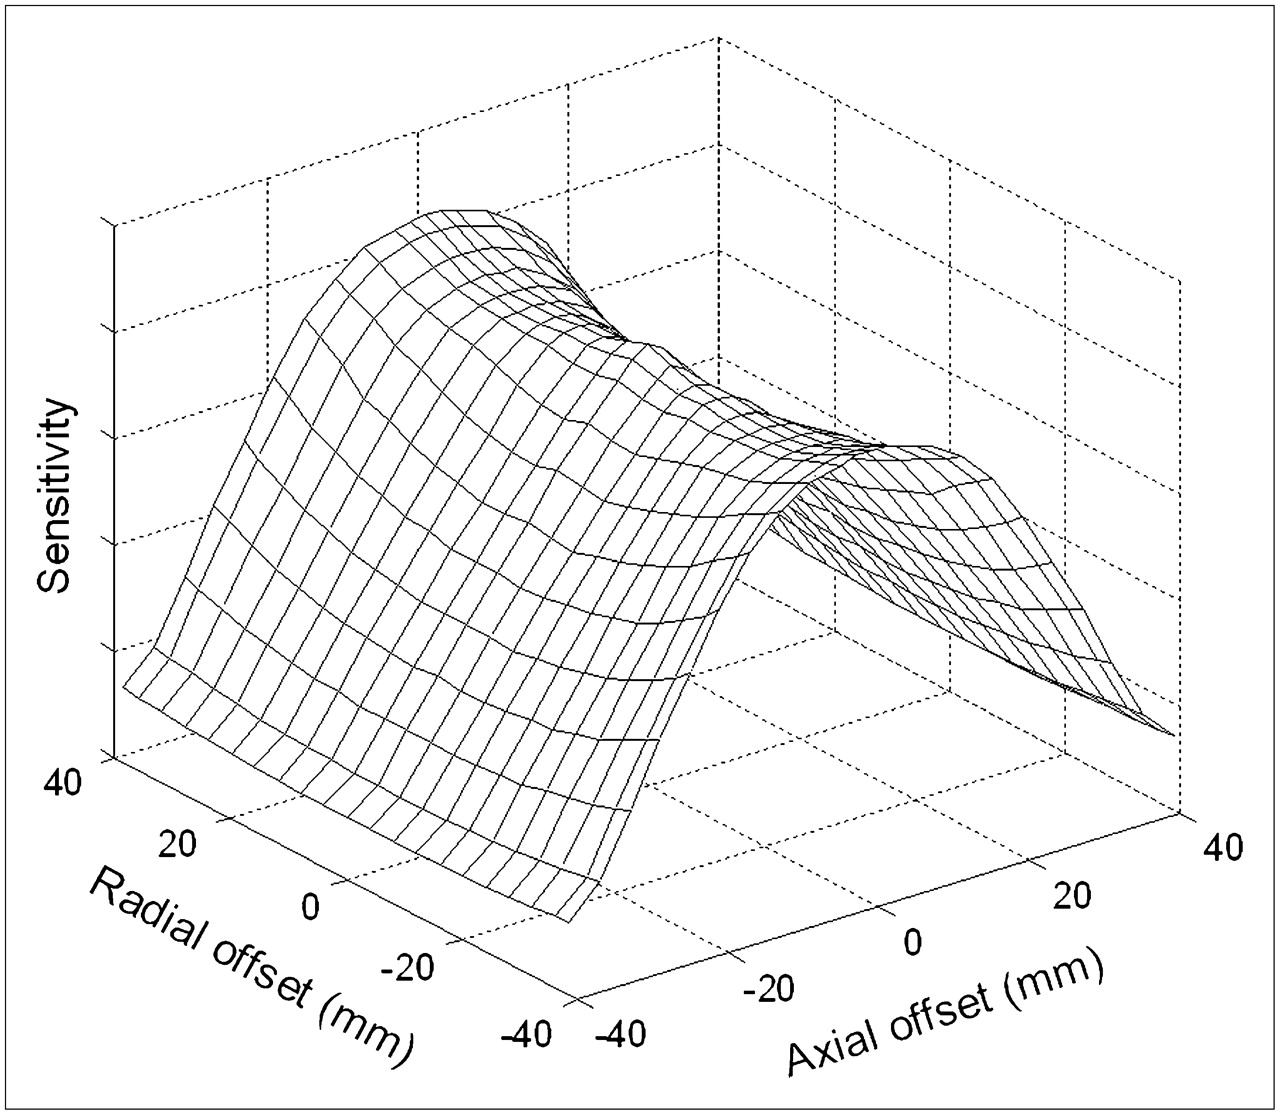
In addition, the 3D sensitivity profile over the whole FOV was measured. The 22Na point source (673.4 kBq) was positioned at the center of the FOV, and the bed was moved in the axial and radial directions in steps of 4 mm using an energy window of 350∼650 keV and a coincidence window of 10 ns.
Scatter Fraction and Counting Rate Performance
Scatter fraction and counting rate performance were measured using 2 different cylindric polyethylene “NEMA-like” phantoms (density, 0.96 g/mL), which simulated a typical rat body (inner diameter, 6 cm; length, 15 cm) and a mouse body (inner diameter, 3 cm; length, 7 cm). Holes were drilled parallel to the central axis of the cylinder at a radial distance of 15 mm (rat scatter phantom) and 7.5 mm (mouse scatter phantom). A line-source insert with the same length as each phantom was filled with 18F solution and threaded through these holes. Phantoms were mounted on the imaging bed and centered in transaxial and axial FOVs. Initial line-source activities were 335.748 MBq (9.07 mCi) and 310.43 MBq (8.39 mCi) for mouse and rat phantoms, respectively. List-mode PET data were collected every 3 min for initial 6-h datasets and then for 10 min for later datasets. PET data were collected for a total of 23 h (12.5 half-lives) at all combinations of the 2 energy windows (250∼750 and 350∼650 keV) and 2 coincidence windows (6 and 10 ns). PET data were acquired until dead-time loss was <1% for scatter fraction calculations (14). Background coincidence events due to intrinsic true counts from 176Lu in the LSO crystal was also measured with mouse or rat phantoms centered in the FOV with no activity in the line source (blank sinogram) (24,26). PET list-mode data were sorted into 2D sinograms using SSRB. Prompt and random sinograms were generated separately. The random sinograms were estimated from singles event rates (13).
For prompt sinograms (bin size, 0.815 mm; slice thickness, 0.796 mm) of each slice, the projection profile of each projection angle was shifted so that peak pixels were aligned with the center of the sinogram and the summed projection profile across the projection angle was then generated. For each summed profile, all counts beyond a band of 16 mm larger than the phantom were set to zero. All pixel counts beyond a 7-mm radius (line-source band) from the center of profile were assumed to be the sum of random, scatter, and intrinsic counts, and these counts under the peak were estimated by linearly interpolating the number of events at the left and right borders of the line-source band. Counts above this line were regarded as true counts. Random and intrinsic counts were estimated from random and blank sinograms, respectively, using the same band size of 16 mm larger than the phantom (13,26).
The scatter counting rate was calculated using the following equation: Eq. 1where Rscatter, Rtotal, Rtrue, Rrandom, and Rintrinsic are the scatter, total, true, random, and intrinsic counting rates, respectively. Scatter fractions for slices were calculated as the ratios of scattered and total events and averaged to obtain overall system scatter fractions.
Noise equivalent counting rate (NECR) at the ith acquisition was then determined using the following equation: Eq. 2where Rtotal(i) and Rtrue(i) are the total and true counting rates, respectively, for the ith acquisition (12,13,23,26).
Imaging Studies
Phantom Study.
A Micro Deluxe phantom (inner diameter, 4.5 cm; inside height, 6.3 cm) with different sized hot-rod inserts (diameters, 1.2, 1.6, 2.4, 3.2, 4.0, and 4.8 mm) arranged in 6 segments (Data Spectrum Corp.) was scanned with an energy window of 350∼650 keV and a coincidence window of 6 ns. The phantom was filled with 9.3 MBq (250 μCi) of 18F and scanned for 1 h. The PET image was reconstructed using 3DRP (16).
Animal Studies.
To investigate the feasibility of the scanner for animal studies, mouse, rat, and cat studies were performed.
A mouse bone image was acquired using the same energy and coincidence windows as used in the phantom study. 18F (41.8 MBq [1.13 mCi]) was injected intravenously and, 3 h later, a 1-h list-mode emission dataset was acquired. List-mode PET data were sorted into sinograms and reconstructed using different reconstruction algorithms including FBP, 3DRP, expectation maximinization (EM), and MAP (iterations, 40; β, 0.0001).
A cardiac gated PET image of a 200-g Sprague–Dawley rat was acquired. Thirty-seven megabecquerels (1 mCi) of 18F-FDG were injected intravenously and, 1 h later, a 30-min list-mode emission dataset was acquired. Sinograms were rebinned using FORE and reconstructed using the OSEM algorithm.
An 18F-FDG scan of a cat brain was also acquired. A 2.5-kg cat was positioned in the scanner with its brain centered in the FOV. A 30-min transmission scan was acquired using a 68Ge point source with an energy window of 460∼560 keV and singles mode. 18F-FDG (92.5 MBq [2.5 mCi]) was injected intravenously and, 30 min later, 30 min of list mode of the emission dataset was acquired. An attenuation map was reconstructed from the transmission PET data and a blank scan using MAP reconstructed transmission images (MAP TR) (29) and reprojected to the sinogram space using inverse FORE to form an attenuation correction file.
RESULTS
Energy Resolution
The best energy resolution for all crystals was 14.4%, and the worst energy resolution was 41.4%. The energy resolution at 511 keV, averaged over all heads, detectors, and crystals, was 18.3%, which was better than that of the R4 system (23%) (19) and was equivalent to that of the F220 system (18.5%) (12). Thus, energy resolution was found to be significantly improved on the F120 system as compared with the R4 system.
Spatial Resolution
Radial, tangential, and axial spatial resolutions acquired from the FBP reconstructed images of 22Na point source are plotted versus the radial offset from the center (Figs. 1A and 1B). Resolutions using FBP were 1.18 (radial), 1.13 (tangential), 1.44 (axial without oversampling), and 1.45 mm FWHM (axial with oversampling) at the center and 2.35 (radial), 1.66 (tangential), 2.09 (axial without oversampling), and 2.00 mm FWHM (axial with oversampling) at a radial offset of 2 cm. Volumetric resolution is shown in Figure 1C. The volumetric resolution was 1.92 μL without axial oversampling and 1.94 μL with axial oversampling at the center, and 8.14 μL without axial oversampling and 7.81 μL with axial oversampling at a radial offset of 2 cm.

Spatial resolution profile measured using a 22Na point source. (A) Transaxial (radial and tangential). (B) Axial with or without oversampling. (C) Volume resolution with or without oversampling.
Sensitivity
At the center of the axial FOV, the absolute sensitivity at the transaxial center and with a 20-mm radial offset using an energy window of 250∼750 keV and a coincidence window of 10 ns were 69.9 and 71.2 cps/kBq (7.0 and 7.1%), respectively. Absolute sensitivity values at the center and with a 20 mm radial offset with other combinations of energy and coincidence windows are summarized in Table 2. Figure 2 shows the sensitivity profile measured using a 22Na point source as a function of transaxial and axial positions with an energy window of 350∼650 and a coincidence window of 10 ns.

3D sensitivity profile over a FOV.
Absolute Sensitivity for a Point Source Centered in Axial FOV
Scatter Fraction and Counting Rate Performance
The scatter fraction and NECR for mouse and rat phantoms are summarized in Table 3. With an energy window of 250∼750 keV and a coincidence window of 6 ns, the peak true counting rates for mouse and rat phantoms were 1,296 kcps at 3,243 kBq/mL and 582 kcps at 448 kBq/mL, respectively. The NECR curves for the mouse and rat phantoms are plotted as a function of total activity in the phantom in Figures 3A and 3B. With an energy window of 250∼750 keV and a coincidence window of 6 ns, the peak NECRs for mouse and rat phantoms were 869 kcps at 3,242 kBq/mL (4.34 mCi total activity) and 228 kcps at 290 kBq/mL (3.32 mCi total activity), respectively.
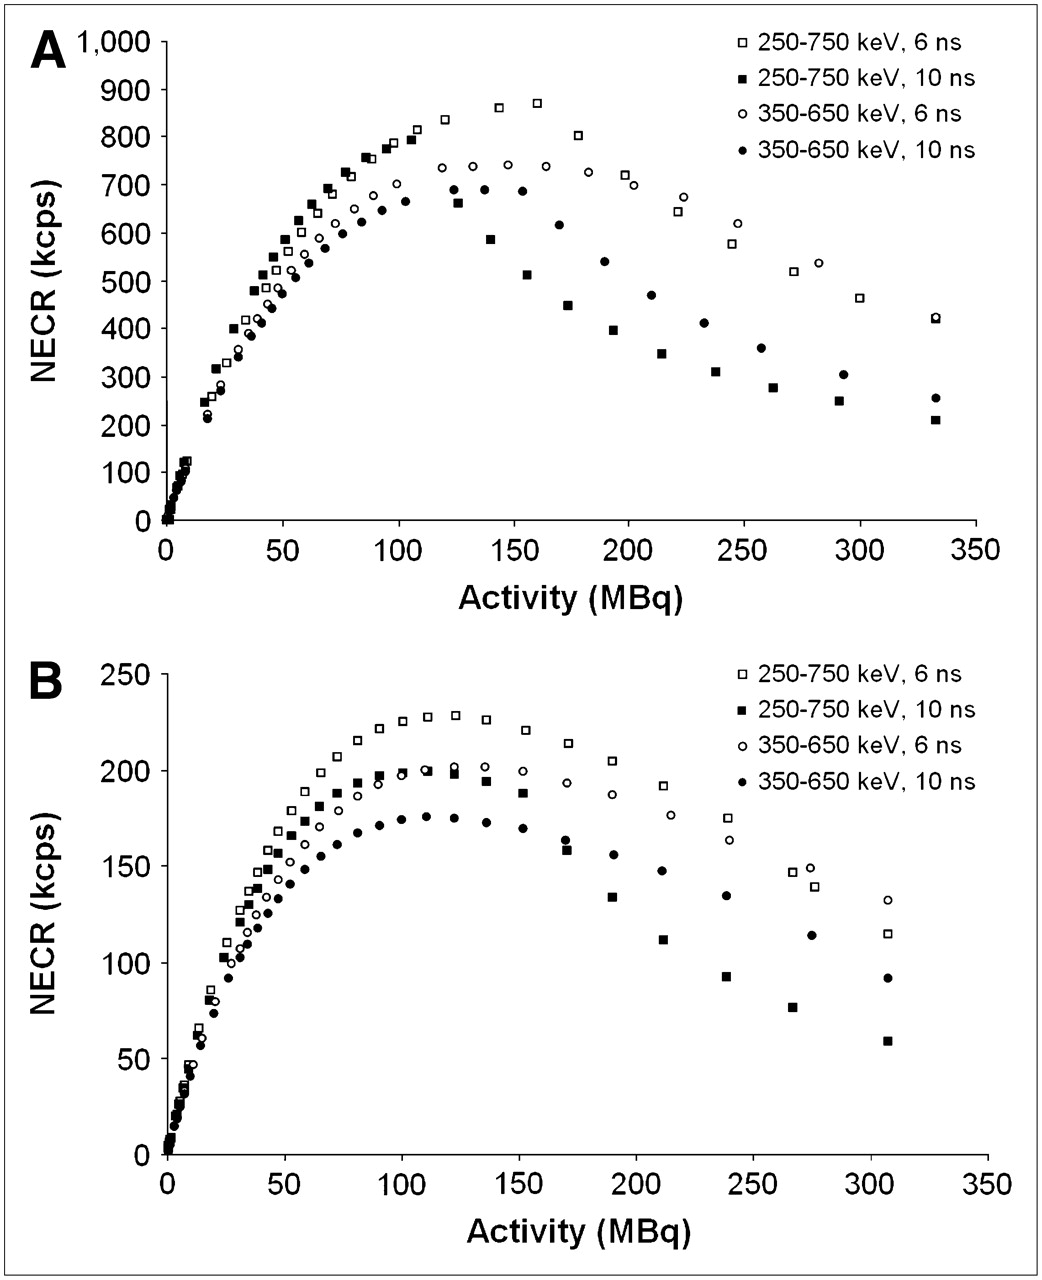
NECR vs. total radioactivity for mouse (A) and rat (B) phantoms.
Scatter Fraction and Counting Rate Performance
Imaging Studies
Phantom Study.
Figure 4 shows a transaxial image of the Micro Deluxe phantom with hotrod inserts. All rod inserts with diameters of 1.6∼4.8 mm were distinguishable in this image. Although the rods with diameter of 1.2 mm were identifiable, their separation was not clear.
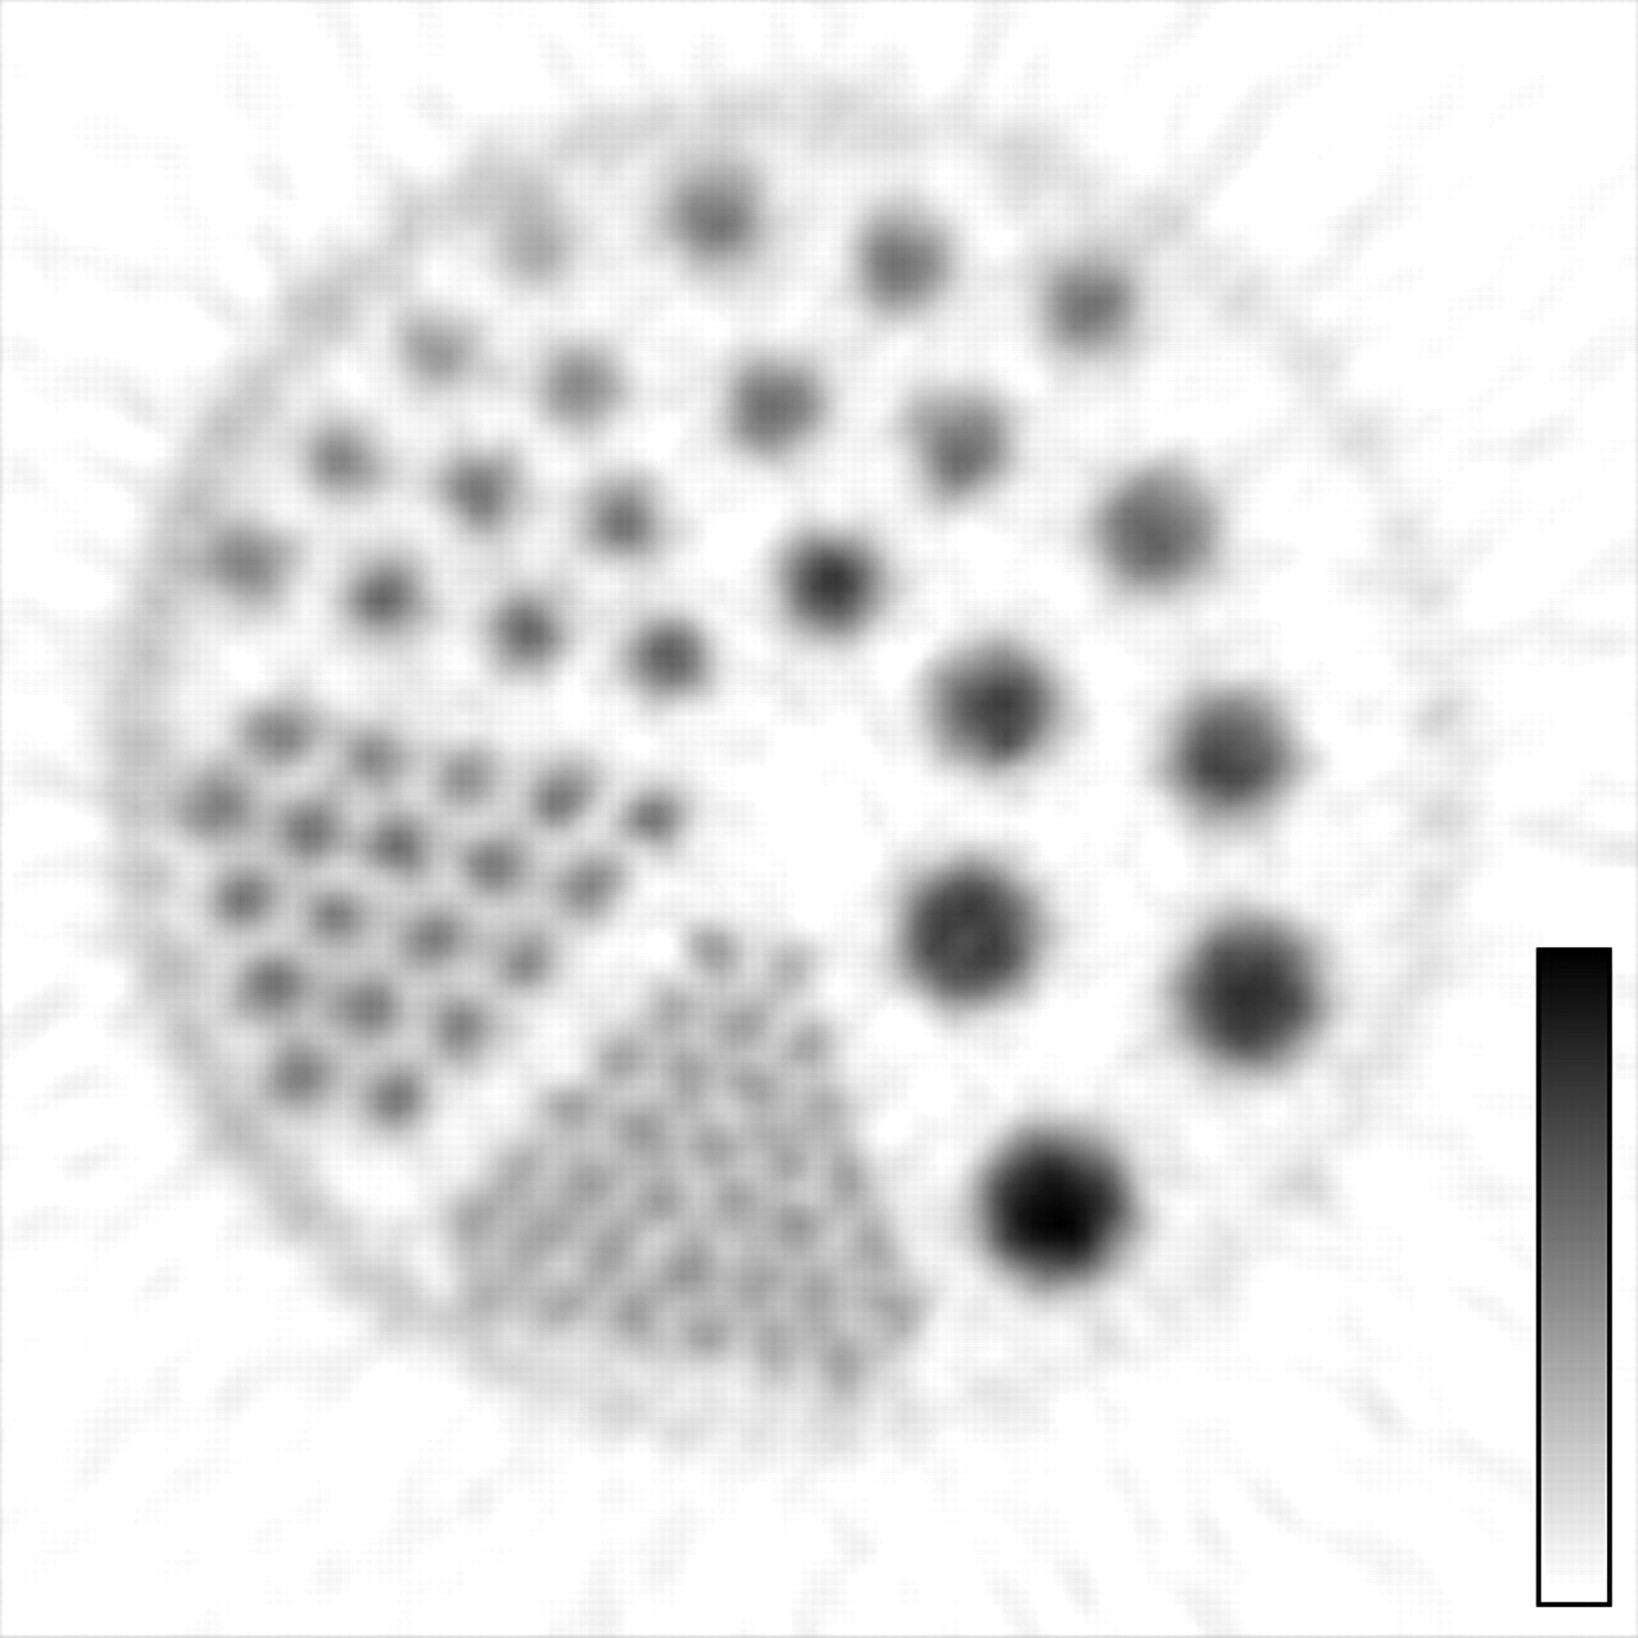
Image of Micro Deluxe phantom with hot-rod inserts—reconstructed using the 3DRP algorithm.
Animal Studies.
Figure 5 shows maximum-intensity projection (MIP) images of the 18F PET mouse bone scan. Bony structures in mouse, including spine, rib cages, and skull, are clearly visualized.
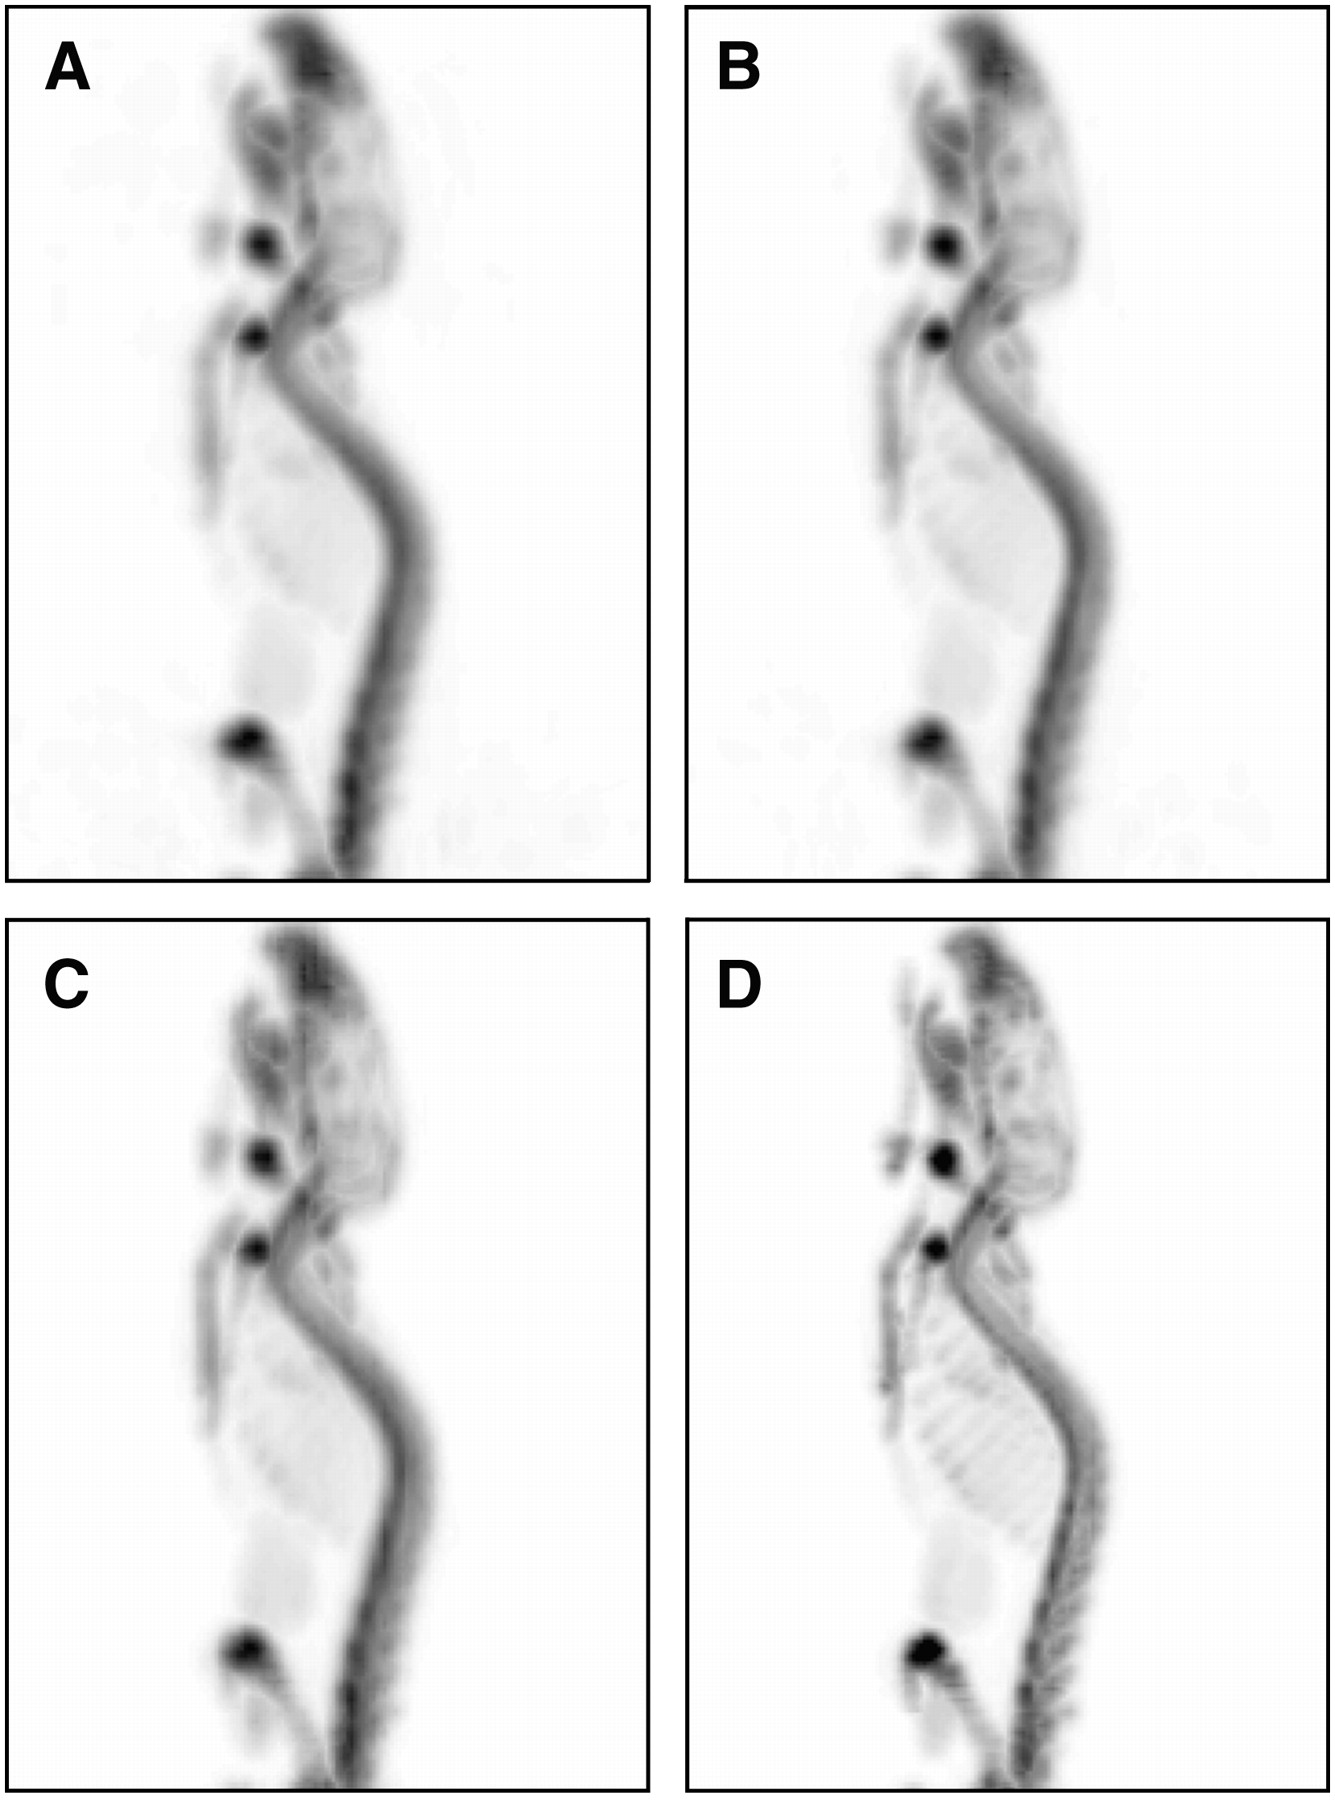
Maximum-intensity projection (MIP) images of mouse bone 18F PET reconstructed using different algorithms: (A) FBP, (B) 3DRP, (C) EM, and (D) MAP.
Figure 6A shows the heart images of a normal rat acquired 20 min after 18F-FDG injection. Uniform 18F-FDG uptake throughout the myocardium of the left ventricle was clearly resolved.
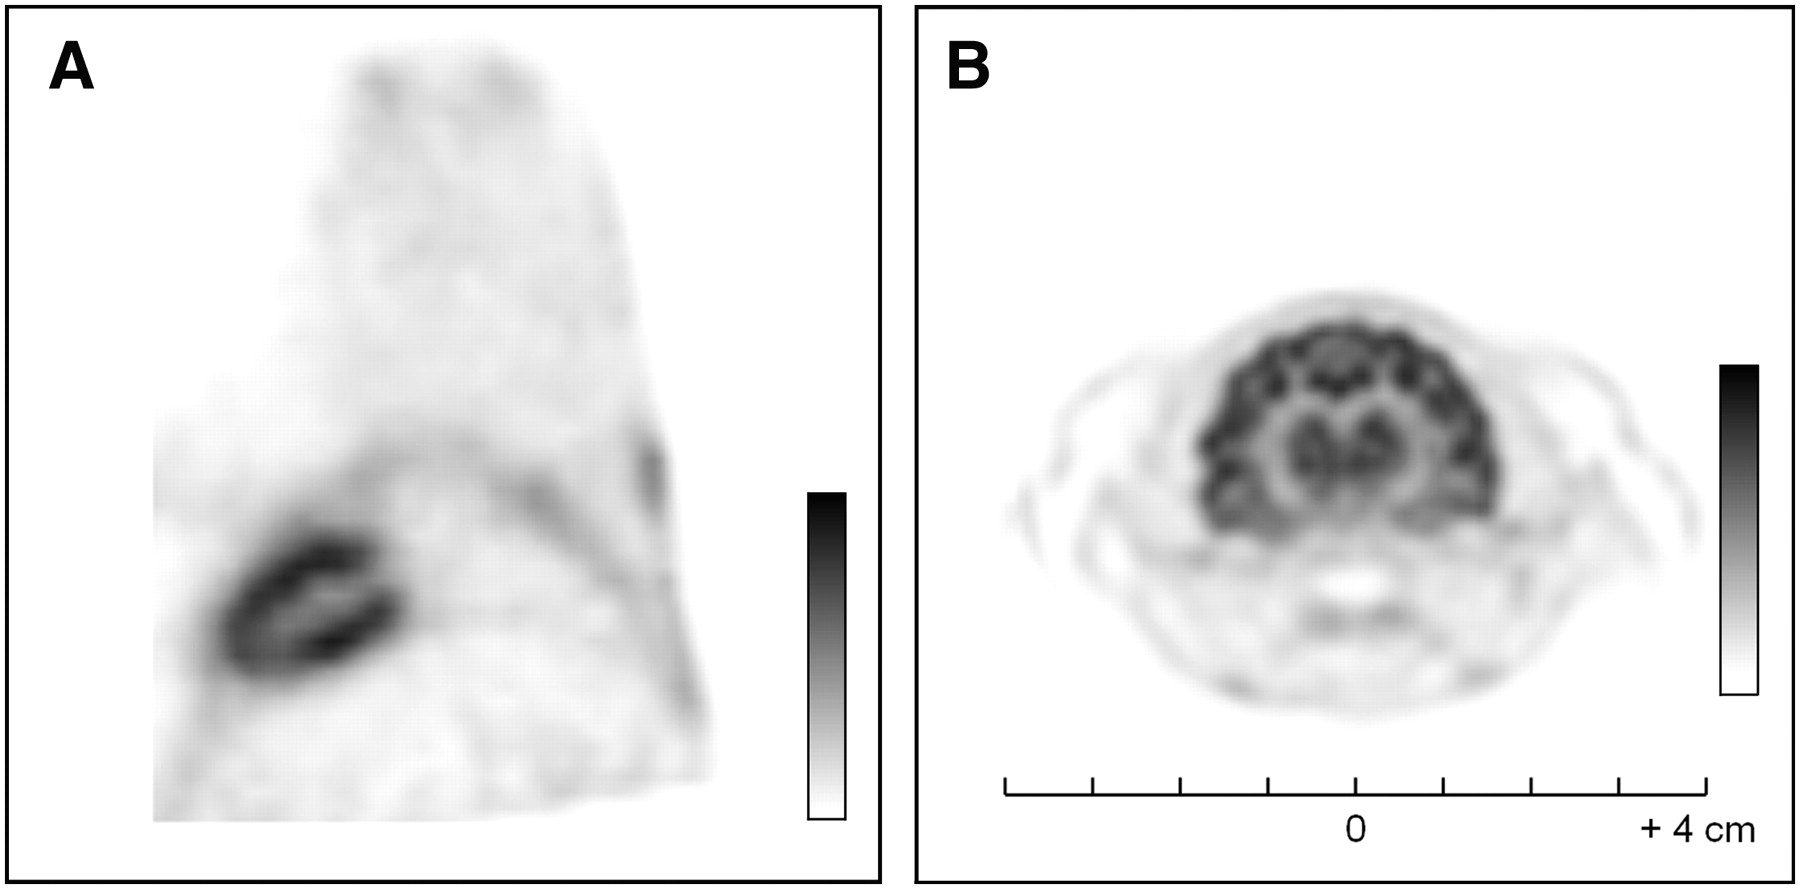
Selected animal imaging studies. (A) Myocardial PET image of rat in end-diastolic phase. (B) Cat brain PET image acquired using 18F-FDG and reconstructed using the MAP algorithm.
Figure 6B shows a cat brain 18F-FDG PET image and demonstrates the feasibility of this scanner for cat brain imaging. The whole head of the cat is included within the transaxial FOV and the brain cortex was no more than 2 cm from the center of the FOV. Figure 6B also demonstrates the substantially improved spatial resolution of this scanner (Fig. 14 in (19)), as the gyrus convolutions in the cat brain are well visualized.
DISCUSSION
In this study, we evaluated the performance characteristics of the F120 PET scanner. Results of our evaluation are summarized in Table 4 and compared with those of related previously published microPET series systems (i.e., R4 and F220) (12,19). The R4 is the forerunner of the F120; they have the same ring diameters and axial lengths but different crystal sizes (R4, 2.1 mm; Focus, 1.5 mm). The F220 has essentially the same detector and electronics as the F120 but a larger ring diameter (26 cm vs. 15 cm). The evaluation results (13) for the F120 produced by another group are also compared.
Comparison of Performance Characteristics in microPET Scanners
The average energy resolution was better for the F120 as compared with the R4 scanner (23%–18%) (19), which was equivalent to the result obtained using the F220 (12). Our results also show that the spatial resolution of the F120 has been remarkably improved (1.18 mm in the radial, 1.13 mm in the tangential, and 1.44 mm in the axial directions) as compared with the R4 (1.65, 1.66, and 1.84 mm, respectively) at the FOV centers (19). These results were obtained from 22Na point-source images reconstructed using FORE and 2D FBP. However, direct comparisons between these values are not appropriate because point sources with different diameters were used for the resolution measurements (1.0 mm in (19) and 0.25 mm in our study). After correcting for source dimension, differences between these values were diminished but the spatial resolution of the F120 (1.15, 1.10, and 1.42 mm) remained better than that of the R4 (1.31, 1.33, and 1.54 mm). Radial and tangential resolution values corrected for source dimension using the relationship below (30,31) for both scanners approximately matched predicted values (1.16 mm for F120 and 1.48 mm for R4): Eq. 3where, Dcrystal is the dimension of crystal elements, Dsystem is the ring diameter, p is the positron range (0.45 mm for 22Na) (32), and b2 is the plausible nonzero block factor (assumed to be zero).
In PET scanners of a small ring diameter and crystal size, such as the F120, radial spatial resolution in the peripheral region of the transaxial FOV is poorer than that at the FOV center. This is due to parallax errors caused when the photons impinge on the detectors at oblique angles (9). In this study, such degradations in radial resolution (parallax error) at the periphery of FOVs were observed (1.18 mm at the center vs. 2.35 mm at 2 cm off-center). However, this radial resolution at 2 cm off-center is similar to that of the GE eXplore VISTA (∼2 mm), which provides a 2-valued estimate of the depth at which an annihilation photon is absorbed by the phoswich crystal elements to avoid this problem The phoswich element consists of 2 different crystals (lutetium-yttrium oxyorthosilicate [LYSO] and germanium oxyorthosilicate [GSO)]), and the depth of interaction (DOI) is identified by measuring the decay time (LYSO, 40 ns; GSO, 60 ns) of the light pulse of each event. The DOI information allows the reduction of uncertainty in the interaction position and, as a consequence, the effects of parallax error. (33). Volume resolutions at center position were also similar for the 2 units (7.81 μL in F120 and 7.0 μL in VISTA). The images of cylindric phantoms with hot-rod inserts shown in Figure 4, and of cat brain shown in Figure 6B, also demonstrate that the spatial resolution is fairly homogeneous within a FOV of < 2 cm.
Sensitivity of the PET system is determined by several factors, which include solid angle, packing fraction, and scintillator efficiency for 511-keV photons. The sensitivity of the F120 unit was 2-fold that of the F220, although the solid angle of the F120 is only 60% larger than that of the F220. A possible source of this discrepancy is the different methods used to measure the sensitivity. Although we measured the absolute sensitivity free of photon attenuation and scatter using an extrapolation method (27), the sensitivity of the F220 in (12) was measured using a point source encapsulated in a stainless steel sleeve. It is likely that their sensitivity was underestimated because the scattered photons in the source housing were lost during the PET scan. The observed improvement in sensitivity of the F120 over the R4 was 55%.
The counting rate performance of a PET scanner is a function of several scanning parameters. In this study, we investigated counting rate performance in terms of the scatter fraction and the NECR in a wide range of situations to optimize the scan protocol. For both mouse and rat phantoms, peak NECR values were obtained with an energy window of 250∼750 keV and a coincidence window of 6 ns, although scatter fractions under these conditions were higher than those obtained with a narrower energy window. These scanning parameters are suitable for the F120 scanner in terms of counting rate performance. However, only qualitative comparisons are possible because different sized phantoms were used to obtain NECR measurements. The peak NECR of the F120 scanner was also much better than that of the R4 scanner (19) and noticeably higher than that of the F220 (12) (∼30% improvement) (Table 4). It seems, however, that the higher peak NECR for our mouse phantom compared with the R4 data is mainly due to the different diameters of the phantoms used for NECR measurements (3 cm in our work and 4.3 cm in (19)). When the same mouse-size phantom was scanned on the F120 and R4, similar peak NECR values were obtained (13). They explained that this was because the counting rate performance is limited by the data throughput at the host personal computer level.
Compared with the previous study by Laforest et al. (13), we measured spatial resolution at a smaller radial offset interval from FOV centers (i.e., in steps of 1 mm from 0 to 10 mm, and in steps of 2 mm from 12 to 32 mm) and used a smaller point source. Resolution was measured in the previous study at only 4 radial offsets. To more accurately determine the axial resolution at each radial position, we repeated each point-source measurement 4 times using different axial offsets. In addition, we measured the 3D sensitivity profile over the whole FOV. The detailed information obtained will be useful for predicting spatially varying partial-volume effects and for improving the spatial resolution of reconstructed PET images.
The resolution and sensitivity values measured in the present study were similar to those measured in the previous study (Table 4). However, scatter fraction and peak NECR differ because cylindric phantoms with different diameters were used. We used the phantoms with slightly larger diameters and obtained higher scatter fractions for both phantoms. For the rat phantom, a lower peak NECR was observed with a lower activity level. However, the peak NECR for mouse phantom was higher in our study, which is not concordant with the general relationship between the NECR peak and phantom size. There is also a discrepancy in the activity level at the NECR peak (4.34 mCi for our work and 2.4 mCi for Laforest et al.). Slow change in the NECR curves around the peak (especially in Laforest et al.) could be the reason for this difference in activity. Nevertheless, general trends were similar; the rat phantom showed a higher scatter fraction and a lower peak NECR, and the peak NECR was obtained with an energy window of 250∼750 keV and a coincidence window of 6 ns for both mouse and rat phantoms.
CONCLUSION
The results of this independent field test showed the improved physical characteristics of the F120 scanner over the previous microPET series systems. Compared with the R4 system, the energy resolution for the 511-keV photon and the volume resolution at the center were improved from 23% to 18.3% and from 5.1 μL to 1.92 μL, respectively. The observed improvement in sensitivity of the F120 over the R4 was 55%. The peak NECR of the F120 scanner was also much better than that of the R4 scanner. This system will be useful for imaging studies on the small rodents and the brains of larger animals.
Acknowledgments
This work was supported by the Real Time Molecular Imaging Research Program and the Basic Research Program (grant R01-2006-000-10296-0) of the Korean Science & Engineering Foundation funded by the Ministry of Science and Technology, Korea. The authors appreciate the experimental support of Sang Hee Han.
Footnotes
-
COPYRIGHT © 2007 by the Society of Nuclear Medicine, Inc.
References
- Received for publication February 12, 2007.
- Accepted for publication May 31, 2007.


Jump to section
Related Articles
Cited By...
- Immuno-PET Imaging of CD30-Positive Lymphoma Using 89Zr-Desferrioxamine-Labeled CD30-Specific AC-10 Antibody
- Performance Assessment of a Preclinical PET Scanner with Pinhole Collimation by Comparison to a Coincidence-Based Small-Animal PET Scanner
- Performance Evaluation of a New Dedicated Breast PET Scanner Using NEMA NU4-2008 Standards
- 3'-Deoxy-3'-[18F]Fluorothymidine Positron Emission Tomography Imaging of Thymidine Kinase 1 Activity After 5-Fluorouracil Treatment in a Mouse Tumor Model
- In Vivo PET/CT in a Human Glioblastoma Chicken Chorioallantoic Membrane Model: A New Tool for Oncology and Radiotracer Development
- NEMA NU 4-2008 Comparison of Preclinical PET Imaging Systems
- In Vivo Dopamine Transporter Imaging in a Unilateral 6-Hydroxydopamine Rat Model of Parkinson Disease Using 11C-Methylphenidate PET
- Preclinical Pharmacology of AZD5363, an Inhibitor of AKT: Pharmacodynamics, Antitumor Activity, and Correlation of Monotherapy Activity with Genetic Background
- Development of Small-Animal PET Prototype Using Silicon Photomultiplier (SiPM): Initial Results of Phantom and Animal Imaging Studies
- Performance Evaluation of the FLEX Triumph X-PET Scanner Using the National Electrical Manufacturers Association NU-4 Standards
- 89Zr-DFO-J591 for ImmunoPET of Prostate-Specific Membrane Antigen Expression In Vivo
- Cerenkov Luminescence Imaging of Medical Isotopes
- NEMA NU4-2008 Image Quality Performance Report for the microPET Focus 120 and for Various Transmission and Reconstruction Methods
- Dipeptidyl Peptidase IV Inhibition With MK0431 Improves Islet Graft Survival in Diabetic NOD Mice Partially via T-Cell Modulation
- Performance Evaluation of the Inveon Dedicated PET Preclinical Tomograph Based on the NEMA NU-4 Standards
- Spatial Resolution and Sensitivity of the Inveon Small-Animal PET Scanner
- Kinetic Modeling of 3'-Deoxy-3'-18F-Fluorothymidine for Quantitative Cell Proliferation Imaging in Subcutaneous Tumor Models in Mice
- Impact of Contamination from Scattered Photons in Singles-Mode Transmission Data on Quantitative Small-Animal PET Imaging
- Molecular-Genetic Imaging Based on Reporter Gene Expression
- Inhibition of Dipeptidyl Peptidase IV With Sitagliptin (MK0431) Prolongs Islet Graft Survival in Streptozotocin-Induced Diabetic Mice