


Abstract
The purpose of this work was to evaluate the performance characteristics of the preclinical X-PET subsystem of the FLEX Triumph PET/CT scanner based on the NU 4-2008 standards of the National Electrical Manufacturers Association (NEMA). Methods: The performance parameters evaluated include the spatial resolution, scatter fraction, count losses and random coincidences, sensitivity, and image-quality characteristics. The PET detector array consisted of 11,520 individual bismuth germanate crystals arranged in 48 rings and 180 blocks, with an axial field of view (FOV) of 11.6 cm and a inner ring diameter of 16.5 cm. The spatial resolution was measured with a small 22Na point source (diameter, 0.25 mm) at different radial offsets from the center. Sensitivity was calculated using the same source by stepping the source axially through the axial FOV of the scanner. Scatter fraction and counting-rate performances were determined using a mouse- and rat-sized phantom with an 18F line source insert. The NEMA image-quality phantom and rodent imaging were also performed to access the overall imaging capabilities of the scanner. Results: Tangential spatial resolution in terms of full width at half maximum varied between 2.2 mm at the center of the FOV and 2.3 mm at a radial offset of 2.5 cm. The radial spatial resolution varied between 2.0 at the center and 4.4 mm at a radial offset of 2.3 cm. The peak system absolute sensitivity was 5.9% at the center of the FOV. The absolute system sensitivity was 0.67 counts/s/Bq, and the relative total system sensitivity was 73.9%. The scatter fraction for the mouse-sized phantom was 7.9%, with a peak true counting rate of 168 kilocounts per second (kcps) at 0.3 MBq/mL and a peak noise-equivalent counting rate of 106 kcps at 0.17 MBq/mL. The rat-sized phantom had a scatter fraction of 21%, with a peak true counting rate of 93 kcps at 0.034 MBq/mL and a peak noise-equivalent counting rate of 49 kcps at 0.02 MBq/mL. Recovery coefficients for the image-quality phantom ranged from 0.13 to 0.88. Conclusion: The performance of the X-PET scanner based on the NEMA NU 4-2008 standards was fully characterized. The overall performance demonstrates that the X-PET system is suitable for preclinical research.
PET has proven a valuable emerging molecular imaging modality to detect and quantify biochemical processes in vivo. However, as one technology leads to its own advancements, PET is now advancing toward application-specific instrumentation, leading to the design of dedicated high-resolution and high-sensitivity clinical brain, prostate, and breast scanners and small-animal PET units for biomedical research. During the last 2 decades, biomedical research has made substantial progress in the use of small-animal models for studying human disease (1). Molecular imaging using dedicated small-animal PET scanners is now well established in the field of drug development and experimental studies using animal models of various diseases (2). After the development of the first dedicated rodent PET scanner at Hammersmith Hospital in collaboration with CTI PET Systems, Inc., various design concepts of preclinical PET scanners are continually being investigated, developed, and, in some cases, made commercially available through spin-off companies from university research (3–7). With the commercial introduction and widespread availability of preclinical PET systems, small-animal imaging is becoming readily accessible and increasingly popular (8).
The FLEX Triumph PET/CT scanner (Gamma Medica) is the first dedicated trimodality preclinical platform (9). This scanner consists of the X-PET subsystem, a commercialized version of the rodent research PET scanner developed by the M.D. Anderson PET instrumentation group (10), and a micro-CT subsystem. The FLEX system uses a compact solid-state–based SPECT detector and micro-CT subsystem and can be configured with either the X-PET (11) or the LabPET (12) as a PET subsystem.
Both X-PET and CT devices are mounted on the same gantry platform, allowing both functional and anatomic volumes to be imaged without any motion, apart from bed translation, of scanning volumes during the 2 procedures. The development of the X-PET subsystem was guided by key factors such as lower cost, higher sensitivity, and high spatial resolution (10). These factors are the driving force for the design and development of PET scanners dedicated for biomedical research. Usually, the acceptance of any new system is mainly determined by its technical specifications. Standardization of the assessment of system performance characteristics is thus highly desired (13,14). Recently, the National Electrical Manufacturers Association (NEMA) published its NU 4-2008 standards for performance evaluation of small-animal PET scanners (15). These standards provide consistent and standardized procedures for measuring scanner performance parameters for small-animal PET. They also document operational PET scanner performance as part of the quality-assurance program. However, until now few papers reported on the performance characterization of dedicated preclinical PET scanners using the NU 4-2008 standards (16–20). This work evaluates the overall performance characteristics of the X-PET subsystem of the FLEX Triumph preclinical PET/CT platform using the NEMA NU 4-2008 standards, including spatial resolution, scatter fraction, count losses and random coincidence measurements, sensitivity, and image-quality characteristics. The overall imaging capabilities of the scanner are also demonstrated through experimental phantom and rodent studies.
MATERIALS AND METHODS
System Description
The FLEX Triumph PET/CT platform belongs to the latest generation of preclinical PET/CT systems dedicated to rodent imaging. The X-PET subsystem is based on detector blocks arranged in 48 rings with a 10-cm transaxial field of view (FOV) and 11.6-cm axial FOV (AFOV). The PET detector array consists of 11,520 individual bismuth germanate crystals arranged in 180 blocks. The dimensions of each crystal are 2.32 × 2.32 × 9.4 mm in the axial, transaxial, and radial directions, respectively. This optimal design allows for unique properties such as low cost, high sensitivity, and large AFOV using an inexpensive crystal material arranged in a pixilated ring geometry. This scanner incorporates the photomultiplier-quadrant-sharing (PQS) method, which maximizes the number of crystals per photomultiplier that can be decoded, thus improving the spatial resolution. The sensitivity and light output are maximized using 96% crystal-packing fraction and no light guides. High-yield pileup event recovery electronic processing technology is used to improve counting-rate performance (21). The detector blocks are circularized by slightly grinding each block on the photomultiplier side into a pentagon and having the 2 end rows of crystals in each block tapered (10,11). PET data are acquired using a 250- to 750-keV energy window and 12-ns timing window in list-mode format, which can be binned into 3-dimensional (3D) sinograms corresponding to total and true events, respectively. The 3D sinograms can be further rebinned into 2-dimensional (2D) sinograms using either single-slice rebinning (22) or Fourier rebinning (23) approaches. Images can be reconstructed using either 2D analytic filtered-backprojection (FBP) or iterative methods, such as the ordered-subsets expectation maximization (OSEM) algorithm (24). The PET subsystem specifications are summarized in Table 1.
Summary of PET Subsystem Technical Specifications
Spatial Resolution
The spatial resolution of a PET scanner expresses its ability to distinguish between 2 small point sources. The spatial resolution is usually characterized by the width of the reconstructed point-spread function of compact radioactive point sources. The width of the point-spread function is here defined by its full width at half maximum (FWHM) and full width at tenth maximum (FWTM). In this study, spatial resolution was measured using 22Na point source having a nominal size of 0.25 mm and a nominal activity of 1.11 MBq, embedded in an acrylic cube (10.0 mm extent on all sides). Measurements were acquired with the source located at the axial center of the FOV and at one fourth of the AFOV from the center at the following radial distances from the center: 5, 10, 15, and 25 mm. At least 105 prompt counts were acquired per measurement. The list-mode data acquired at each location were histogrammed into 3D sinograms after random coincidences were corrected. Differences in detection efficiency were compensated using a self-normalization method (25). Three-dimensional sinograms were rebinned to 2D sinograms using Fourier rebinning with a maximum ring difference of 47. Images were reconstructed using 2D FBP with no smoothing. FWHM and FWTM of the point-source response function in all 3 directions (radial, tangential, and axial) were determined according to NEMA NU 4-2008 standards (15).
Scatter Fraction, Count Losses, and Random Coincidence Measurements
We measured the relative system sensitivity to scattered radiation and effects of system dead-time and rate of random coincidence events at various levels of source activity. Scatter fraction and counting-rate performances (true, random, scatter, and total event rates and the derived noise-equivalent counting rate [NECR]) were measured using 2 phantoms simulating the geometries of a mouse and rat. Both phantoms, specifically fabricated in accordance with NEMA NU 4-2008 standards, were made of a solid, right circular cylinder composed of high-density polyethylene (density, 0.96 ± 0.1 g/cm3). The mouse-sized phantom was 70 ± 0.5 mm long and 25 ± 0.5 mm in diameter. A cylindric hole (diameter, 3.2 mm) was drilled parallel to the central axis, at a radial distance of 10 mm. The rat-sized phantom had a diameter of 50 ± 0.5 mm and a length of 150 ± 0.5 mm, with a cylindric hole (diameter, 3.2 mm) drilled parallel to the central axis at a radial distance of 17.5 mm. The initial activity of 42 MBq for the mouse-sized phantom and 48 MBq for the rat-sized phantom was selected on the basis of previous experiments in which the counting rate was plotted against activity. The phantoms were placed in the center of the FOV (CFOV) parallel to the z-axis of the scanner. To measure the coincidence rate at different activity levels, sequential images were acquired every 30 min until the total activity decayed below 0.1 MBq. The duration of each acquisition varied from 180 to 600 s to compensate for the decay of 18F, thus allowing the collection of over 500,000 prompt counts. Data were acquired and processed according to NEMA NU 4-2008 standards. Corrections for intrinsic radioactivity were not necessary because the system used bismuth germanate as scintillation crystal (15).
The total event rate RTOT,i,j for each acquisition j of each slice i is computed as:
The true event rate Rt,i, for acquisition j of slice i is computed as:
The random event rate Rr,i,j for each acquisition j of slice i was computed as:
The scattered event rate Rs,i,j for acquisition j of slice i was computed as:
The scatter fraction for each acquisition j is computed using the following formula:
The NECR RNEC,i,j for each acquisition of each slice i is computed as:
The total system counting rates are computed as the sum of the above-mentioned rates over all slices i. The scatter fraction, count losses, and random coincidence analysis was implemented using a program developed in-house and implemented in MATLAB 7.4 (The MathWorks).
Sensitivity
The sensitivity, which is defined as the fraction of coincident annihilation photon pairs emitted from a source that are detected and counted by the scanner, was measured with the same 22Na point source used in the spatial resolution measurements. The source was positioned at the center of the scanner, both axially and transaxially. Counts were acquired at this location and at positions stepped axially at 5-mm increments, covering the AFOV of the whole scanner. The acquisition time was set to 1 s for each measurement to ensure the collection of at least 100,000 true events with a random–to–true event rate ratio of less than 1%. A background true event rate was determined by acquiring a dataset (1 s) in the absence of a radioactive source in the FOV. All data were analyzed according to NEMA NU 4-2008 standards (15).
The sensitivity (counts/s/Bq) was calculated as follows:
The relative (percentage) sensitivity for acquisition i is given by:
The system sensitivity for mouse and rat phantoms was computed as follows:
The total system sensitivity was computed as follows:
In addition, the axial sensitivity profile was obtained by plotting the sensitivity, SA,i, for each slice.
Image-Quality Characteristics
The purpose of measuring image quality is to produce images simulating those typically obtained in whole-body imaging studies of small rodents with hot lesions and uniform hot regions containing cold areas. To assess overall image quality and accuracy of corrections, the NEMA NU-4 image-quality phantom was filled thoroughly with 5.3 MBq of 18F and scanned for 20 min. Acquisition started when the activity decreased to 3.7 MBq. This phantom was specifically fabricated in accordance with NEMA NU 4-2008 standards (15) and is made up of polymethylmethacrylate (internal dimensions: length, 50 mm; diameter, 30 mm). A CT scan was acquired for attenuation correction using the X-O CT subsystem of the FLEX Triumph PET/CT scanner, with a tube voltage of 75 kVp and a tube current of 300 μA. The gantry rotated in continuous flying mode. A total of 512 projections were acquired in a full 360° scan, with 2 × 2 binning and 1,184 × 1,120 projection matrix size. Images were reconstructed using a modified 3D cone-beam Feldkamp algorithm resulting in a 0.17 × 0.17 × 0.17 mm voxel size for a 512 × 512 × 512 image volume. CT images were further processed and used for attenuation correction of the corresponding PET data of the image-quality phantom (26). The attenuation-corrected PET sinograms were reconstructed using 2D OSEM (4 iterations, 10 subsets) resulting after interpolation in a 256 × 256 × 256 image matrix with an isotropic voxel size of 0.4 × 0.4 × 0.4 mm. A 22.5-mm-diameter (75% of active diameter) by 10-mm-long cylindric volume of interest (VOI) was drawn over the center of the uniform region of the image-quality phantom. The average activity concentration, maximum and minimum values in the VOI, and the percentage SD (%SD) were calculated. The reconstructed image slices covering the central 10-mm length of the rods were averaged to obtain a single slice of lower statistical noise. Circular regions of interest were drawn around each rod having diameters corresponding to twice the physical diameter of the rods. The mean and SD of the recovery coefficient (RC) for each rod size was analyzed in accordance with NEMA NU 4-2008 standards (15). The accuracy of attenuation correction was tested by drawing VOIs in the water- and air-filled cylindric inserts. The diameter of the VOI was 4 mm and encompassed the central 7.5 mm in length in the axial direction. The ratio of the mean in each cold region to the mean of the hot uniform area was reported as spillover ratio (SOR).
The SD of the RCs is calculated as follows:
RESULTS
Spatial Resolution
The results of the radial, tangential, and axial spatial resolution in terms of FWHM and FWTM (mm) are graphically presented in Figure 1 as a function of radial and axial offsets. The measured data at the CFOV of the scanner (z = 0 mm) and at one fourth of the AFOV from the center (z = 29 mm) were analyzed, as suggested in the NEMA NU 4-2008 standards. The volumetric resolution in the CFOV was 12 μL. The volumetric resolution increased with increasing radial offset. The volumetric resolution at one fourth of the AFOV was 14 μL. The radial FWHM varied between 2.0 mm in the CFOV and 2.3 mm at a radial offset of 25 mm, whereas the axial FWHM ranged between 2.8 and 3.2 mm for the same radial offset. The tangential resolution was more or less constant over the whole transaxial FOV for all radial offsets. As expected, the depth of interaction effect causes a degradation of the radial resolution as the radial offset is increased.
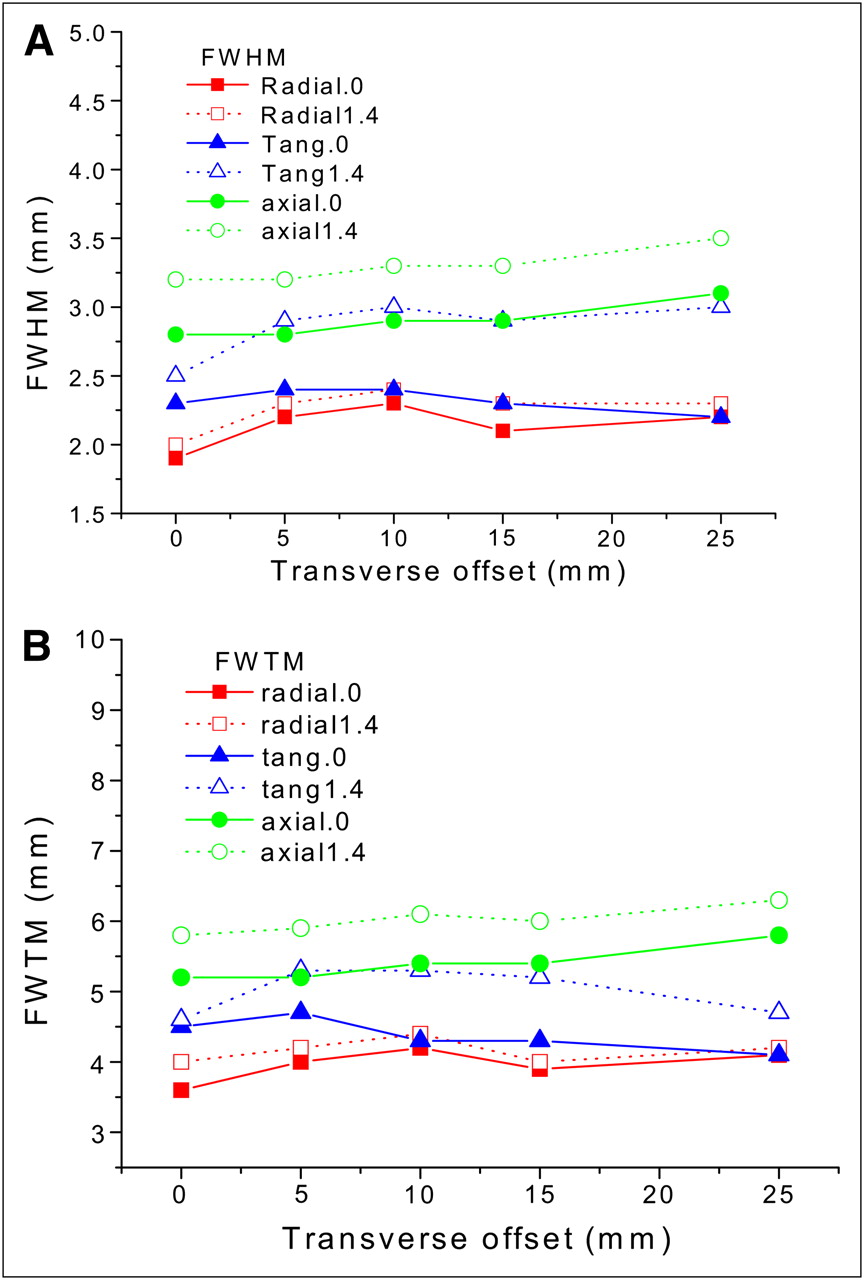
Radial, tangential, and axial spatial resolution as function of radial offset reported in terms of FWHM (A) and FWTM (B). Data were measured at 2 axial positions: at center of AFOV and at one fourth from center of AFOV. Tang. = tangential.
Scatter Fraction, Count Losses, and Random Coincidence Measurements
Figure 2 shows the counting-rate performance of the scanner for the mouse- and rat-sized phantoms. The activity injected in each cylindric phantom was divided by its corresponding volume. The volumes of the mouse and rat phantoms were 34.36 and 294.5 mL, respectively. More specifically, the total, true, random, scatter, and NECRs are plotted as a function of the average effective activity concentration for both mouse- and rat-sized phantoms. The scatter fraction for the mouse-sized phantom was 7.9%, with a peak true counting rate of 168 kilocounts per second (kcps) at 0.3 MBq/mL and a peak NECR of 106 kcps at 0.17 MBq/mL. The rat phantom had a scatter fraction of 21%, with a peak true counting rate of 93 kcps at 0.034 MBq/mL and a peak NECR of 49 kcps at 0.019 MBq/mL.

Counting-rate performance plots as function of average effective activity concentration of line source for both mouse-sized (A) and rat-sized (B) phantoms.
Sensitivity
In accordance with NEMA NU 4-2008 standards, the system sensitivity is the sum of the sensitivity calculated for each slice. The total sensitivity for the mouse length (central 7-cm AFOV) was 0.579 counts/s/Bq whereas the total absolute sensitivity was 63.8%. The total sensitivity for the rat phantom (11.4-cm AFOV) was 0.67 counts/s/Bq, whereas the total absolute sensitivity was 73.9%. The system peak absolute sensitivity was 5.9%. The axial sensitivity profile obtained by plotting the absolute sensitivity SA for each slice number is shown in Figure 3.

Axial absolute sensitivity profile along z-axis of PET scanner using maximum ring difference of 47.
Image-Quality Characteristics
The sinograms derived from the list-mode file were reconstructed using both 2D FBP and 2D OSEM reconstruction algorithms. The datasets were corrected for attenuation (26) but not for scatter—scatter correction is under development. The mean, maximum, and minimum activity concentration estimates and percentage SD (%SD) calculated from the drawn VOIs on the uniform section of the image-quality phantom are summarized in Table 2. The RCs for the different rods along with absolute SD (%SD) are shown in Figure 4. The SORs obtained for the water- and air-filled inserts of the image-quality phantom are reported in Table 3 along with the %SD. These values represent the contribution from spillover and scattered events in the reconstructed image of the phantom. Representative images of the NEMA image-quality phantom are shown in Figure 5, illustrating a transaxial view of the 5 rods, a coronal view of the NEMA image-quality phantom, a transaxial view of the uniform region of the phantom, and a profile across the uniform area. The regions of interest defined for quantitative analysis are also shown.

RCs and SD for 5 rods of different sizes, ranging between 1 and 5 mm calculated using both 2D FBP and 2D OSEM reconstruction algorithms.
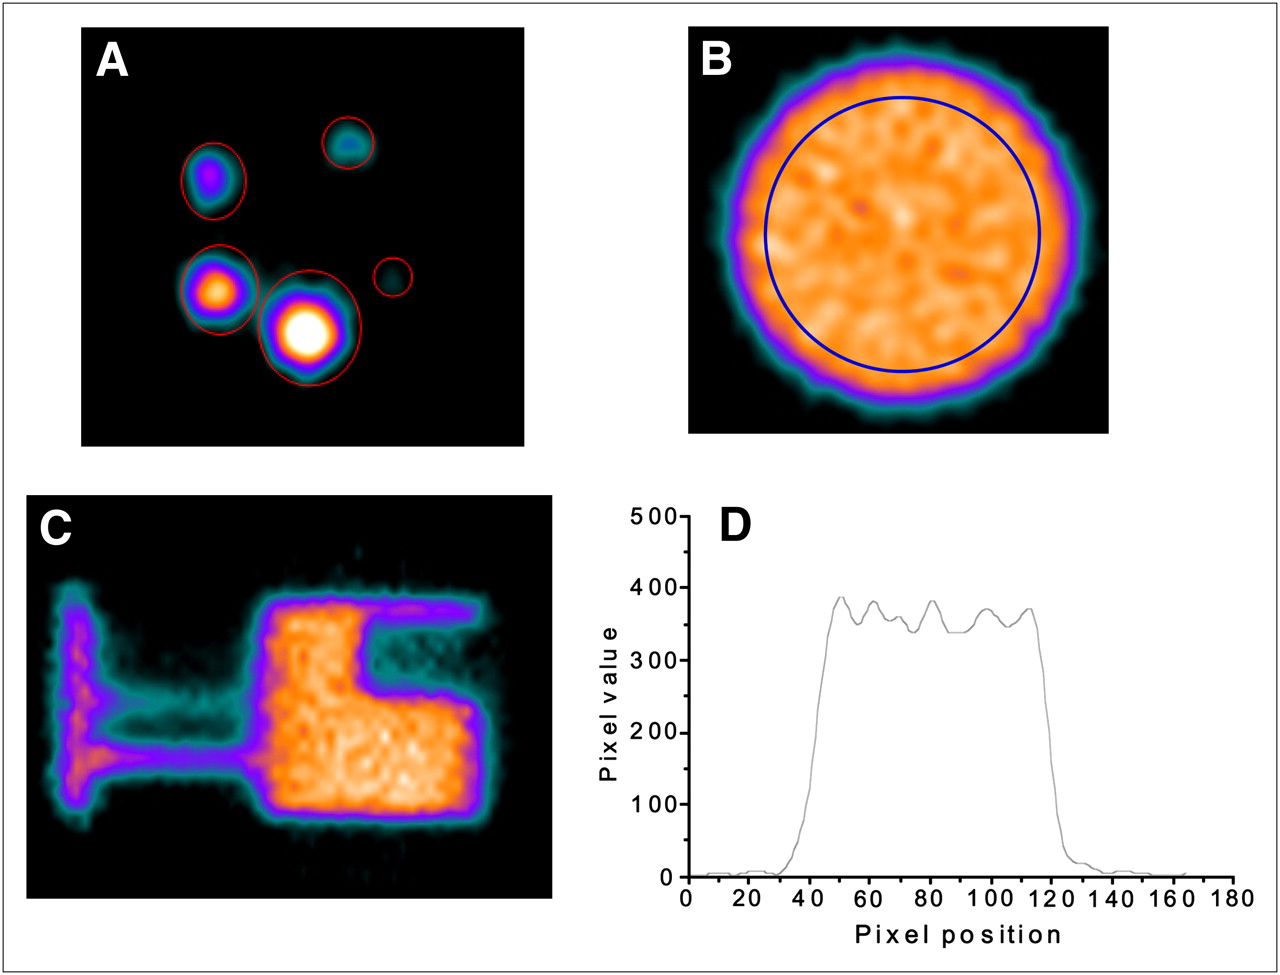
Images of NEMA NU-4 image-quality phantom scanned during 20 min with 18F (3.7 MBq) showing transverse plane corresponding to 5-rod region, with regions of interest defined on each rod (A), transverse plane of uniform region (B), coronal view (C), and line profile across uniform area of phantom (D). Defined regions of interest for quantitative analysis are also shown.
Uniformity Analysis Results in Terms of Mean, Maximum, and Minimum Activity Concentration Values
SORs and %SD for Both 2D FBP and 2D OSEM Reconstruction Algorithms
DISCUSSION
Characterization and performance evaluation are the first and foremost tasks of any PET scanner quality-assurance program. In this work, the overall performance of the FLEX Triumph preclinical PET subsystem was assessed using the newly published NEMA NU 4-2008 standards (15). These standards provide a common platform for measuring the performance of various scanners using specific protocols and guidelines. To the best of our knowledge, there is a lack of published reports on performance evaluation of the FLEX Triumph X-PET system based on NEMA NU 4-2008 standards. However, a few articles documented the performance assessment of other preclinical PET scanners using these standards (16–20).
Spatial resolution results demonstrate that the tangential resolution remains more or less constant over the whole transaxial FOV. Degradation of radial resolution is observed as a function of radial offset. This can be attributed to the depth-of-interaction effect, which leads to larger transaxial parallax errors and hence causes a degradation of the radial resolution as the radial offset increases. The parallax effect—due to crystal penetration in the axial direction and the large setting of the maximum ring difference (maximum allowed, 2 × Nrings − 1 = 47), which is known to degrade spatial resolution (27)—causes deterioration of the axial spatial resolution at large radial offsets when the 3D data are rebinned using a single-slice method (data not shown). The axial spatial resolution can be improved by reducing the maximum ring difference at the cost of reduced sensitivity (28) and also by rebinning the data using Fourier rebinning (Fig. 1). However, the nonuniformity of spatial resolution can be recovered to a great extent using fully 3D statistical iterative reconstruction algorithms through the accurate modeling of PET scanner response (29,30). The obtained results for radial and tangential resolutions are consistent with those reported for the rodent research PET by the M.D. Anderson PET instrumentation development group (31). Moreover, our FWHM values are larger than published results (17,32). Corrections for the size and shape of the source and noncollinearity of positron annihilation were not performed. The spatial resolution results of this system are worse than those reported for other small-animal PET designs having smaller crystal sizes (17,32).
The counting-rate performance was studied in terms of the total, true, random, and scatter event rates, and NECRs, along with scatter fraction. Our results show that the X-PET has excellent counting-rate performance thanks to high-yield pileup event recovery electronics. The system achieved a peak true counting rate of 168 kcps at an average activity concentration of 0.3 MBq/mL and 93 kcps at an average activity concentration of 0.034 MBq/mL for mouse- and rat-sized phantoms, respectively. The peak NECR was 106 kcps at an average activity concentration of 0.17 MBq/mL for a mouse-sized phantom and 49 kcps at an average activity concentration of 0.019 MBq/mL for a rat-sized phantom. The scatter fraction measured at low-activity concentration for the mouse- and rat-sized phantoms was 7.9% and 21%, respectively. The NECR for the mouse-sized phantom is higher than the NECR for the rat-sized phantom because there is less photon attenuation of the true counting rate in addition to lower scatter and random counting rates. As expected, the NECR for the mouse-sized phantom peaks at a higher activity concentration than the NECR for the rat-sized phantom because the true counting rate decreases more rapidly than the random counting rate as the object size increases (33). Our NECRs for the rat-sized phantom are lower than those reported by Baghaei et al. (31). The reasons for this discrepancy are mainly different PET scanner operational settings and the use of different phantoms (uniform cylinder, compared with a line source in a uniform cylinder in our case); however, more important is the fact that our data were analyzed according to the new NEMA 4-2008 standards, whereas the data of Baghaei et al. (31) were taken directly from the hardware specifications. Saturation of counting rate was observed at an activity concentration of 0.53 MBq/mL for the mouse-sized phantom and at 0.073 MBq/mL for the rat-sized phantom because of the high dead-time of the scanner. However, these activity concentrations are much higher than the activity concentration typically obtained in animal studies. The scatter fraction results are comparable with the results obtained for the Inveon scanner, namely 7.8% and 17.2% for a mouse- and rat-sized phantoms, respectively (17).
The sensitivity of a PET scanner depends on various factors, such as solid-angle coverage, packing fraction, and scintillator efficiency for 511-keV photons (34). The system peak absolute sensitivity for an energy window of 250–750 keV and a timing window of 12 ns is 5.9%, as compared with 9.32% for the Inveon scanner with an energy window of 250–625 keV and a timing window of 3.432 ns (17). The axial sensitivity profile shows a linear drop of sensitivity from the center to the edge of the FOV (Fig. 3). The results of the NEMA image-quality tests provide a common and standardized evaluation of the overall image quality achievable by a small-animal PET scanner. The mean VOI values in the uniform region obtained using 2D OSEM reconstructions are slightly lower than those obtained using 2D FBP. Similar trends were reported elsewhere (18). The RCs for 5 different rods ranged from 0.13 to 0.88, with SD varying between 8% and 5.4% (Fig. 4). These RCs are slightly lower than those reported (0.17–0.93) for the Inveon PET scanner (17), in part because our image-quality data were not corrected for scatter. Noncorrection for scatter is being addressed now through the implementation of appropriate CT-based scatter-compensation techniques (35). Moreover, the lower spatial resolution of the system intrinsically results in considerable partial-volume effect. Compared with 2D FBP for all rods, slightly higher RCs and lower %SDs were obtained for 2D OSEM. SORs of water- and air-filled cylinders for 2D OSEM were 0.09 and 0.10, with SD of 8.2% and 6.1%, respectively, which are comparable to corresponding values reported for the MiniPET-II scanner (19). Slightly lower SOR and lower %SD values were obtained for 2D OSEM than for 2D FBP.
Despite the fact that the FLEX Triumph X-PET scanner is capable of producing high-quality images suitable for molecular imaging research, the performance capabilities of the imaging system that determine the accuracy and precision to which the resulting signal may be measured still need to be improved through reconstruction using accurate statistical modeling and implementation of CT-based PET quantitative correction procedures to compensate for the various image degrading factors including scatter and partial-volume effect.
CONCLUSION
The performance of the X-PET subsystem of the FLEX Triumph PET/CT scanner has been fully characterized using the newly proposed NEMA NU 4-2008 standards. The results indicate that the scanner has a good spatial resolution across the FOV and a high sensitivity. The counting-rate performance measurements indicate that the scanner is well suited for imaging rodents using low-activity concentrations. The scatter fractions measured for the mouse- and rat-sized phantoms are relatively small. The image-quality phantom results indicate that the image uniformity and RCs are reasonable. However, these values can still be improved by applying appropriate data correction procedures including CT-based scatter and partial volume corrections. Imaging studies of the image-quality phantom and rodents clearly demonstrate good imaging capabilities. The overall performance shows that the FLEX Triumph X-PET system is suitable for preclinical imaging-based research.
Acknowledgments
This work was supported by the Swiss National Science Foundation under grant SNSF 3152A0-102143.
- © 2010 by Society of Nuclear Medicine
REFERENCES
- Received for publication February 11, 2010.
- Accepted for publication July 8, 2010.


