


Abstract
Dopamine transporter (DAT) function is altered by many neurodegenerative diseases. For instance, in Parkinson disease DAT density has been shown to decrease in early disease and to play a role in the occurrence of motor complications. DAT is thus an important imaging target with potential therapeutic relevance in humans and animal models of disease. The PET DAT marker 11C-methylphenidate is commonly used to quantify DAT function. Here we investigate the characteristics of the 11C-methylphenidate–derived quantification of DAT in rodents using the 6-hydroxydopamine Parkinson disease rat model. Methods: Seven unilaterally 6-hydroxydopamine–lesioned rats (dopaminergic denervation [DD] range, 36%–94%) were injected with 3.7 MBq/100 g of body weight and tracer masses ranging from 93.8 to 0.0041 μg/100 g of body weight. We evaluated the maximum available transporter density and the in vivo (apparent) ligand-transporter dissociation constant (Bmax and
Toxin-induced and transgenic rodent models of human disease are becoming increasingly more relevant to the investigation of specific disease mechanisms and pathogenesis and the evaluation of potential effects of novel treatment strategies. Although potentially quite informative, animal models must be validated against human disease. Noninvasive molecular imaging, such as PET, can aid by providing common investigative protocols in which biologically relevant outcomes can be directly compared. To ensure a meaningful comparison, rodent brain imaging must be accurately characterized to avoid potential methodologic confounding effects due to the smaller size of the rodent brain and potential differences in tracer metabolism and binding. Although dedicated small-animal scanners, capable of approximately (1.5 mm)3 resolution, partially address the imaging resolution limitations, a stricter limit on the amount of administered tracer must be used to avoid pharmacologic effects. Given that the injected tracer radioactivity dose needs to be maintained sufficiently high to obtain statistically meaningful data, the tracer must be produced at a specific activity (SA) high enough to ensure negligible tracer mass effect. This limit, together with potential differences in tracer binding and metabolism, are tracer- and species-dependent and must be characterized for each case separately.
Multitracer PET of the dopaminergic system has been performed for decades on human subjects with Parkinson disease, a debilitating condition of still unknown etiology, affecting approximately 300/100,000 of the general population (1) and characterized by dopaminergic neuronal degeneration. There is ample evidence that the membrane dopamine transporter (DAT) is affected by disease. The nature of the implication of DAT in Parkinson disease is controversial: it could contribute to the origin of the disease (2–5), or it could delay the onset of clinical symptoms by compensatory downregulation (6). It might also be functionally associated with an increased risk of occurrence of treatment-related motor and psychiatric complications (7–9). DAT has also been used as a surrogate marker of treatment efficacy, with inconsistent outcomes (10–12). These unresolved questions render DAT an important target of investigation. A radiotracer commonly used to evaluate DAT binding availability in humans is 11C-methylphenidate. We thus undertook a characterization of DAT imaging with 11C-methylphenidate in the commonly used 6-hydroxydopamine rat model of Parkinson disease (10,13,14). We estimated the typical maximum available transporter density and in vivo (apparent) ligand-transporter dissociation constant (Bmax and
MATERIALS AND METHODS
Group-Derived Bmax and K d app
Data from the control striatum from all animals (here denoted as group) were used to determine the group-derived Bmax and
Determination of Bmax and K d app
The MLCTA (20) is based on the relation between the equilibrium concentration of the bound ligand (B) and the free and nonspecifically bound ligand (F). In addition to Equation 1, two other relationships were used to estimate the relevant parameters from the data of each animal and each striatum separately:
Here BPND represents the tissue input–derived binding potential extrapolated to zero transporter occupancy and B (pmol/mL) is the bound tracer calculated as (S − C)/SA, where S and C are cerebellar and striatal radioactivity concentrations averaged from 30 to 60 min of the scan. Equations 3 and 4 are equivalent if the tracer has reached equilibration during the scan and if F is the same in the target and reference region. Equation 4 differs from Equation 1 only to the extent that it requires a linear instead of a nonlinear fitting method. In light of the results obtained when estimating the group-derived Bmax and
Again, here NS is the parameter estimated from the group analysis using Equation 2. Two parameters were obtained from each fit (either BPND and
SA Limits* and Tracer Amount Range Used for Imaging
DD Severity Estimate
Denervation severity (DD) was estimated from the measured (B/F)e values as
The least biased estimate of DD was deemed to be that obtained with (B/F)e estimated from the high-SA scans, since it best approximates the true BPND. An estimate of DD was also obtained as:
If indeed 6-hydroxydopamine lesioning results in a change in Bmax and not
Occupancy
Transporter occupancy was defined as Occ = 1 − (B/F)e SA/(B/F)e highSA (15) and as Occ−NS = 1 − ((B/F)e SA − NS)/(1 − (B/F)e highSA − NS), was plotted as a function of log10(1/SA), and was fitted to the expression Occ = 1/(1 +
Chemistry, Stock Solution Preparation, and SA Adjustment and Measurement
11C-methylphenidate was synthesized using a published method (21) and provided greater than 95% radiochemically pure d-threo-11C-methylphenidate with SA of greater than 55.5 kBq/pmol at the end of synthesis. A known amount of 11C-methylphenidate, ranging from 12.5 to 125 μg, was added to the high-SA 11C-methylphenidate sample using the stock solution (supplemental material, available online at http://jnm.snmjournals.org).
Animals
Seven male Sprague–Dawley rats (604 ± 39 g at the time of scanning) unilaterally lesioned with 6-hydroxydopamine were included in the study. Lesioning was performed as previously described (22). Briefly, the animals were anesthetized with isoflurane and placed in the stereotactic headholder with the skull flat between lambda and bregma. A 2% solution of 6-hydroxydopamine hydrobromide was infused at 2 sites (2 animals) along the medial forebrain bundle. Five animals had only 1 infusion of the 6-hydroxydopamine solution at 1 site so as to achieve a varying degree of denervation. Approximately 30 min before the 6-hydroxydopamine infusion, the animals were given desipramine (25 mg/kg intraperitoneally) to protect noradrenergic fibers (23). The animals were allowed at least 3–4 wk recovery before undergoing the PET studies.
Scanning
The rats were anesthetized and maintained with a 2% isoflorane/O2 gas mixture. All studies were performed on a Siemens/Concorde microPET Focus 120 (24). Each rat was positioned in a stereotactic headholder mounted to the scanner bed, allowing accurate repositioning of the animal within the ear bars and the mouthpiece. After a 6-min transmission scan with a 57Co source, a 61-min-long dynamically acquired emission scan was performed starting at injection (supplemental material). A 3.7-MBq bolus of tracer per 100 g of body weight was administered, with SA ranging from 0.009 to 191 kBq/pmol, corresponding to a tracer mass ranging from 93.8 to 0.0041 μg/100 g of body weight as detailed in Table 1.
To limit the amount of time the rats were kept under anesthesia, each rat underwent at most 2 scans per day, for which the 2 tracer injections were administered 120 min apart. The higher-SA scan was always performed first to minimize potential residual tracer occupancy effects. All procedures were approved by the University of British Columbia Animal Care Committee.
Data Analysis
The high-SA tracer scan was used as a reference image for analysis of the medium- and low-SA scans. First, a brain atlas (25) was manually coregistered to the brain area in the high-SA scans summed over data from the entire dynamic sequence (supplemental material). Using the coregistered atlas for guidance, we placed a rectangular (2.6 × 3.5) mm2 region of interest on each striatum on 3 consecutive transaxial planes (plane thickness, 0.796 mm) and a (6.9 × 2.6) mm2 region of interest on the cerebellum. The regions of interest were then replicated on each frame of the dynamic sequence for the extraction of a time–activity curve. Each medium- and low-SA scan was coregistered to the high-SA scan. The regions of interest defined on the high-SA scan were carried over to the coregistered medium- and low-SA scans for time–activity curve extraction.
RESULTS
Comparison of (B/F)e Obtained with the Logan and SRTM Methods
Excellent correlation between (B/F)e obtained with the Logan and the SRTM methods was observed throughout the range of estimated (B/F)e (0.08–1.45) with (B/F)e (SRTM) = 0.984, (B/F)e (Logan) −0.0008 and r2 = 0.996. The mean (B/F)e value across animals at high SA was 1.32 ± 0.16 (mean ± SD) with the SRTM method and 1.35 ± 0.17 (mean ± SD) with the Logan method. We thus arbitrarily decided to use only the SRTM-derived (B/F)e in all subsequent analyses.
Group-Derived Bmax and K d app
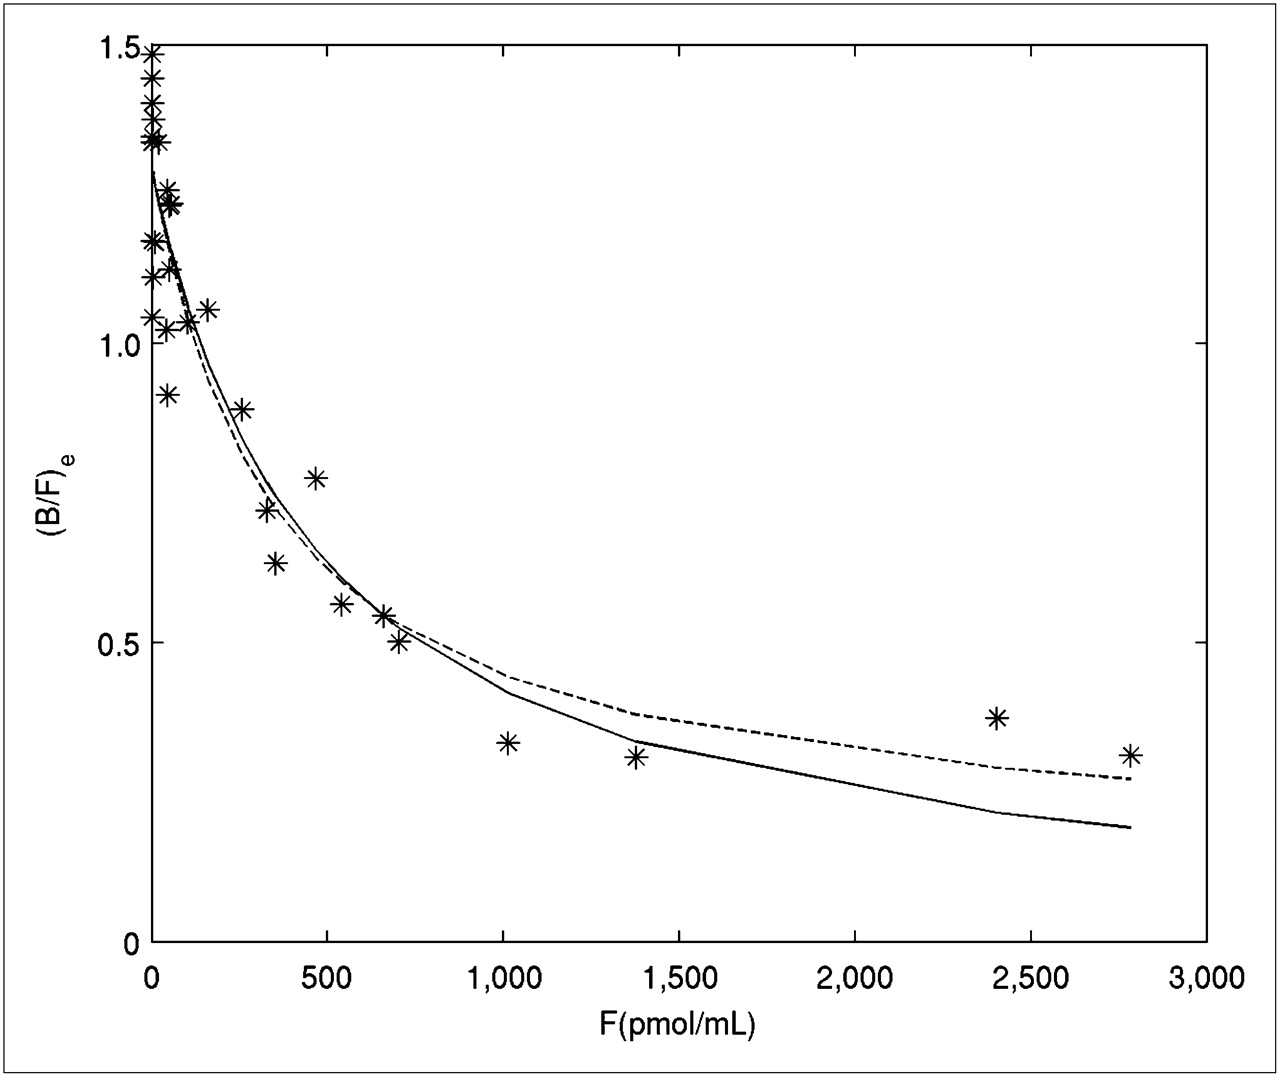
(B/F)e as a function of F for the control striatum and the corresponding nonlinear fits obtained with Equations 1 and 2 are shown in Figure 1. The fit with the expression including the NS term (Eq. 2) outperformed that without the NS term (Eq. 1) according to the Akaike information criterion and visually accounted better for the observed trend in the data at high values of F (low SA). The corresponding NS value was 0.14. Group-derived Bmax,

(B/F)e evaluated with SRTM vs. F derived from radioactivity concentration in cerebellar region fitted according to Equation 1 (solid line) and Equation 2 (dashed line) for control striatum of all animals.
Determination of Bmax and K d app
Individual Bmax and
Bmax and  for Individual Rats (R1–R7): Control Side

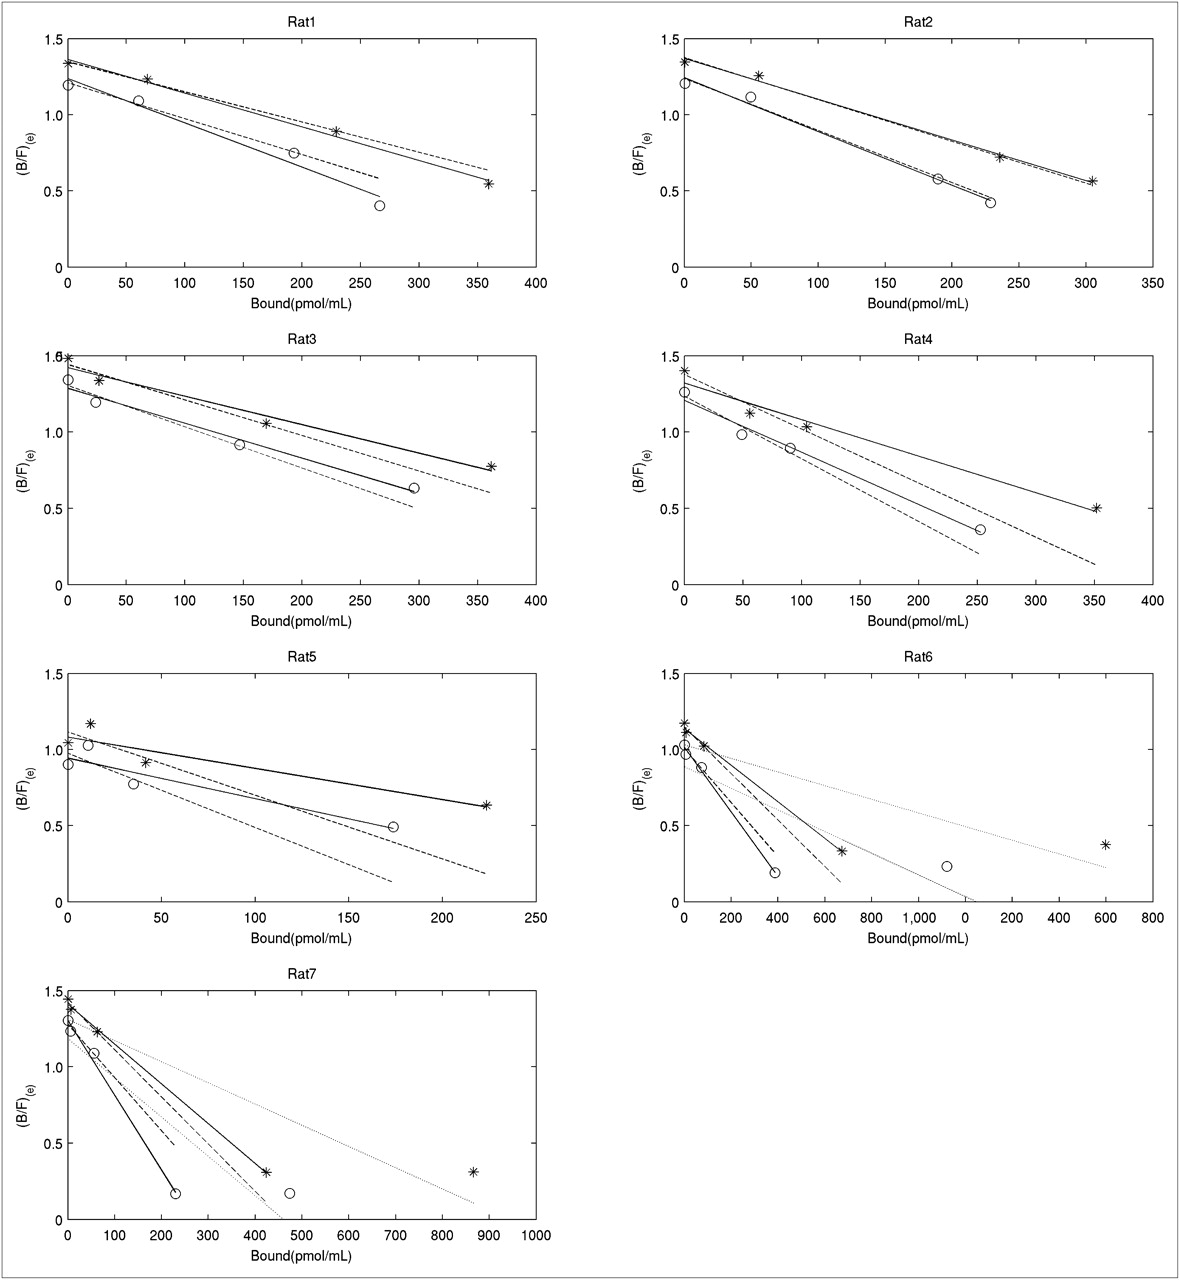
Scatchard plots for control side obtained with Equation 4 without NS term (*), and Equation 5 with NS term subtracted (○). Solid lines were obtained with 4-point fit, dashed lines with 3-point fit, and dotted lines with 5-point fit (2 rats only).
Determination of Bmax and K d app
Results for the lesioned side are shown in Figure 3 and detailed in Supplemental Table 1. The fits to the data became increasingly less reliable with higher denervation severity; for example, for rats 4 and 5 a reliable estimate for

Scatchard plots for lesioned side obtained with Equation 4 without NS term (*), and Equation 5 with NS term subtracted (○). Solid lines were obtained with 4-point fit, dashed lines with 3-point fit, and dotted lines with 5-point fit (2 rats only).
DD Severity Estimate
Figure 4 shows the DD estimated according to Equations 6 and 7. The DD estimate without subtraction of the NS term exhibits a clear dependence on tracer SA, especially at higher DD levels. Such dependence decreases with subtraction of the NS term. This finding is consistent with a difference in nondisplaceable binding between the striatum and reference region, which becomes increasingly more relevant for low (B/F)e values (low amount of specific binding).

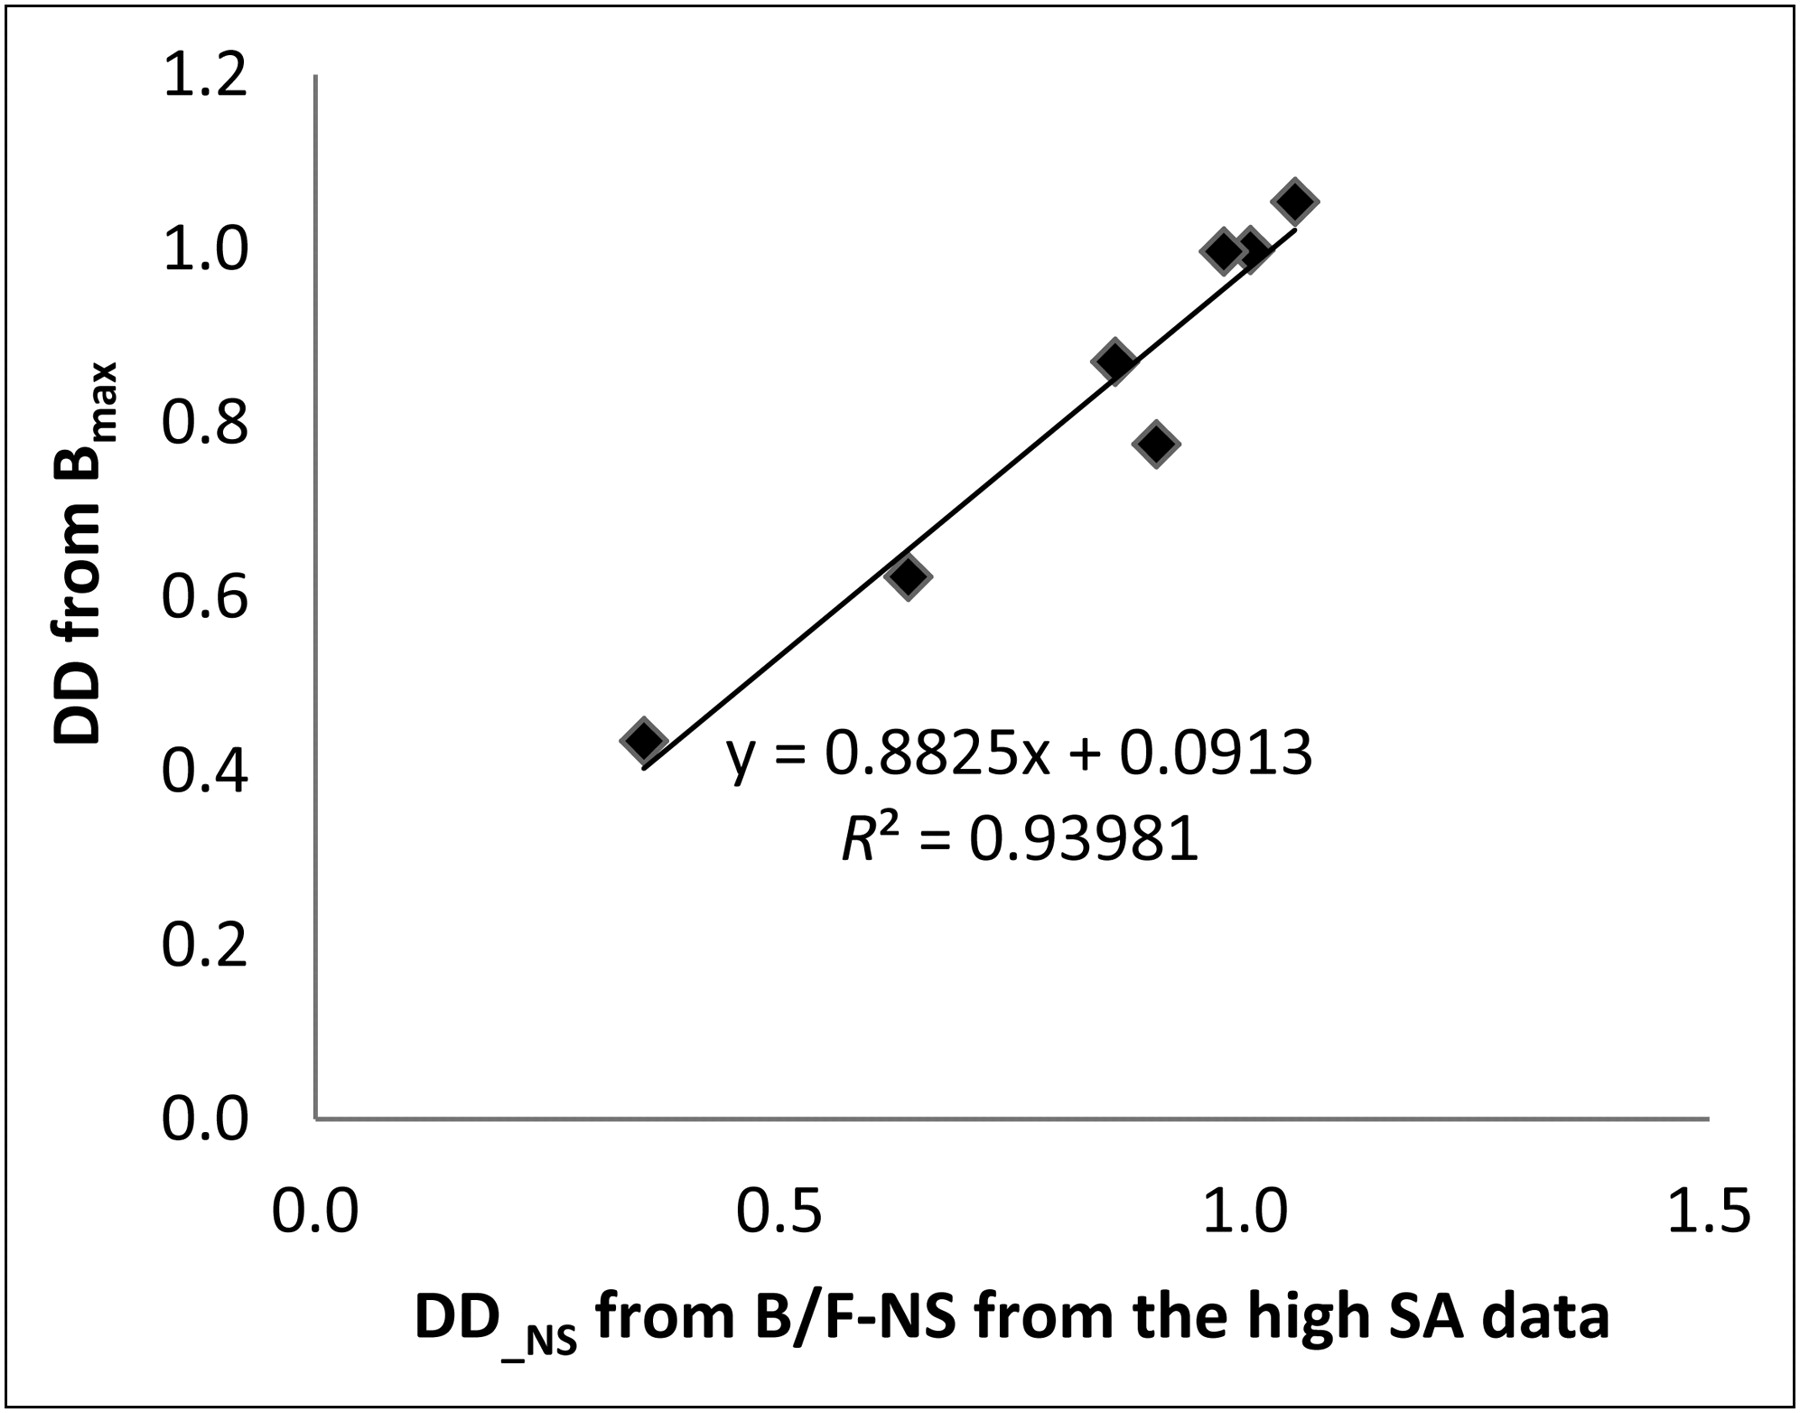
An excellent correlation between DD evaluated from the (B/F)e with NS subtracted (Eq. 7) (range [36%–94%]) and using the Bmax values as estimated from the linear 3-point Scatchard fits (Eqs. 5 and 8) was found, as shown in Figure 5, indicating that reasonable values were obtained for Bmax even for the lesioned side when the NS term was subtracted and the range of F limited.

Relationship between DD estimated from SRTM derived (B/F)e with NS subtracted (Eq. 7) and Bmax as estimated with Equations 5 and 8.
Effect of Lesioning on Bmax and K d app
Data from the 3-point Scatchard were used for this comparison with the NS term subtracted. Rats 4 and 5 were excluded because of unrealistic values obtained in the fit (Supplemental Table 1). Although there was a highly significant difference between the control and lesioned sides for Bmax (control, 402 ± 94 pmol/mL; lesioned, 117 ± 120 pmol/mL; P = 0.003),
Occupancy
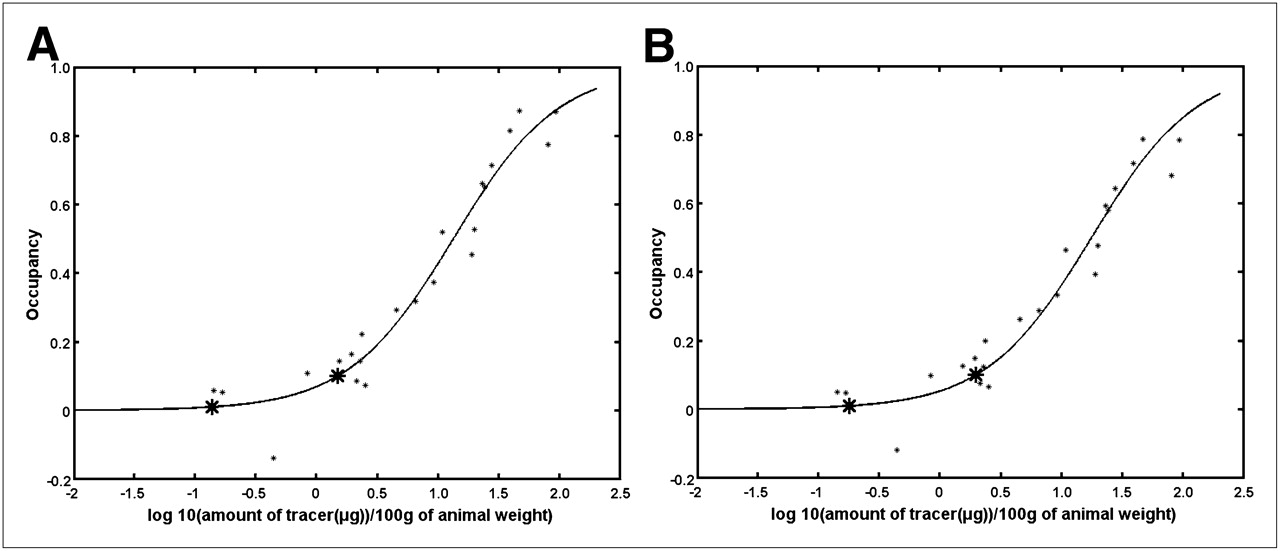
Occupancy curves without and with the NS term subtracted are shown in Figure 6. The curves are similar, with a higher occupancy being estimated when the NS term is subtracted. Amounts of tracers and SA required to reach 1% and 10% transporter occupancy are detailed in Table 3.

Occupancy curves without (A) and with (B) NS term subtracted as function of tracer amount. Asterisks show 1% and 10% occupancy values. Similar plots are obtained when occupancy is plotted as function of log(1/SA).
 and
and  Determined from Occupancy Curves (Control Side and SA and Amounts Leading to 1% and 10% Occupancy)
DISCUSSION
Several observations can be derived from the results. Of immediate practical relevance is the finding that relatively large 11C-methylphenidate amounts are required to induce noticeable transporter occupancy. For example, 10% occupancy is reached with approximately 1.5 μg of 11C-methylphenidate/100 g of body weight, whereas only 0.31 μg of the vesicular monoamine transporter 2 tracer 11C-dyhydrotetrabenazine/100 g of body weight leads to the same fraction of vesicular monoamine transporter 2 occupancy (26). 11C-methylphenidate can thus be produced with less stringent constraints on its SA, or conversely, a higher radioactivity dose can be injected, if a better statistical quality of the data is required.
Of more theoretic importance are the results obtained from comparison of the modeling approaches to the determination of (B/F)e, B, Bmax, and
Possibly the most important outcome of the study is strong evidence of a difference between the nonspecifically bound tracer concentration in the striatum and reference region. An attempt was made to fit the Scatchard plots with a 2-binding-site model, but no meaningful results were obtained, indicating that if a second type of binding site exists, the affinity must be so low that it cannot be reliably measured with the present data. Of course, it is possible that the high doses of 11C-methylphenidate, administered when the ligand was produced at very low SA, might introduce secondary pharmacologic effects, which could confound the MLCTA and occupancy analyses (27). Interestingly, in both rat and mouse groups, derived Bmax and
To test this hypothesis, we revisited the comparison between DD severity measured in vivo by 11C-methylphenidate PET and by in vitro 3H-WIN 35,428 autoradiography performed on extracted brain slices of the same animals. The original comparison was performed on a group of 16 rats and was part of a previously published study (22) in which all the scans were obtained with 11C-methylphenidate produced at an SA high enough to ensure negligible transporter occupancy (>40.7 kBq/pmol). PET-derived DD for those data was now estimated without and with subtraction of the NS term, with value fixed at the currently estimated 0.14. When the NS term is subtracted from the BPND, the correlation between the PET- and autoradiography-derived DD values virtually follows the line of identity, whereas the PET-derived DD values underestimate the autoradiography-derived DD values without subtraction of the NS term (Fig. 7). This finding argues against the supposition that the NS term might arise as a consequence of a methodologic confound due to a pharmacologic effect of larger amounts of 11C-methylphenidate and suggests that it is indeed a characteristic of 11C-methylphenidate binding. The origin and exact interpretation of such a term is at present speculative, and further comparisons to ex vivo or in vitro data must be performed to correctly identify its meaning. Further studies at very low SA are also required to precisely determine its value.

Comparison of DD severity estimate between 11C-methylphenidate PET and 3H-WIN 35,428 autoradiography. Solid line = line of best fit; dashed line = line of identity.
Despite these limitations, and the admitted uncertainty about the exact interpretation and value of the NS term, we deemed that a more informative comparison between the estimated Bmax and
Finally, it is of interest to compare the behavior of 11C-methylphenidate DAT binding with that of other tracers used to investigate the dopaminergic system in rats. Similar occupancy studies performed with 11C-dyhydrotetrabenazine on unilaterally 6-hydroxydopamine–lesioned rats demonstrated very different characteristics: no dependence of DD severity estimate on tracer SA and excellent linearity of the Scatchard plots over a wide range of free (or bound) tracer concentrations, thus presenting no evidence of a difference in the concentration of the nonspecifically bound tracer between the striatum and reference region (26). Because the impact of the NS term is particularly relevant to a situation of high denervation severity, care must be taken when comparing outcomes of multitracer studies in such a situation.
The impact of these findings on human DAT imaging with 11C-methylphenidate cannot be readily assessed with these results. Interspecies differences and the nature of the neurotoxin 6-hydroxydopamine–induced lesion could invalidate a direct extrapolation of these results to the human case. Nevertheless, these data might suggest the need for caution in interpreting 11C-methylphenidate DAT binding in extreme disease situations.
CONCLUSION
We have investigated the characteristics and limitations of 11C-methylphenidate–derived DAT imaging with PET in a unilateral 6-hydroxydopamine rat model of Parkinson disease. This study established useful limits to the amount of administered tracer to avoid confounding tracer mass effects and demonstrated the feasibility of determining Bmax and
DISCLOSURE STATEMENT
The costs of publication of this article were defrayed in part by the payment of page charges. Therefore, and solely to indicate this fact, this article is hereby marked “advertisement” in accordance with 18 USC section 1734.
Acknowledgments
We thank Siobhan McCormick and Rick Kornelsen for imaging and animal handling. This work was supported by grants from the Natural Science and Engineering Research Council and the Michael Smith Foundation for Health Research. No other potential conflict of interest relevant to this article was reported.
Footnotes
Published online Apr. 9, 2012.
- © 2012 by the Society of Nuclear Medicine, Inc.
REFERENCES
- Received for publication November 30, 2011.
- Accepted for publication February 14, 2012.


Jump to section
Related Articles
Cited By...
- No citing articles found.