


Abstract
The development of nonviral gene delivery systems is essential in gene therapy, and the use of a minimally invasive imaging methodology can provide important clinical endpoints. In the current study, we present a new methodology for gene therapy—a delivery system using nanobubbles and ultrasound as a nonviral gene delivery method. We assessed whether the gene transfer allowed by this methodology was detectable by PET and bioluminescence imaging. Methods: Two kinds of reported vectors (luciferase and human Na/I symporter [hNIS]) were transfected or cotransfected into the skeletal muscles of normal mice (BALB/c) using the ultrasound–nanobubbles method. The kinetics of luciferase gene expression were analyzed in vivo using bioluminescence imaging. At the peak of gene transfer, PET of hNIS expression was performed using our recently developed PET scanner, after 124I injection. The imaging data were confirmed using reverse-transcriptase polymerase chain reaction amplification, biodistribution, and a blocking study. The imaging potential of the 2 methodologies was evaluated in 2 mouse models of human pathology (McH/lpr-RA1 mice showing vascular disease and C57BL/10-mdx Jic mice showing muscular dystrophy). Results: Peak luciferase gene activity was observed in the skeletal muscle 4 d after transfection. On day 2 after hNIS and luciferase cotransfection, the expression of these genes was confirmed by reverse-transcriptase polymerase chain reaction on a muscle biopsy. PET of the hNIS gene, biodistribution, the blocking study, and autoradiography were performed on day 4 after transfection, and it was indicated that hNIS expression was restricted to the site of plasmid administration (skeletal muscle). Similar localized PET and 124I accumulation were successfully obtained in the disease-model mice. Conclusion: The hNIS gene was delivered into the skeletal muscle of healthy and disease-model mice by the ultrasound–nanobubbles method, and gene expression was successfully visualized with PET. The combination of ultrasound–nanobubble gene transfer and PET may be applied to gene therapy clinical protocols.
Gene therapy approaches using a diverse range of preclinical models have been applied in many different clinical contexts (1,2). Although viral vectors have been widely used in gene therapy, side effects such as carcinogenesis, hepatic toxicity, immunogenic, inflammation, and lower tissue specificity have been reported (3,4). In this context, the development of efficient nonviral methods of gene transfer is highly desirable and is the subject of intense investigation.
The combination of nanobubbles and ultrasound has been proposed as a strategy to deliver therapeutic molecules (5), including plasmid DNA (6,7). The principle is that when nanobubbles are destroyed by ultrasound, the surrounding cells are exposed to mechanical impulsive forces generated by the collapse of either the nanobubbles or the cavitation bubbles created by the collapse of the nanobubbles. These forces induce a transient membrane permeability of cells, followed by the entry of exogenous molecules into the cells (8). This mode of gene delivery has been proposed for different clinical applications including cancer gene therapy and vaccination strategies (6,7).
In this context, molecular imaging could provide a minimally invasive clinical endpoint to monitor the efficacy of gene transfer. To evaluate the efficacy and anatomic site of gene delivery, this methodology requires a reporter gene and tracer molecule. Fluorescence and bioluminescence imaging methods have been widely used for the in vivo monitoring of gene expression in animal models (9). These methods are convenient; however, their clinical application remains limited because signals generated in deep tissues cannot be detected. An alternative to these methods is the use of isotopic imaging (PET or SPECT). The Na/I symporter (NIS) gene has been proposed as a valid reporter gene for isotopic imaging when it is associated with a relevant radiotracer. The NIS gene is an integral plasma membrane glycoprotein, endogenously expressed in the thyroid and stomach and to a lower extent in the salivary gland, breast, and thymus. The NIS protein uses the sodium gradient in cells to concentrate iodide (10). After the human NIS (hNIS) gene was cloned in 1996 (11), we and others proposed the use of NIS combined with 99mTc or Na123I (for SPECT) (12) or Na124I (for PET) (13,14) as reporter systems to visualize and monitor gene transfer in live subjects. These imaging devices have been recently validated in humans (15).
Most current scintillator PET scanners are full width at half maximum (FWHM), providing a 1.3-mm reconstructed image resolution at the center of the field of view and a 2-mm reconstructed image resolution within the central 5-cm diameter in all 3 dimensions (16). This resolution is sufficient for imaging studies in rats. Recently, Ishii et al. developed a practical semiconductor animal PET scanner with a cadmium telluride detector (CdTe) (Fine Structure Imaging PET [Fine-PET]) (17). The Fine-PET scanner achieves a spatial resolution of 0.8 mm in FWHM within the central 20-mm diameter of the field of view and provides a high spatial resolution of less than 1 mm in FWHM, which is applicable to studies in mice.
In the present study, we evaluated whether NIS gene expression mediated by ultrasound and nanobubbles could be detected by the Fine-PET scanner in mice using 124I as a radiotracer.
MATERIALS AND METHODS
Plasmid DNA
Two types of plasmids were used: the luciferase reporter vector pGL3 (pGL3-control; Promega), in which the luciferase expression is driven by the Simian virus 40 (SV40) promoter, and the hNIS vector, in which the expression of the hNIS gene is driven by the cytomegalovirus promoter (18). In both cases, the promoters are strong and allow ubiquitous expression of the transgene. The plasmids were purified with an EndoFree Plasmid Mega Kit (Qiagen) and prepared at a final concentration of 1 mg/mL.
Nanobubbles
Acoustic liposomes were used as nanobubbles. One milliliter of a liposome suspension (lipid concentration, 1 mg/mL) was sonicated with a 20-kHz device (Vibra-Cell; Sonics & Materials Inc.) in the presence of C3F8 in 7-mL sterilized vials. The bubble size distribution was determined using a laser diffraction particle size analyzer (particle range, 0.6 nm−7 μm) (ELSZ-2; Otsuka Electronics Co. Ltd.). The peak diameter expressed in terms of the size distribution and the ζ-potential of the acoustic liposomes was 198 ± 30 nm (n = 3) and −4.1 ± 0.85 mV (n = 3), respectively.
Ultrasound Conditions and Transfection Methods
A 1-MHz submersible ultrasound probe with a diameter of 30 mm (BFC Applications) was used in the experiments. Signal generation and pressure measurements were as previously described (5,6). After the legs of the mice were shaved, the tibialis anterior (TA) muscle was immersed in water and exposed to ultrasound. The intensity was 3.0 W/cm2, duty cycle was 20%, number of pulses was 200, pulse repetition frequency was 1,000 Hz, and exposure time was 60 s.
Animal Models
Animal studies were performed in accordance with the ethical guidelines of Tohoku University. Three types of mice were used: 40 BALB/c mice, 5 McH/lpr-RA1 mice with arthritis and vasculitis disease (19), and 3 C57BL/10-mdx Jic mice with muscular dystrophy. The mice were housed in the Animal Research Institute of Tohoku University Graduate School of Medicine under specific pathogen-free conditions and had free access to food and water until the beginning of the experiments.
Kinetics of Gene Expression Induced by Ultrasound and Nanobubbles
Seven BALB/c mice (age, 6 wk; weight, 22–23 g) were used to investigate the kinetics of gene expression in the TA muscle. Two conditions were considered: pGL3 + ultrasound (n = 3) and pGL3 + ultrasound + nanobubbles (n = 4). A total volume of 30 μL—comprising pGL3 (10 μL), with or without nanobubbles (15 μL), and saline (to reach 30 μL)—was injected into the TA muscle. Mice were anesthetized with isoflurane (Forene; Abbott Scandinavia AB) and subsequently injected intraperitoneally with luciferin (150 mg/kg of body weight; Promega). After 10 min, the mice were placed in the chamber of an in vivo real-time bioluminescence imaging system (IVIS Lumina; Xenogen) with a charge-coupled device camera (sensitivity, 400–900 nm), and the images were captured for 40 s.
Cotransfection of pGL3 and hNIS in TA Muscle
To confirm that the hNIS gene was expressed in the TA muscle by the ultrasound–nanobubbles method, hNIS and pGL3 were cotransfected into the TA muscle. Mice that showed enhanced bioluminescence were selected as samples for a 124I study. A solution containing hNIS (10 μL), pGL3 (5 μL), and nanobubbles (15 μL) was injected into the TA muscle.
RNA Isolation and Reverse-Transcriptase Polymerase Chain Reaction (RT-PCR) for Luciferase and NIS
Nine BALB/c mice (age, 5 wk; weight, 18–20 g) were used to measure luciferase and NIS gene expression in the TA muscle by RT-PCR. Three conditions were considered: saline alone (n = 3), pGL3 + ultrasound + nanobubbles (n = 3), and pGL3 + hNIS + ultrasound + nanobubbles (n = 3). Two days after cotransfection, the TA muscles were removed from the mice after bioluminescence was monitored. The biopsies were frozen in liquid nitrogen and homogenized (ULTRA-TURRAX T25 basic; Ika). Total RNA was extracted with an RNeasy Midi Kit (Qiagen) and an RNase-Free DNase Set (Qiagen) according to the manufacturer's protocol. Total RNA was reverse-transcribed using the RNA PCR Kit (AMV; Takara Bio Inc.) according to the manufacturer's protocol (1 μg of total RNA was used). The cDNAs were then subjected to PCR amplification using a Peltier thermal cycler (PTC-200; MJ Research). The PCR conditions were as follows: For β-actin, 3 min at 94°C; 30 cycles of denaturation at 95°C for 30 s, annealing at 54°C for 30 s, and extension at 72°C for 60 s; and conclusion of the process with a 5-min extension cycle at 72°C. For luciferase and hNIS, 3 min at 94°C; 35 cycles of denaturation at 95°C for 30 s, annealing at 53°C for 30 s, and extension at 72°C for 60 s; and conclusion of the process with a 5-min extension cycle at 72°C. The specific primers are shown in Table 1. The PCR products were then separated on a 2% agarose gel.
Primer Sequences
Preparation of Na124I
124I was produced by the 124Te(p, n)124I process—irradiation of a 124TeO2 target with 14-MeV protons of a 4-μA beam current, depending on the target production yield of 124I. A dry distillation apparatus of 124I, which was similar to the one used in a previous study (21), was slightly modified. The radioiodine activity in the NaOH trap (0.5 mL; 0.1 M) was monitored by a NaI scintillation detector. Because of the high isotopic enrichment of the 124Te oxide used for the target preparation, the calculated isotopic compositions were 98% for 124I and 1% for 123I at 95 h after the end of bombardment (22,23).
Biodistribution of 124I
Fourteen BALB/c mice (age, 6 wk; weight, 18–27 g) were used to study the biodistribution of 124I. The TA muscle in the left leg of the mice was cotransfected with pGL3 and hNIS. The TA muscle in the right leg was injected with saline alone as a control. Four days after cotransfection, mice were injected intravenously with 370 kBq of Na124I dissolved in 100 μL of phosphate-buffered saline (pH in the physiologic range) and sacrificed after 30 (thyroid, n = 1; other tissues, n = 4), 60 (n = 6), and 180 (thyroid, n = 3; other tissues, n = 4) minutes. The organs and tissues were quickly removed. Each sample was washed with saline solution and weighed. The radioactivity of each sample was measured by a γ-counter (AccuFLEX γ7000; ALOKA Co. Ltd.) in the range of 400–700 keV. The radioactivity of organs and tissues was expressed as the percentage of the injected dose per gram.
Blocking Study in TA Muscle
Four BALB/c mice (age, 6 wk; weight, 21–25 g) were used for a blocking study in the TA muscle. All TA muscles were cotransfected with pGL3 and hNIS. Three days after cotransfection, the mice were divided into 2 groups. One group (n = 2) was injected intravenously with 100 μL of Na124I (1.85 MBq) and sacrificed 2 h later. The other group (n = 2) was injected intraperitoneally with 100 μL of NaI (57 mM). After 15 min, 100 μL of Na124I (1.85 MBq) were injected intravenously, and the mice were sacrificed 2 h later. The TA muscles were then processed for autoradiography.
PET
The Fine-PET scanner has the sensitivity of 40 counts per second/kBq/mL. The field-of-view diameter is 64 mm, and its axial length is 26 mm. The energy window setting was 250 keV, open-ended (17). Six BALB/c mice (controls; age, 6 wk; weight, 22–25 g), 5 mice with arthritis and vasculitis disease (age, 16 wk; weight, 32–24 g), and 3 mice with muscular dystrophy (age, 5 wk; weight, 12–15 g) were used. The TA muscle in the left leg was cotransfected with pGL3 and hNIS in the presence of ultrasound. The TA muscle in the right leg was injected with saline alone as a control. Four days after cotransfection, mice were injected intravenously with 100 μL of Na124I (74 MBq). The dose concentration was chosen to be certain that informative and secure gene expression images were obtained. Then the mice were anesthetized with isoflurane (1.0–1.5 L/min) and ventilated (1.0 L/min) through a nose cone in the bed of the scanner. A camera was used to monitor the lack of movement of the anesthetized mice and their breath to ensure that they were alive during the scanning period. The detector of the Fine-PET scanner was composed of CdTe, and the performance of the scanner was not affected by temperature. In the present study, the room temperature was kept constant (20 ± 2°C) using air controllers in the PET room. Thirty minutes after injection, the PET scan was obtained, and the data were acquired for 2 h. The Fine-PET scanner has a 3-dimensional mode, with a spatial resolution of 0.6 × 0.6 × 0.6 unit (unit = mm/pixel). The images were reconstructed using the Fourier rebinning–maximum-likelihood expectation maximization (FORE + ML-EM) method. In a pilot study, we have shown that integrated average pixel values in the region of interest of a mouse tumor gradually increase with increasing iteration number. However, from 30 iterations onward, these values are saturated (data not shown). Therefore, 30 iterations were chosen. PET images were obtained and visualized with image-analysis software (Image J). After PET, the mice were sacrificed, and the TA muscle was removed from the mice for autoradiography.
Autoradiography
After the mice were sacrificed, the TA muscles were quickly removed and frozen using powdered dry ice. Cryostat sections (10 μm) were serially cut for each frozen sample. The sections were exposed to universal-type imaging plates. Autoradiographic images (25 μm pixels) were obtained using an imaging plate system (Bio-Imaging Analyzer BAS5000; Fuji).
Statistical Analysis
All measurements are expressed as the mean ± SEM. Overall differences between the groups were determined by one-way ANOVA. When the one-way ANOVA results were significant for 3 samples, the differences between each group were estimated using the Tukey–Kramer test. Simple comparisons of the mean and SEM of the data were performed using the Student t test. The differences were considered to be significant at a P value of less than 0.05.
RESULTS
Kinetics of Gene Expression Induced by Ultrasound and Nanobubbles
To investigate the kinetics of transgene transfection in the TA muscle induced by the ultrasound–nanobubbles method, bioluminescence imaging was performed (Fig. 1). Luciferase activity was detectable when pGL3 + ultrasound were administered, but the combination of pGL3 + ultrasound + nanobubbles showed an enhanced luciferase activity on each day (P < 0.01). The luciferase gene expression reached a peak at 4 d after transfection. These results demonstrate the transient nature of ultrasound- and nanobubble-mediated gene transfer.

Peak of gene expression in mouse TA muscle. Kinetics of luciferase gene expression in TA muscles by ultrasound–nanobubbles method. (A) Luciferase activity after transfection. (B) Bioluminescence imaging: DNA + US (n = 3) and DNA + US + NS (n = 4). Bars represent mean ± SEM. **P < 0.01. DNA = pGL3; US = ultrasound; NB = nanobubbles.
Cotransfection with pGL3 and hNIS Genes in TA Muscle
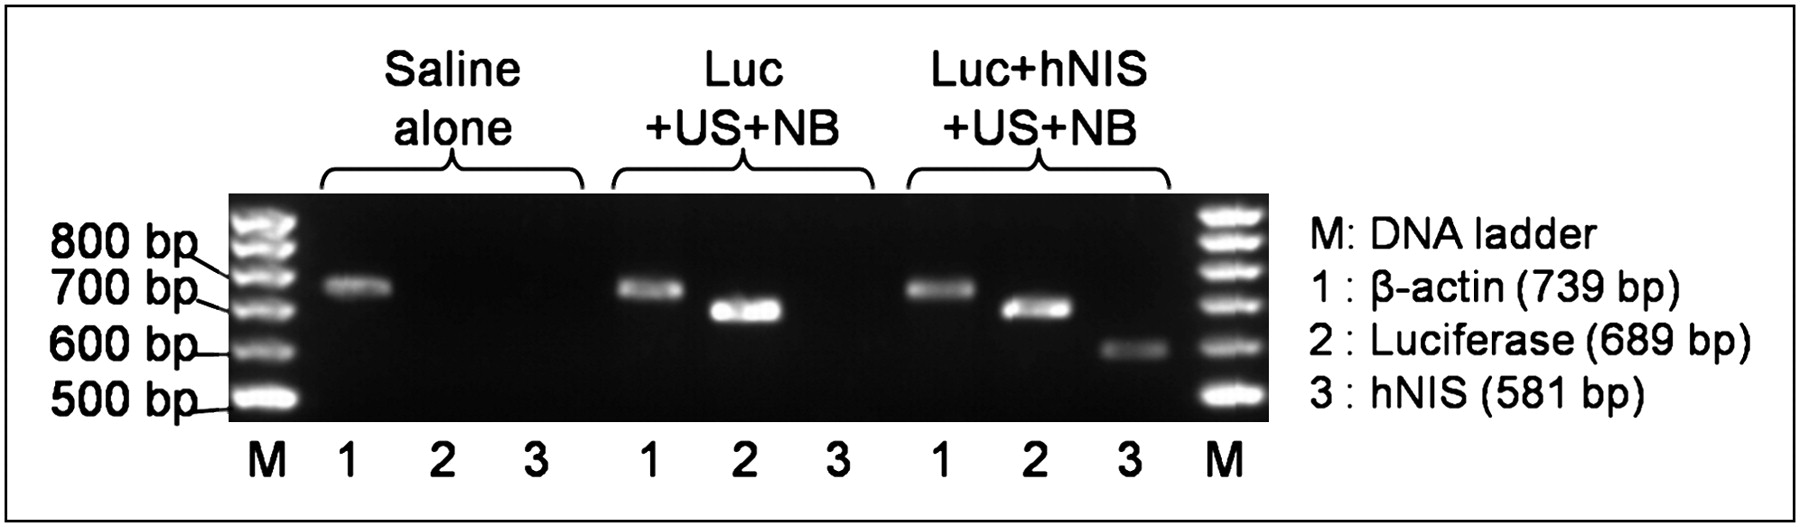
Transgene expression was analyzed by RT-PCR at 48 h after ultrasound- and nanobubble-mediated cotransfection of pGL3 and hNIS. Figure 2 demonstrates that both transgenes were coexpressed in the same TA muscle.

RNA isolation and RT-PCR for luciferase and NIS. Gel electrophoretic analysis of RT-PCR for luciferase or hNIS expression in mouse TA muscle induced by nanobubbles and ultrasound. Lane M, 0.1- to 2-kbp ladder; lane 1, β-actin (739 bp); lane 2, luciferase (689 bp); and lane 3, hNIS (581 bp). Luc = luciferase; US = ultrasound; NB = nanobubbles.
Biodistribution of 124I
To confirm the disposition of 124I in mice and to determine whether the NIS expression detected by RT-PCR resulted in the expression of a functional protein, TA muscles of BALB/c mice were cotransfected with pGL3 and hNIS using the ultrasound–nanobubbles method, and saline solution was injected into the right TA muscle as a control. For most organs and tissues, the accumulation of 124I reached its maximum value at 60 min and decreased at 180 min (Fig. 3). The highest accumulation of 124I was in the thyroid, and the lowest accumulation was in the brain. There was significant accumulation of 124I at 60 min (P < 0.05) and 180 min (P < 0.01) in the TA muscle transfected with hNIS, compared with the control TA muscle. These data suggest that the transfection procedure results in the synthesis of an active protein. In addition, we demonstrate here that ultrasound- and nanobubble-mediated transfection is restricted to the site of ultrasound administration, because no ectopic NIS-mediated iodide accumulation was detected.

Biodistribution of 124I. pGL3 and hNIS were cotransfected into left TA muscle of BALB/c mice using ultrasound–nanobubbles method, and saline solution was injected into right TA muscle as control. Distribution of 124I (370 kBq) is observed 30 (thyroid, n = 1; other tissues, n = 4), 60 (n = 6), and 180 (thyroid, n = 3; other tissues, n = 4) minutes after injection. Radioactivity of tissues was expressed as percentage of injected dose per gram (%ID/g). Bars represent mean ± SEM. *P < 0.05. **P < 0.01. DNA = pGL3 and hNIS (cotransfection); US = ultrasound; NB = nanobubbles.
Blocking of 124I in TA Muscle
To confirm that the 124I accumulation observed in the TA muscle was indeed because of the expression of NIS, we used autoradiography to determine the accumulation of 124I in the TA muscle, in the presence or absence of a large excess of cold iodide. Figure 4B shows that the accumulation of 124I (Fig. 4A) was completely blocked by the injection of nonradioactive NaI (Fig. 4B).

Blocking of 124I in TA muscle. Autoradiography localization of 124I in mouse TA muscle axial slices. Mice cotransfected with pGL3 and hNIS were divided into 2 groups 4 d after transfection. (A) One group was intravenously injected with Na124I (1.85 MBq) and sacrificed 2 h later. (B) Other group was intraperitoneally injected with NaI. After 15 min, Na124I (1.85 MBq) was intravenously injected, and group was sacrificed 2 h later. Color bar shows logarithmic radioactivity.
Visualization of Gene Expression
To determine whether the NIS expression detected on biopsies (by RT-PCR [Fig. 2], biodistribution [Fig. 3], and autoradiography [Fig. 4]) could also be detected by PET, BALB/c mice underwent ultrasound- and nanobubble-mediated gene transfer on day 0, bioluminescence imaging on day 3, and PET on day 4 (Fig. 5). The data presented in Figure 5 show a specific signal in the transfected TA muscle (left), whereas no signal was observed in the right muscle injected with saline. Autoradiographic analysis performed on muscle biopsies confirmed the PET results (Fig. 5A). These experiments, obtained with normal BALB/c mice, were repeated on mice with arthritis and vasculitis disease (Fig. 5B) and mice with muscular dystrophy (Fig. 5C), with similar results.

Visualization of gene expression. We used 3 types of mice: control (A), arthritis and vasculitis disease model (B), and muscular dystrophy model (C). In all images, left TA muscle was cotransfected with pGL3 and hNIS by ultrasound–nanobubbles method, and right TA muscle was injected with saline. In all images, upper row shows bioluminescence image 3 d after transfection, middle row shows PET images 4 d after transfection (Na124I [74 MBq] intravenously), and bottom row shows autoradiograph of TA sections. Radioactive tracer accumulated in left TA section, whereas it did not accumulate in right TA section. Color bar shows logarithmic radioactivity.
DISCUSSION
Ultrasound and nano- or microbubbles have been developed for applications in experimental therapeutics. In gene therapy, this methodology has been exploited to increase the infectivity of adeno-associated viruses (24), adenoviruses (25), and retroviruses (26). In addition, ultrasound- and nanobubble-mediated gene transfer has been used in nonviral approaches to deliver plasmid DNA to experimental tumors (27), the pancreas (28), antigen-presenting cells (29), and the kidneys (30).
Skeletal muscle is a key target for many gene therapy applications, including peripheral ischemia, secreted protein production, cancer and infection vaccines, and Duchenne muscular dystrophy (31). In this context, our results demonstrated that the ultrasound–nanobubble gene transfer technology was effective. Considering the low toxicity, ease of use, and flexibility of this methodology, ultrasound- and nanobubble-mediated gene transfer should be considered the method of choice for the TA muscle. We also demonstrated that the signal was transient and reached a peak at 4 d after transfection (Fig. 1). Our results are in agreement with another recent report that demonstrated that muscle was more amenable to ultrasound- and nanobubble-mediated gene transfer than were subcutaneous or orthotropic tumors (32). In addition, we demonstrated that gene transfer mediated by ultrasound and nanobubbles can also be performed on mice with arthritis or muscle degeneration, suggesting that these pathologies do not impair the transduction potential of the methodology.
We cotransfected pGL3 and hNIS into the TA muscle using the ultrasound–nanobubbles method (Figs. 2–5⇑⇑⇑). This cotransfection method is based on the hypothesis that 2 plasmids have the same backbone and promoter. The promoter of pGL3 is the SV40, and the promoter of the hNIS gene is the cytomegalovirus. It has been reported that the gene expression levels differed (SV40 < cytomegalovirus) when plasmids with the SV40 and cytomegalovirus promoters both expressed the same gene product (33). So et al. showed a correlation between the 125I uptake of the hNIS gene and the bioluminescence activity induced by the luciferase gene when a plasmid with both the luciferase and hNIS gene was transfected in vitro (34). Therefore, it is reasonable to select mice and to visualize the gene expression of hNIS using PET based on the expression of the luciferase gene. In addition, Figure 2 clearly showed that both genes were expressed after cotransfection in the TA muscle. Extrapolated to a physiopathologic situation and on the basis of these data, it is possible to foresee therapeutic strategies combining the action of at least 2 transgenes carried by different expression plasmids. This flexibility may provide the means for a mix-and-match approach to provide optimal therapeutic efficiency.
The biodistribution study was important to confirm the radiation exposure before PET. Figure 3 demonstrates that specific accumulation of 124I was observed in the thyroid and stomach when endogenous NIS was expressed (35) and in the bladder as a result of iodide excretion (36). Low levels of 124I accumulation were observed in the brain, indicating that iodide does not pass the blood–brain barrier (37). In addition, we demonstrated that ultrasound- and nanobubble-mediated transfection is restricted to the site of ultrasound administration, because no ectopic NIS-mediated iodide accumulation was detected in sites not subjected to the transfection procedure. These results are in agreement with a previous 125I study that suggested 124I and 125I are appropriate radiotracers to study accumulation (38). In addition, the radioiodide activity of the TA muscle transfected with the hNIS gene, compared with the control TA muscle, indicated a 2-fold accumulation. This result demonstrates that the specific accumulation of 124I in the TA muscle occurred by the ectopic expression of the hNIS gene. Because accumulation of 124I in the blood was observed until 180 min, the residual 124I internal exposure should be investigated in a future study.
To confirm the specific binding of 124I in mouse TA muscle, we injected nonradioactive NaI before the administration of 124I (Fig. 4). The uptake of 124I was blocked by NaI, indicating that hNIS was actually transfected in the TA muscle. The results of the biodistribution and blocking studies showed that the hNIS gene was transfected in the TA muscle by the ultrasound–nanobubbles method, and the accumulation of 124I was because of the expression of the hNIS gene.
In this study, we verified the effectiveness of gene delivery using the ultrasound–nanobubbles method and the visualization of gene expression using PET to develop gene therapy. The expression of the hNIS gene was confirmed at the peak of gene transfer, determined by bioluminescence imaging. However, longitudinal studies are required for this expression to be applicable as a clinical endpoint. We administered 124I (74 MBq intravenously) for PET (Fig. 5). This dose is 10 times larger than that used in previous studies (39) and is similar to that used in a clinical study (40). Acute radiation injury in mice will occur at this dose, and longitudinal studies are not possible under these conditions. We administered this dose for the following reasons: this was the first study, to our knowledge, using 124I and the Fine-PET scanner, and the sensitivity of the Fine-PET scanner is 40 counts per second/kBq/mL (17) (one tenth that of the commercially available small-animal PET system). In future studies, we will conduct a longitudinal analysis of gene expression with a lower injected dose of 124I.
CONCLUSION
This study demonstrates for the first time, to our knowledge, the proof of principle that PET can be used to visualize ultrasound- and nanobubble-mediated gene transfer. This technology provides a new platform to detect nonviral-mediated gene transfer and, extrapolated to patients, a new clinical endpoint for future clinical trials that may include patients with genetic disorders (i.e., vascular diseases and muscular dystrophy). In this perspective, we are developing a new plasmid that combines a therapeutic gene and the hNIS gene to visualize the therapeutic effect; we are also improving the ultrasound–nanobubble hNIS–PET system to improve the levels of transfection and expression.
Acknowledgments
This study was supported in part by the following: grants-in-aid for JSPS Fellows 21-7073 and 21-7271; a grant-in-aid for scientific research for a JSPS Postdoctoral Fellowship for Foreign Researchers P09127; grants-in-aid for scientific research (B) (19390507) and (B) (20300173); a grant-in-aid for exploratory research (21650124); a grant-in-aid for scientific research on a priority area, MEXT (17012002, 18014002, and 20015005); a grant for research on advanced medical technology, Ministry of Health, Labor, and Welfare of Japan (H19-nano-010); a grant for research for promoting technological seeds (03-017); and a grant from the Japan-France Integrated Action Program (SAKURA) Joint Project.
Footnotes
-
COPYRIGHT © 2010 by the Society of Nuclear Medicine, Inc.
References
- Received for publication December 28, 2009.
- Accepted for publication February 17, 2010.


