


Abstract
nanoScan is a high-resolution integrated system for consecutive PET and MR imaging of small laboratory animals. We evaluated the performance of the system, using the NEMA NU 4-2008 protocol for the PET component and the NEMA MS 1-2007, MS 2-2008, and MS 3-2007 standards for the MR imaging component. Methods: The imaging system uses magnetically shielded position-sensitive photomultiplier tubes and a compact 1-T permanent-magnet MR imaging platform. Spatial resolution, sensitivity, counting rate capabilities, and image quality parameters were evaluated in accordance with the aforementioned NEMA standards. Further in vivo evaluation experiments complement the physical validation results. Results: The spatial resolution of the PET system enabled the 0.8-mm rods of a Derenzo phantom to be resolved. With point source and 2-dimensional filtered backprojection reconstruction, the resolution varied from 1.50 to 2.01 mm in full width at half maximum in the radial direction and from 1.32 to 1.65 mm in the tangential direction within the radius of 25 mm. Peak absolute sensitivity was 8.41%. Scatter fraction was 17.3% and 34.0%, and maximum noise-equivalent counting rate was 406 and 119 kcps in the mouselike and ratlike phantom, respectively. The image quality test found a nonuniformity of 3.52% and a spillover ratio of 6.2% and 5.8% in water and air, respectively. In testing of the MR imaging component, artifact-free images with high signal-to-noise ratio were recorded. Geometric distortion was below 5%, and image uniformity was at least 94.5% and 96.6% for the 60- and 35-mm radiofrequency coils, respectively. Conclusion: The nanoScan integrated small-animal PET/MR imaging system has excellent spatial resolution and sensitivity. The performance characteristics of the PET and the MR imaging components are not compromised as a result of their integration onto a single platform. Because of its combination of features and performance parameters, the system provides crucial advantages for preclinical imaging studies over existing PET/CT systems, especially in neurologic and oncologic research.
The unique advantages of molecular imaging with PET in various fields of biomedical research have clearly been shown during the past few decades. PET can play a significant role in the development of therapeutic drugs and molecular imaging biomarkers, in the exploration of physiologic and biochemical processes, and in the in vivo mapping of receptor transmitters and enzymes (1,2). Because of the increasing availability of animal disease models, there is growing interest in using PET for studies on small animals (3,4). In vivo anatomic and biochemical studies on rodents require dedicated scanners with high resolution and sensitivity.
PET can localize picomolar concentrations of a labeled molecule (5) but does not provide the anatomic context of the tracer. Resolving brain morphology is of unique importance in dedicated central nervous system studies and today can be achieved only through MR imaging. Ideally, the same instrument should contain both imaging modalities, and the subject should pass through both modalities on a single integrated bed. This minimizes imaging time and the need for software coregistration of the respective images. Hence, combined small-animal PET/MR imaging systems of both simultaneous and consecutive design are under development and testing.
Most effort in PET/MR development has been devoted to simultaneous imaging instruments (6), largely motivated by workflow efficiency: both PET and MR imaging are relatively time-consuming, and parallelizing the acquisitions may reduce the overall length of the examination. The practical gain is not obvious though, especially in research applications using 11C labeling, for which throughput is limited by the radiochemistry and not by scan time.
Though there are prospective biologic applications for simultaneous acquisitions, the most accepted advantages of PET/MR imaging over PET/CT are good soft-tissue contrast and the reduced radiation dose that can be achieved by simultaneous and consecutive systems alike.
It would be inappropriate to compare the performance of a photomultiplier tube–based sequential PET/MR imaging system with current simultaneous PET/MR imaging systems: on the one hand, simultaneous systems are based on relatively new detector technologies that are immature compared with photomultiplier tubes, and many systems are mainly proof-of-concept designs. On the other hand, these instruments may have future applications that use true concurrent imaging.
We report here performance tests of the nanoScan PET/MRI system (Mediso Ltd.) and compare the results with those reported for standalone PET and PET/CT systems. We show that the integration has not deteriorated the performance of the individual subunits.
MATERIALS AND METHODS
System Description
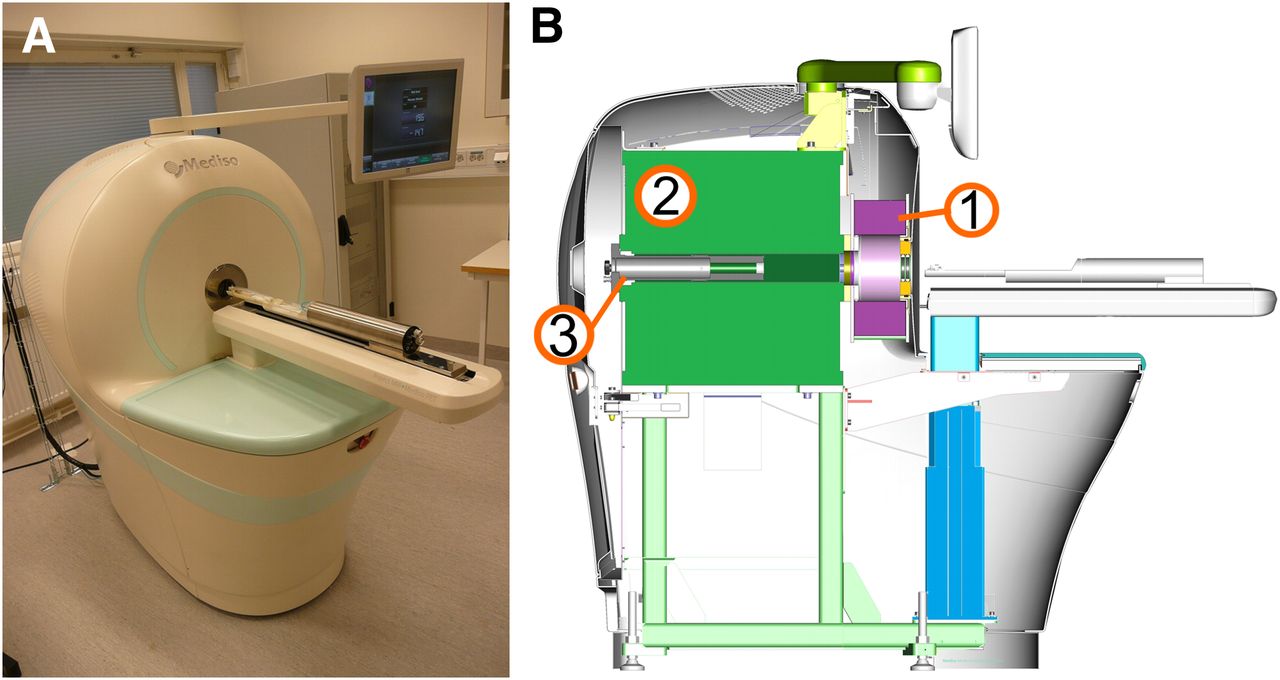
The PET component of the instrument is based on the PET ring of the NanoPET/CT scanner (Mediso Ltd.) (Fig. 1) (7). The axial field of view (FOV) is 94 mm; each detector module can be connected for coincidence detection with 1, 3, or 5 modules on the opposite side of the ring (coincidence mode 1:1, 1:3, and 1:5), allowing for a transaxial FOV of 45, 94, or 120 mm, respectively.

nanoScan small-animal PET/MR scanner (A) and its schematics (B). Labeled components are PET ring (1), magnet (2), and radiofrequency coil (3).
To protect the position-sensitive photomultiplier tubes from the magnetic field, additional magnetic shielding was applied. The internal radiofrequency shield of the MR imaging system was extended to encompass the PET imaging volume. The radiofrequency cage is sealed at the front entrance during MR imaging scans.
The PET detector consists of 12 modules, each comprising a 39 × 81 (tangential × axial) array of 1.12 × 1.12 × 13.00 mm lutetium yttrium oxyorthosilicate crystals on a pitch of 1.17 mm. The crystal matrix is monitored by 2 position-sensitive photomultiplier tubes (H9500; Hamamatsu). Event detection, coordinate calculation, energy measurement, and coincidence selection are performed by a field-programmable gate array that sends data to the acquisition personal computer.
Data are stored in list-mode format with energy, position, and time-stamp information, allowing for a wide range of postprocessing including the application of time, energy, or coincidence windows and the definition of dynamic time frames or even retrospective calibrations. Energy and position information is processed using look-up tables (8).
Several reconstruction options are available: for 2-dimensional (2D) reconstruction, the binned data can be processed using single-slice rebinning (9) or Fourier rebinning (10) into sinograms for filtered backprojection or 2D line-of-response data files for maximum-likelihood expectation maximization or ordered-subset expectation maximization. A fully 3-dimensional (3D) reconstruction (Tera-Tomo; Mediso Ltd.) (11), using a maximum a posteriori or penalized maximum-likelihood algorithm with the total variation as the regularization term, is also available. This reconstruction features Monte Carlo system matrix modeling (12) and can take into account effects such as depth of interaction in the detector systems and positron range in the object.
The MR imaging component of the instrument is based on the M2 system by Aspect Imaging. The 1-T vertical filed, horizontal-bore permanent magnet has better than 5-ppm homogeneity in the central 60-mm-diameter region and a fringe field below 13 mT anywhere on the magnet surface. It features built-in gradient coils also used for shimming and an internal radiofrequency cage. The gradient subsystem (231HC; Copley Controls/Analogic) can deliver 450 mT/m pulses with a 250-μs ramp time. Currently, 2 radiofrequency volume coils are available: a 35-mm- and a 60-mm-diameter coil recommended for mouse and rat imaging, respectively. Additional specialized coils, including a receive-only dedicated brain coil, are under development. Pulse generation and data collection are controlled by a spectrometer (Apollo; TecMag Inc.). The unique design allows the system to operate in any facility without the shielding and cooling systems required by conventional high-field MR imaging systems. The MR imaging system is therefore virtually maintenance-free and is permanently shimmed, active, and ready for imaging without any ramp-up.
Measurement Standards
Performance tests for the PET component were conducted according to the National Electrical Manufacturers Association (NEMA) report NU 4-2008. This standard is widely used (7,13,14) and thus suitable for benchmarking and for the comparison of different PET instruments.
For some measurements, we used a 370-kBq 22Na point source (MMS09-022-10U; Eckert and Ziegler). The size of the active volume of the source, nominally less than 0.3 mm, was verified by a small-animal CT scan (NanoX/CT; Mediso Ltd.). The source is embedded into a 1-cm3 acrylic cube conforming to the NEMA standard.
For preclinical MR imaging systems, there is no dedicated performance evaluation standard. There are several NEMA MR standards, though these are more quality control protocols than cross-platform benchmarks. We performed measurements according to standards MS1-2007 for signal-to-noise ratio, MS2-2008 for 2D geometric distortion, and MS3-2007 for image uniformity.
PET Measurements
Spatial Resolution
The 22Na point source was carefully centered in the detector ring using the distribution of 1:1 coincidence counts. Then, it was moved to the prescribed 4 transaxial positions at the 2 axial locations: the axial center and at one fourth of the axial FOV.
Data were acquired for 5 min in each position and binned using a 5-ns time window and a 400- to 600-keV energy window. In the case of 5-, 10-, and 15-mm radial positions, a 1:3 coincidence mode was used, whereas for the 25-mm point, a 1:5 coincidence mode was used. Data were sorted into sinograms using single-slice rebinning with a ring span of 8 and were reconstructed using filtered backprojection.
The synthetic, hardware-level resolution measure of the NEMA standard is suitable for benchmarking and for comparison of different systems, as it assesses a prerequisite for general imaging performance. However, because of the statistical nature of PET imaging, detailed detector models of modern iterative reconstruction algorithms enable extraction of more information from the collected datasets than does filtered backprojection, and hence the test fails to evaluate the resolution experienced in practice. Because iterative algorithms can overestimate the resolution of point sources in air (15), spatial resolution achievable in preclinical studies was evaluated using a micro-Derenzo phantom. The phantom was filled with 9.34 MBq of 18F-FDG solution. The 4-h acquisition was binned with a 400- to 600-keV energy window and 5-ns time window and was reconstructed using the Tera-Tomo reconstruction engine with expectation-maximization iterations and with scatter, attenuation, and positron range modeling enabled, on a matrix of 0.2-mm3 voxels.
Scatter Fraction, Count Losses, and Random Coincidence Measurements
Measurements were performed with the mouselike (70-mm length, 25-mm diameter) and ratlike (150-mm length, 50-mm diameter) phantoms. The phantoms provided with the camera consist of a high-density polyethylene cylinder with an off-centered axial bore of 3.2-mm diameter for a plastic tube filled with activity.
The phantoms were filled with an aqueous solution containing 18F− ions (rinse water), with 42 and 37.57 MBq of activity in the ratlike and mouselike phantoms, respectively. The phantoms were scanned for 1 min every 20 min until the activity decayed to less than 0.2 MBq. The single-event rate due to this activity is equal to the intrinsic single-event rate of the scanner.
The measurement was performed in the high-count mode of the scanner in 1:3 and 1:5 coincidence modes for the mouselike and ratlike phantoms, respectively. Data were binned with a 250- to 750-keV energy window and 5-ns time window and sorted into 2D sinograms using the single-slice rebinning method, with 240 projections, a 0.3-mm bin size, a 0.585-mm slice thickness, and a ring span of 81.
Because the scintillator of the detector contains natural 176Lu isotope, emitting γ-radiation, 20-min background scans with cold phantoms were also performed. Intrinsic counts were considered in the calculation by first evaluating the random event rate for each slice using the scatter fraction for the respective slice, without taking into account the intrinsic activity. Then, the scattered event rate was calculated by subtracting true, random, and intrinsic events from the total, and the system scatter fraction was determined using the scattered event rate.
Sensitivity
The point source was mounted on the animal bed in a small polystyrene foam holder. The source was positioned at the center of the PET scanner using real-time monitoring of the 1:1 coincidence counts. The source was then moved axially with the animal positioning mechanism. We performed measurements at 82 points. Taking into consideration the high resolution and long axial FOV of the scanner, we measured at every 0.585 mm only around the axial center and near the edges; in between, we increased the step size to 2.340 mm. Total sensitivity was calculated by interpolating the sensitivity profile for 0.585-mm steps in the whole FOV.
Data were binned with a 5-ns time window and a 250- to 750-keV energy window and were rebinned using the single-slice rebinning algorithm with a ring span of 81. Attenuation of the standard point source (about 12% (7)) was not corrected.
Image Quality, Accuracy of Attenuation, and Scatter Corrections
A NEMA image–quality phantom was supplied with the camera. The volume of the phantom was determined by measuring the difference between the weight of the filled and empty phantom. Activity in the phantom was measured in a dose calibrator (CRC-25R; Capintec Inc.). Because we found that our dose calibrator underestimates activities below 5 MBq, we filled the phantom with a higher activity of 18F-FDG and let the activity decay to the 3.7-MBq level.
The phantom measurement was reconstructed using the Tera-Tomo reconstruction engine with basic and full detector models. The first model uses only the expectation value of the γ-photon penetration depth whereas the second one takes into account the spatial distribution of the photon–detector interaction (16,17). Attenuation and scatter correction were enabled in both cases. Since acrylic glass gives no MR imaging signal, the 2-compartment attenuation map was generated from the computer-assisted-design drawings of the phantom. The reconstructed voxel size was 0.2 × 0.2 × 0.2 mm, and 48 iterations were performed in both cases. Regularization strength (TV-α parameter) was set to 0.001.
MR Imaging Measurements
The permanent magnet is sensitive to temperature changes. The temperature in the scanner room is stabilized at 21°C ± 1.5°C, usually rising by 3°C during working days and cooling back during the nights. The system can tolerate up to a 0.1-mT static external magnetic field.
Signal-to-Noise Ratio
The NEMA MS 1-2008 standard was designed for human imaging systems, and some specifications are not applicable in a preclinical setting, such that the signal-producing volume is smaller than 10 cm in diameter and does not reach 85% of the coil diameter. We used the quality assurance phantoms provided by the manufacturer: a plastic sphere 46 mm in inner diameter and a cylinder 21 mm in inner diameter and 60 mm in length. Both phantoms were filled with the same solution of NiCl2, having T1 and T2 relaxation times of 129 and 125 ms, respectively. The phantom was loading the 60-mm-diameter coil similar to a 150-g animal with its brain located at the isocenter. For the mouse coil, we did not test the relative load of the phantom, but we expect it to be equivalent to a smaller animal positioned for a brain examination. The phantoms were positioned in the center of the radiofrequency coil in the magnet isocenter. After the standard prescan calibration sequence, a single axial slice was acquired twice using a spin echo sequence (60-mm coil: 64-mm square FOV, 128 × 128 matrix, 600-ms repetition time (TR), 9.2-ms echo time (TE); 35-mm coil: 38-mm FOV, 64 × 64 matrix, 600/8.9-ms TR/TE; both: 2-mm slice thickness, 25-μs dwell time). The delay between the start of the 2 scans was 1:58 and 1:18 min for the 60- and 35-mm coils, respectively. No calibrations were performed between the 2 acquisitions.
To evaluate the signal-to-noise ratio, we measured signal on the first scan and estimated noise from the variation in the difference between the 2 consecutive images. The standard suggests 2 methods for calculating the noise: the SD method or a similar method in which pixel values are compared with the neighboring pixel in the phase-encoding direction instead of the average. The latter method is less sensitive to drift and therefore was used for data evaluation.
2D Geometric Distortion
Geometric fidelity was tested in the 60-mm coil using a phantom supplied by the instrument manufacturer. The test object was a sphere of 46-mm inner diameter with a cube inside and filled with a dilute solution of NiCl2. The face centers and edge centers of the cube were used as reference points. Single-slice spin echo scans were obtained in 3 orthogonal planes, each with two orthogonal frequency-encoding directions (256 × 256 matrix, 64-mm FOV, 2-mm slice thickness, 800/8.6-ms TR/TE).
Image Uniformity
Spin echo scans were performed in 3 orthogonal directions on the same phantoms as were used for the signal-to-noise ratio test (60-mm coil: 64-mm FOV, 256 × 256 matrix, 2-mm slice thickness, 800/8.6-ms TR/TE; 35-mm coil: 38-mm FOV, 128 × 128 matrix, 2-mm slice thickness, 800/8.9-ms TR/TE). The images were convolved with a 9-point low-pass filter according to the standard. Normalized absolute average deviation uniformity, defined as one minus the sum of absolute deviation from the mean divided by the sum of all pixel values within a VOI, was calculated in the axial, coronal, and sagittal sections.
Examples of Small-Animal Scans
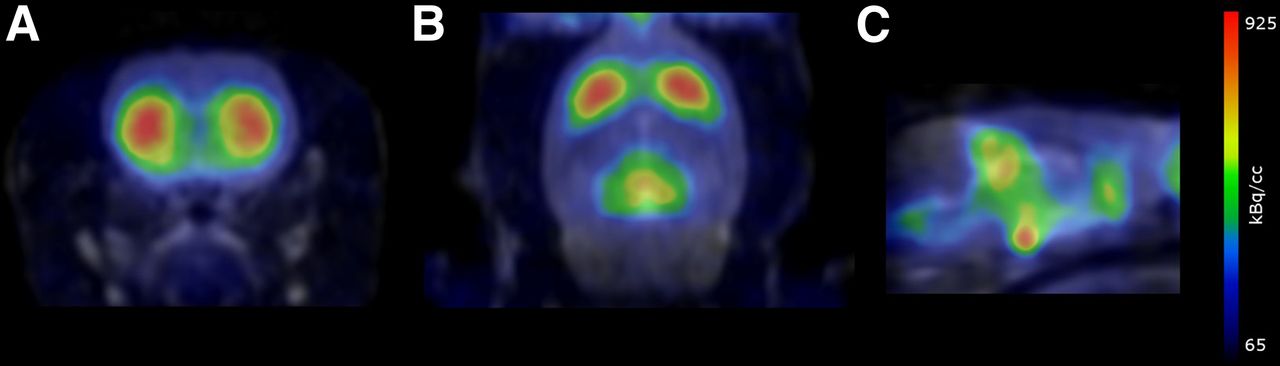
To demonstrate the potential of the system in small-animal imaging, 20.7 MBq of the extrastriatal dopamine D2/D3 receptor ligand 11C-FLB457 (18) was injected in the tail vein of a 270-g male rat. A 60-min scan was immediately initiated on injection of the radioligand. After the PET scan, an MR imaging scan was performed using a 28-min fast spin echo sequence (TR/TEeffective, 2,500/83.4 ms).
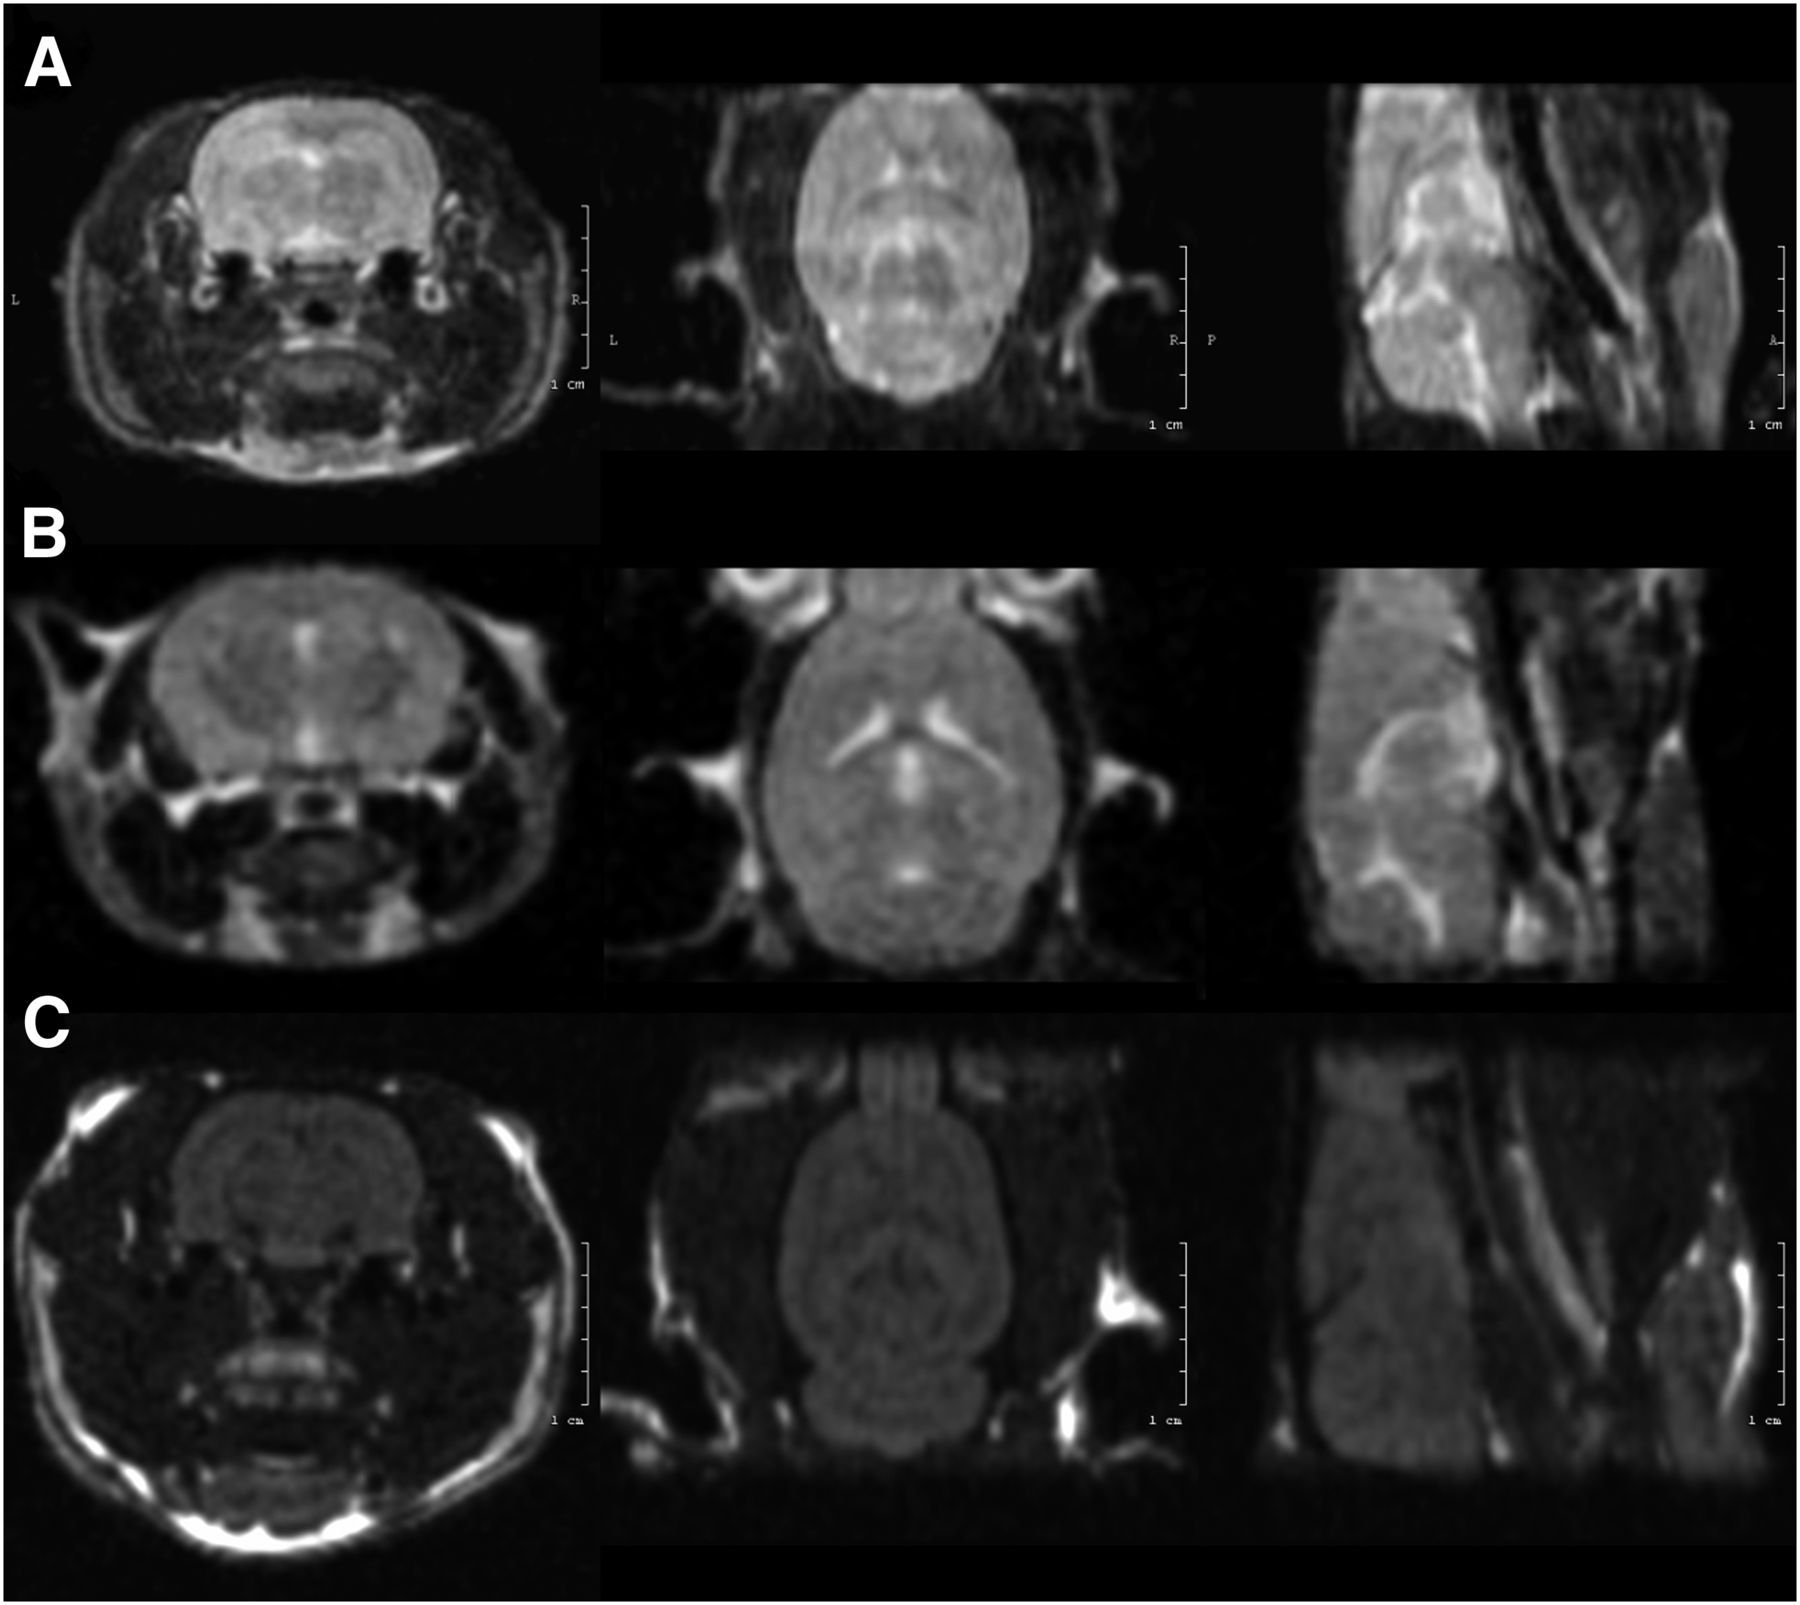
MR imaging performance is illustrated with 3D fast spin echo brain scans in a rat (healthy 258-g male Wistar rat; TR/TEeffective, 2,000/84.1 ms; 0.4 × 0.4 × 0.6 mm voxels; scan time, 22:24 min) and a mouse (healthy 22-g male C57BL/6J mouse; TR/TEeffective, 2,000/87.3 ms; 0.3 × 0.3 × 0.3 mm voxels; scan time, 20:00 min) and 3D spoiled gradient echo images (400-g male Wistar rat; TR/TE, 5.8/1.8 ms; flip angle, 60°; 0.4 × 0.4 × 0.6 mm voxels; scan time, 14:13 min).
All animal experiments were performed in accordance with the guidelines of the Swedish National Board of Laboratory Animals and the Karolinska Institutet’s guidelines for planning, conducting, and documenting experimental research (registration no. 4820/06-600) under protocols approved by the Animal Ethics Review Board of Northern Stockholm, Sweden. All imaging experiments were performed under isoflurane anesthesia (induction: 4%–5%, maintenance: 1.5%–2% in 50/50 air/oxygen).
RESULTS
PET Performance Measurements
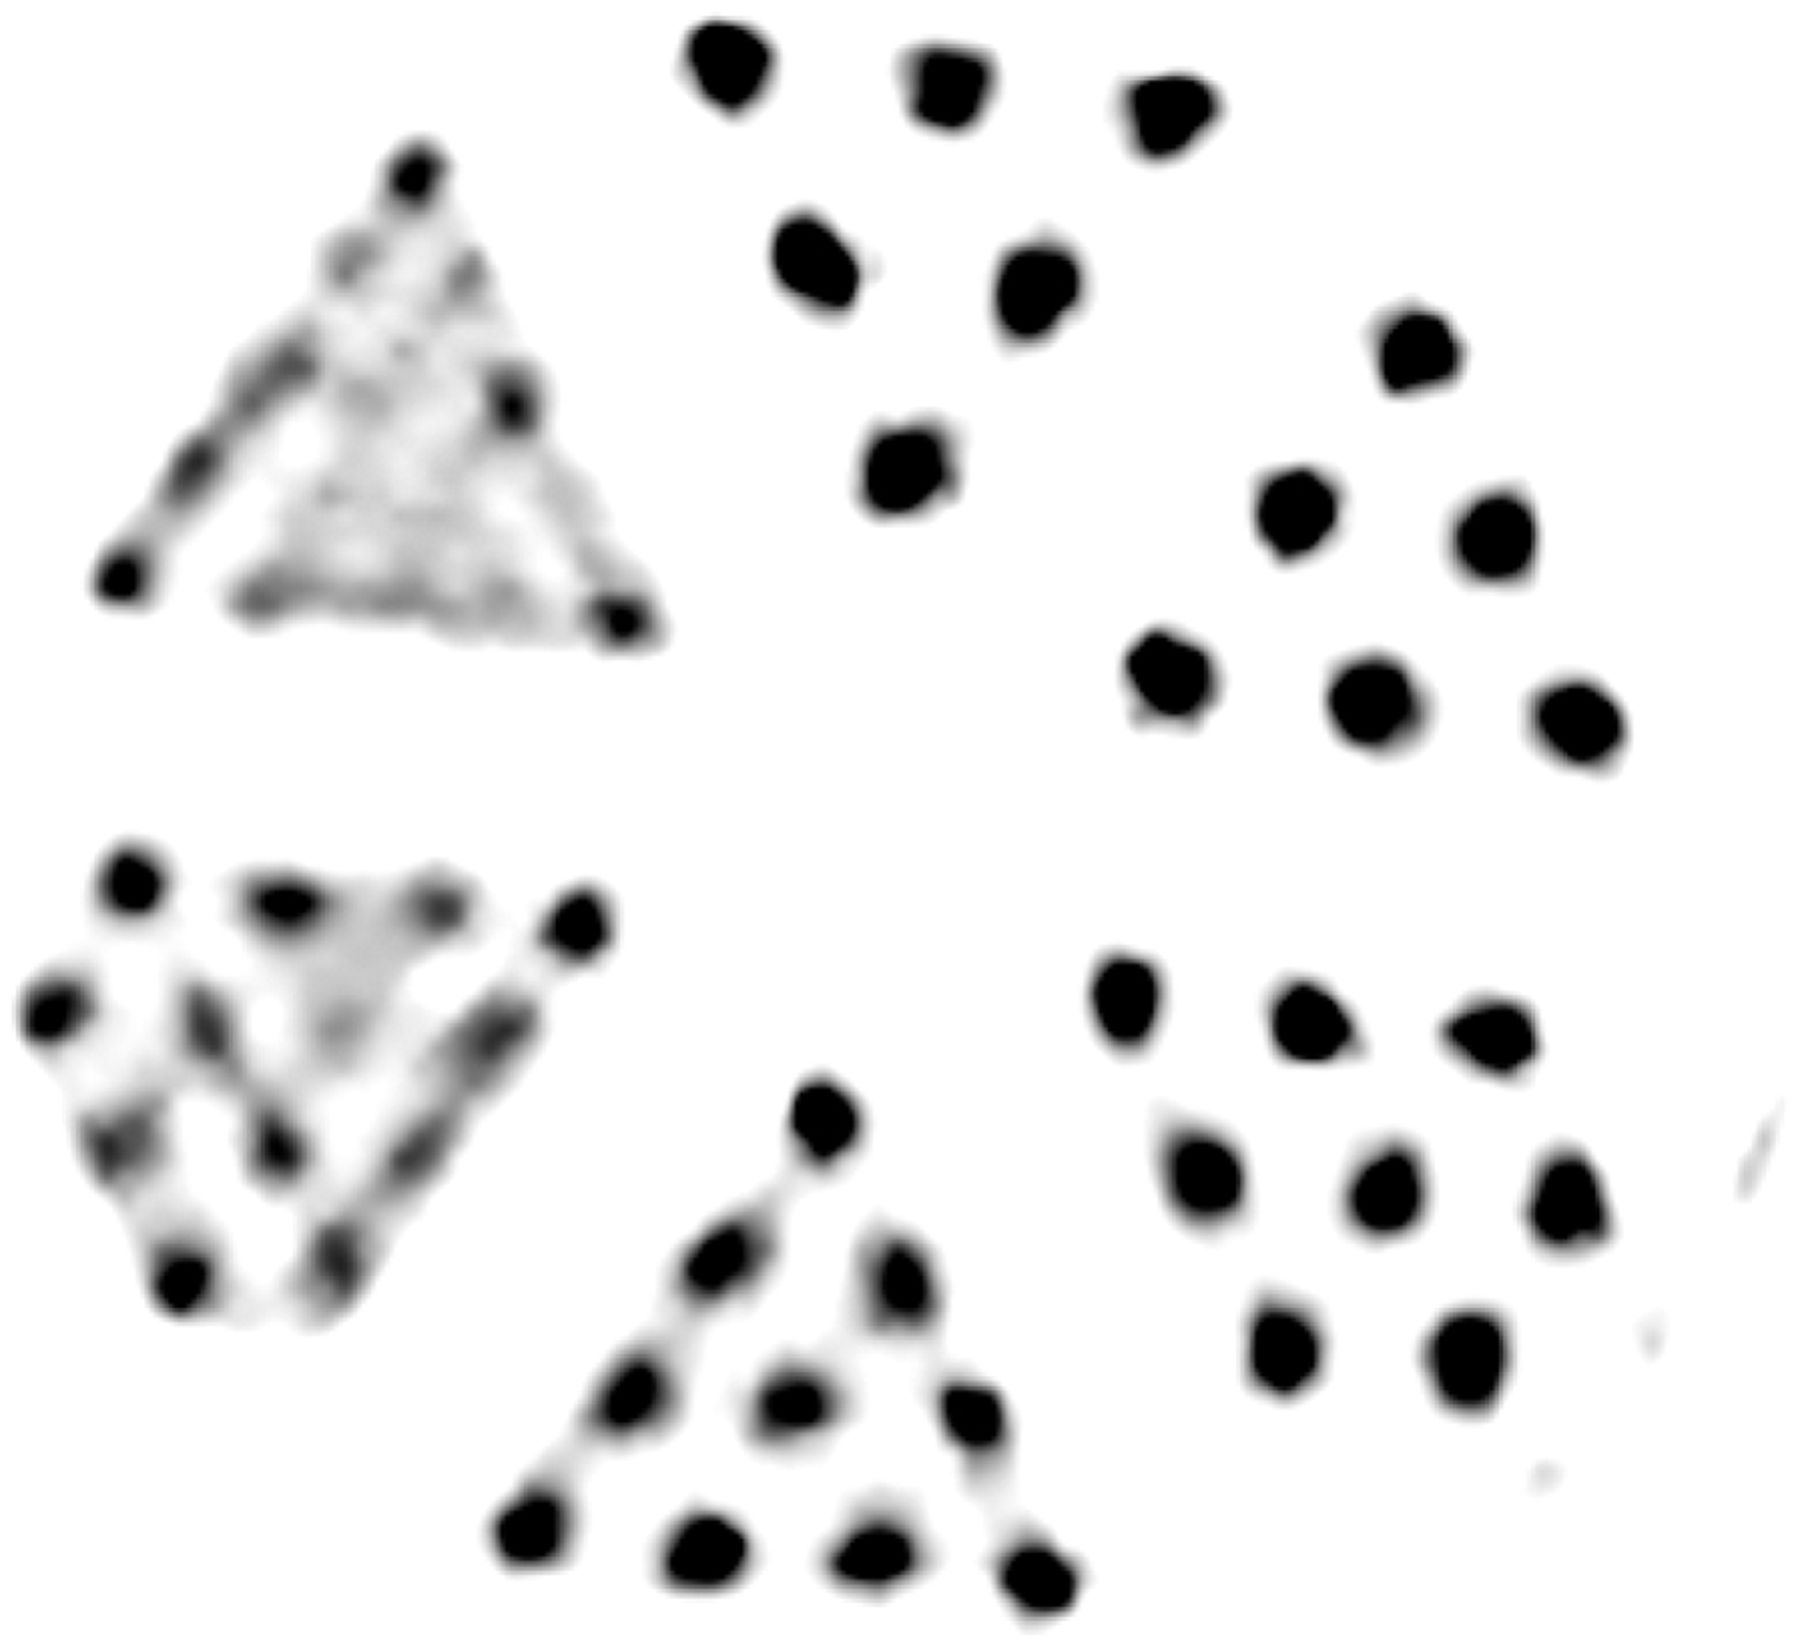
Spatial resolution, measured as the full-width-at-half-maximum and full-width-at-tenth-maximum spread of a point source in volumes reconstructed using 2D filtered backprojection, is listed in Table 1. Figure 2 shows a representative slice of the Derenzo resolution phantom.
NEMA NU 4 FWHM and FWTM Resolution Values at Different Radial Positions

Micro Derenzo phantom filled with 9.34 MBq of 18F-FDG. Diameters of rods in sections are 1.2, 1.1, 1.0, 0.9, 0.8, and 0.7 mm clockwise starting at 12 o’clock.
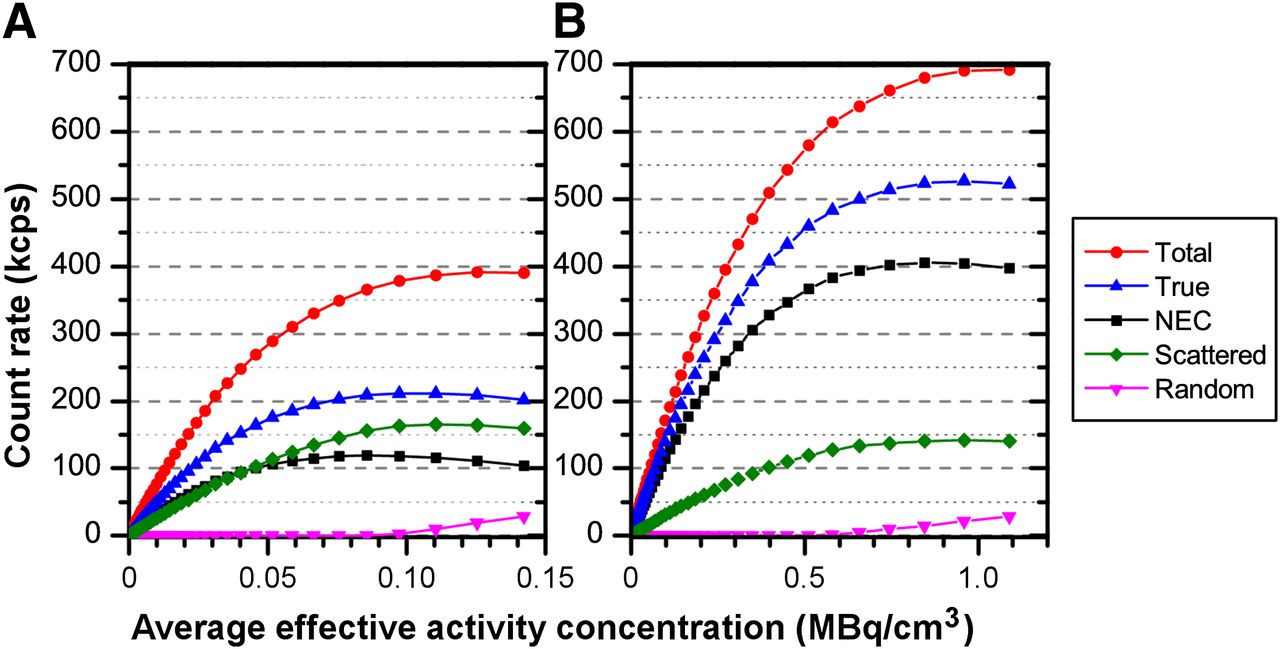
System total, true, random, and scattered event rates, and system noise-equivalent counting rate, are plotted as a function of average effective activity concentration in Figure 3 for mouselike and ratlike phantoms. For the mouselike phantom, the peak true counting rate is 692 kcps at 1.090 MBq/mL and the peak noise-equivalent counting rate is 406 kcps at 0.847 MBq/mL. For the ratlike phantom, the respective values are 392 kcps at 0.125 MBq/mL and 119 kcps at 0.086 MBq/mL. The difference in the peak noise-equivalent counting rate is caused by a higher coincidence peak for the mouselike phantom (because it is fully covered by the FOV, whereas the other phantom extends beyond the FOV) and by the fact that the scattered-to-true events ratio is worse for the thicker phantom.

NEMA NU 4 system total, true, random, and scattered event rate and system noise-equivalent counting rate as function of average effective activity concentration for ratlike (A) and mouselike (B) phantom.
The intrinsic radioactivity present in the lutetium yttrium oxyorthosilicate detector crystals produces a singles counting rate of 186 kcps. The scatter fraction at 5 times the activity level that produces the same number of singles as the intrinsic activity was 17.3% and 34% for the mouselike and ratlike phantoms, respectively.
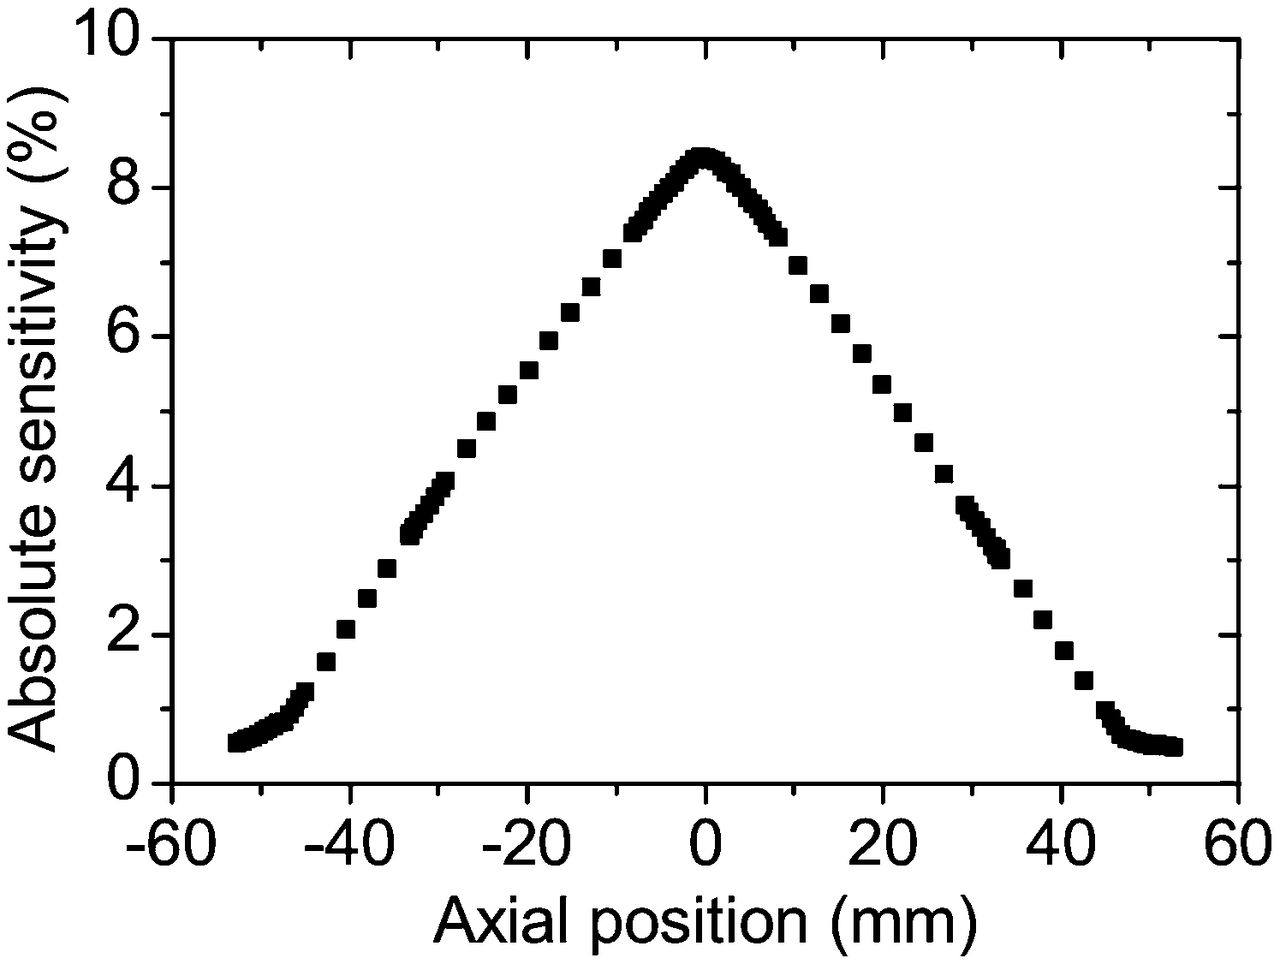
The axial sensitivity profile of the scanner is shown in Figure 4. Total sensitivity and total absolute sensitivity for the mouse-sized region were 52.8 cps/kBq and 5.83%, respectively. For rats, the respective values were 42.8 cps/kBq and 4.73%.

NEMA NU 4 axial absolute sensitivity profile.
The results of the image-quality phantom measurement are presented in Tables 2⇓–4.
PET Uniformity Test Results
PET Recovery Coefficients (RCs) for 5 Hot Rods of Different Diameters
Accuracy of Scatter Correction: Spillover Ratio in Water- and Air-Filled Cold Regions
MR Imaging Performance Measurements
The signal-to-noise ratio per unit volume of the MR imaging component was 113.8 and 111.5 per cubic millimeter using the 60- and 35-mm coils, respectively.
Linear geometric distortion in the axial, coronal, and sagittal planes was below 2.4%, 1.7%, and 4.3%, respectively. Deviation along the diagonals was at least 5 times higher than along the axes of the gradient system.
In the image uniformity measurements, the mean signal-to-noise ratio was 136 and 128 per cubic millimeter for the 35- and 60-mm coils, respectively. The results for normalized absolute average deviation uniformity are listed in Table 5.
MR Imaging–Normalized Absolute Average Deviation Uniformity in 3 Orthogonal Planes Across Isocenter
Examples of Small-Animal Scans
We tested the ability of the MR imaging component to provide anatomic images to aid in the evaluation of the associated PET, which requires 3D volumes with quasi-isotropic resolution. We present 3D fast spin echo images of a rat and mouse brain in Figures 5A and 5B, respectively, and 3D spoiled gradient echo images of a rat in Figure 5C. Figure 6 shows a combined PET/MR imaging study.

Three-dimensional MR brain scans: T2-weighted fast spin echo in rat, with scan time of 22:24 min (A); T2-weighted fast spin echo in mouse, with scan time of 20:00 min (B); and spoiled gradient echo in rat, with scan time of 14:13 min (C).

Fused 3D MR (fast spin echo) and PET images of striatum (A and B) and hypophysis (C) using 11C-FLB457 (summation image 5−60 min after injection) of healthy male Wistar rat.
DISCUSSION
We completed performance tests of a commercial preclinical PET/MR instrument. Tests of the NEMA NU4-2008 standard are suitable for comparing different types of PET hardware. The most important benchmark for our study is the PET component of the NanoPET/CT. The PET detector in the two instruments is almost identical, except for the reinforced magnetic shielding and a radiofrequency shield inside the PET ring for PET/MR. This comparison is a rigorous test for any adverse effects of the integration on the PET subsystem. We also compared the results with NEMA measurements performed on other commercial PET/CT and stand-alone PET instruments.
There is no performance test available for the standalone MR imaging system in the literature, and the NEMA standards for MR imaging systems are too flexible for use in cross-platform comparisons. As such, we evaluated the MR imaging performance practically and compared its features with those of an in vivo CT system.
Figure 7 compares the NEMA full-width-at-half-maximum spatial resolution in the central plane for several commercial PET systems. The results for the NanoPET and the nanoScan were similar. The instrument performed especially well in the central 20 mm, the relevant volume for rodent brain imaging.

The NEMA spatial resolution results were verified in phantom measurements. In an imaging study with a micro-Derenzo phantom, 0.8-mm rods were resolved, showing the true submillimeter imaging capabilities of the scanner.
Peak absolute sensitivity (in 250- to 750-keV energy window and approximately 5-ns time window) is compared for various scanners in Table 6. The sensitivity of the PET subunit is high in comparison with other systems. The 9% increase in PET sensitivity compared with the NanoPET is mostly ascribed to the lower attenuation properties of the bed and source holder.
Comparison of Peak Absolute Sensitivity for Different PET Scanners
The noise-equivalent counting rate of the nanoScan PET/MRI system meets the benchmark within 10%. This test is sensitive to the position of the phantom, and the difference is below the uncertainty of the measurement.
When appreciating the relatively low peak counting rate, one has to take into account that PET image quality is a strongly nonlinear function of spatial resolution: a 2-fold improvement of spatial resolution may compensate for approximately a 32-fold reduction of statistics (19), or 4 times worse sensitivity with 2 times better spatial resolution can yield improved image quality (20). Thus, the high resolution of the instrument compensates profusely for the slightly lower peak counting rates and, together with the high sensitivity, enables low-dose animal imaging.
Some of the image quality measures are compared for different scanners in Table 7. The system has excellent homogeneity and good recovery coefficients especially for small objects.
Comparison of Some PET Image–Quality Indicators for Different Scanners
To illustrate the image quality of the system in anatomic structures, 11C-FLB457, a radioligand with high affinity to both the striatal and the extrastriatal dopamine D2 receptors, was used. In Figure 6, the striatum (and other extrastriatal brain regions rich in dopamine D2 receptors, such as the midbrain [superior colliculus, periaqueductal gray, ventral tegmental area, and substantia nigra] and hypophysis) can be clearly and distinctively visualized.
A similar thorough evaluation of the MR imaging test result is hampered by the lack of a published performance assessment on the stand-alone MR imaging component, nor are standardized synthetic benchmarks to compare different MR imaging instruments available. We presented typical animal scans to illustrate the capabilities of the MR imaging component for anatomic central nervous system imaging.
Today, the standard modality combined with PET for anatomic imaging is CT. The workflow of the PET/MR instrument is similar to that of a PET/CT system. In the following, we try to evaluate the MR imaging as a modality complementary to PET. Comparison between different modalities is complex and we consider only 3 practical aspects here: image quality, imaging time, and the quality of input for PET reconstruction (i.e., attenuation map). This analysis also does not take into consideration the benefits of MR imaging in not using ionizing radiation, as opposed to CT imaging.
In terms of image quality, the superior soft-tissue contrast of MR imaging is an unbeatable advantage over CT in almost all applications and especially in central nervous system research. The higher spatial resolution and geometric accuracy of CT rarely provides a relative advantage over its poor contrast.
Conventional MR imaging can sometimes have a more time-consuming workflow. In the present system, a 3D scout image of a 6-cm axial region is acquired in 1.3 min. The prescan calibrations (frequency, shimming, radiofrequency attenuation) add an overhead of 3.2 min. This is comparable to the speed of a flat-panel CT scanner used in PET/CT systems. High-resolution brain scans are typically obtained in 20 min. This acquisition time enables an effective workflow and does not extend the length of anesthesia considerably.
In precise quantitative PET measurements, the attenuation of the γ-photons inside the subject has to be considered. Therefore, the reconstruction algorithm requires a map of linear attenuation coefficients within the imaging volume. Though the attenuation map can be measured directly by moving a radioactive source around the subject, approximate methods are widely accepted. These methods use a tomographic image, (e.g., a CT scan) and assign linear attenuation coefficients to the voxels using various models. Human PET imaging requires detailed attenuation maps, but in small-animal imaging simple models are adequate as the overall effect of attenuation is small. It has been shown that the simplest 2-compartment model, in which all tissues have water-equivalent behavior, gives excellent results (21). The gradient echo scout images of the MR imaging system are suitable for segmenting the body contours and for preparing the required attenuation maps.
CONCLUSION
In the present study, we evaluated the performance of the nanoScan PET/MRI preclinical scanner using various NEMA standards. By comparing the test results with those published for a PET/CT instrument with an almost identical PET ring, we have proven that system integration had no adverse effect on the PET performance and that improvements in reconstruction have significantly increased visible resolution. In comparison with other commercial small-animal PET scanners, the results are satisfying, especially in terms of resolution and sensitivity.
For the MR imaging subsystem, in addition to reporting the test results, we presented typical animal scans to illustrate the imaging performance of the device. Both image quality and acquisition time are adequate for routine anatomic imaging, and the benefits of the permanent magnet foundation make this a powerful, compact, and safe MR imaging system.
The present sequential PET/MR imaging instrument is a feasible and attractive alternative to a PET/CT system, with special regard to brain studies.
DISCLOSURE
The costs of publication of this article were defrayed in part by the payment of page charges. Therefore, and solely to indicate this fact, this article is hereby marked “advertisement” in accordance with 18 USC section 1734. The research group at the Karolinska Institutet has a research collaboration with Mediso Ltd., the company that developed the system described in the article. The present study was a joint project, and 3 of the authors are employees of the company. No other potential conflict of interest relevant to this article was reported.
Acknowledgments
The fruitful discussions and technical help of Dávid Völgyes and Judit Lantos and the organizing and management work of Gábor Németh and Domokos Máthé are gratefully acknowledged.
Footnotes
↵* Contributed equally to this work.
Published online Aug. 29, 2013.
- © 2013 by the Society of Nuclear Medicine and Molecular Imaging, Inc.
REFERENCES
- Received for publication December 25, 2012.
- Accepted for publication May 17, 2013.


Jump to section
Related Articles
Cited By...
- Imaging of T-cell Responses in the Context of Cancer Immunotherapy
- The gut microbiota influences skeletal muscle mass and function in mice
- Longitudinal Small-Animal PET Imaging of the zQ175 Mouse Model of Huntington Disease Shows In Vivo Changes of Molecular Targets in the Striatum and Cerebral Cortex
- 27-Hydroxycholesterol impairs neuronal glucose uptake through an IRAP/GLUT4 system dysregulation
- A novel thermoregulatory role for PDE10A in mouse and human adipocytes
- Combined PET/MR: A Technology Becomes Mature
- Principles of PET/MR Imaging