


Abstract
Attenuation correction (AC) of whole-body PET data in combined PET/MRI tomographs is expected to be a technical challenge. In this study, a potential solution based on a segmented attenuation map is proposed and evaluated in clinical PET/CT cases. Methods: Segmentation of the attenuation map into 4 classes (background, lungs, fat, and soft tissue) was hypothesized to be sufficient for AC purposes. The segmentation was applied to CT-based attenuation maps from 18F-FDG PET/CT oncologic examinations of 35 patients with 52 18F-FDG–avid lesions in the lungs (n = 15), bones (n = 21), and neck (n = 16). The standardized uptake values (SUVs) of the lesions were determined from PET images reconstructed with nonsegmented and segmented attenuation maps, and an experienced observer interpreted both PET images with no knowledge of the attenuation map status. The feasibility of the method was also evaluated with 2 patients who underwent both PET/CT and MRI. Results: The use of a segmented attenuation map resulted in average SUV changes of 8% ± 3% (mean ± SD) for bone lesions, 4% ± 2% for neck lesions, and 2% ± 3% for lung lesions. The largest SUV change was 13.1%, for a lesion in the pelvic bone. There were no differences in the clinical interpretations made by the experienced observer with both types of attenuation maps. Conclusion: A segmented attenuation map with 4 classes derived from CT data had only a small effect on the SUVs of 18F-FDG–avid lesions and did not change the interpretation for any patient. This approach appears to be practical and valid for MRI-based AC.
In the same way in which PET/CT has been shown to be a powerful multimodality imaging tool, there are compelling reasons for combining PET and MRI. PET/MRI would have the following advantages: improved soft-tissue contrast; the possibility of performing truly simultaneous instead of sequential acquisitions; and the availability of sophisticated MRI sequences, such as diffusion and perfusion imaging, functional MRI, and MR spectroscopy, which can add important information. Moreover, the use of PET/MRI would result in a significant decrease in radiation exposure, which is of foremost importance for serial follow-up and pediatric imaging.
Thus, a combined PET/MRI scanner would provide an alternative to a combined PET/CT scanner for whole-body oncologic imaging (1,2); improved accuracy could be achieved in the detection, staging, and characterization of several cancers (3–10). Moreover, the combination of PET and MRI is perfectly suited to neurologic imaging and offers new possibilities for cardiovascular imaging (11,12). Consequently, much research effort is being directed toward the development of combined imaging devices, and the initial results are promising (13–18).
However, a still-unsolved technical challenge for combined whole-body PET/MRI is the correction of attenuation and scatter in the PET data (19). For this purpose, an attenuation map with the radiodensity of each volume element for 511-keV photons is needed. For whole-body PET, there are currently 2 approaches for obtaining an attenuation map. The first approach is to acquire a transmission scan with external radionuclide sources; for work flow reasons, this scan is typically acquired in a few minutes and segmented to differentiate mainly the background, lungs, and soft tissue (Fig. 1A) (20,21). The second approach is to use spatially aligned CT data after a bilinear transformation to convert from CT Hounsfield units, which measure the radiodensity at x-ray energies, to attenuation factors at 511 keV (22); this is the most commonly used approach in PET/CT (Fig. 1B). Because combined PET/MRI tomographs will most likely include neither a radionuclide source nor an x-ray source, none of these approaches can be used, and alternative solutions must be developed.
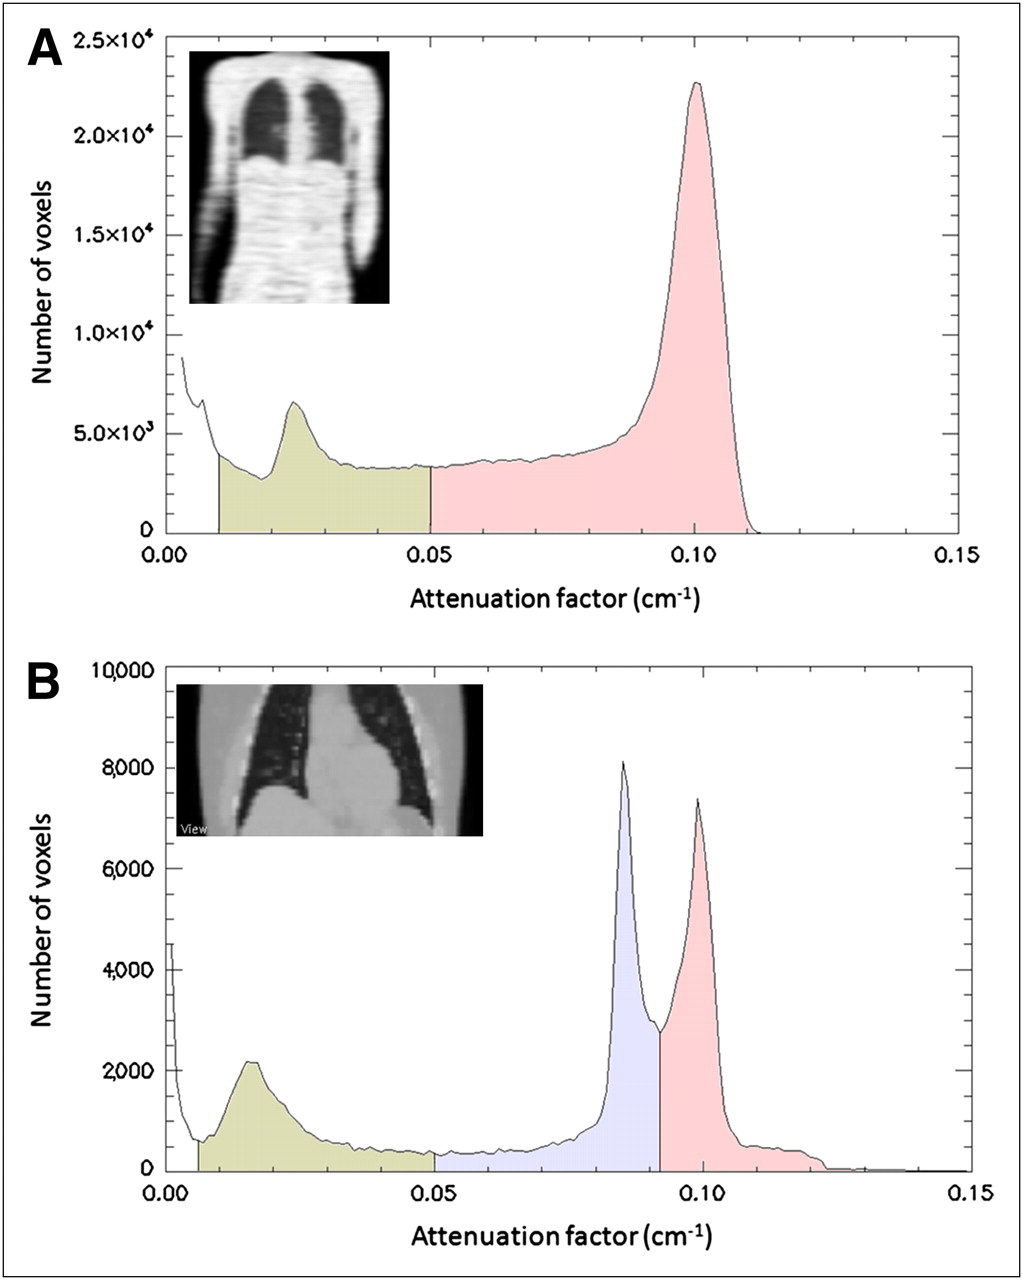
Histograms of attenuation maps obtained for thorax with radionuclide source (A) and with low-dose CT (B) and showing frequency of each attenuation factor in image. Radionuclide transmission scan acquired in a few minutes was able to distinguish mainly background, lungs, and tissue. CT-based attenuation map showed 3 distinct peaks: lungs, fat (0.086 cm−1), and soft tissue (0.10 cm−1). Voxels with density above 0.105 cm−1 corresponded to bone or to mixture of bone and soft tissue.
MRI data cannot be used directly for attenuation correction (AC) because the MR signal is not related to the radiodensity of biologic tissue. An example is cortical bone, which shows nearly no signal on MRI despite a high attenuating power.
In this work, a method suitable for whole-body MRI-based AC of PET data is presented and evaluated. The method involves the segmentation of an attenuation map into 4 classes: background, lungs, fat, and soft tissue. For the sake of robustness, no segmentation of bone is performed. Indeed, cortical bone shows a very low-intensity and nonspecific signal on MRI, so that its segmentation is challenging and error prone. However, ignoring the specific contribution of bone to photon attenuation makes the method invalid for neurologic imaging (23), for which alternative solutions have been investigated (24–26).
The proposed method can be used with any MR acquisition that would allow segmentation into the 4 classes. However, quantitative validation with MR acquisitions obtained on separate scanners is challenging, because inaccuracies in the nonrigid registration lead to errors in the attenuation-corrected images (27) that could be larger than the approximation done by the segmentation itself and consequently would not fully reflect the results expected from a combined scanner. Therefore, we quantified the effects that such a segmentation of the attenuation map would have had on the standardized uptake values (SUVs) of focal lesions in 35 patients who underwent PET/CT. In addition, the specific impact produced by the absence of bone in the attenuation map was assessed.
MATERIALS AND METHODS
Patient Population
The study population comprised 35 patients referred for whole-body 18F-FDG PET for the clinical staging of malignancy. The patients were retrospectively selected to include only cases for which the technical challenge to the proposed algorithm would be high. Therefore, only patients with bone metastases, lung nodules, or neck lesions with focal pathologic 18F-FDG uptake were selected. Lesions located in bones were expected to be the most sensitive to the absence of bone in the attenuation map, along with lesions in the neck because of the significant fraction of bones in this area. Lung lesions, on the other hand, were sensitive to the variable lung density in each patient.
The only conditions for patient selection were the presence and localization of 18F-FDG–avid lesions in the aforementioned regions. No other factors (e.g., age, weight, or malignancy) were considered. Altogether, 35 patients with 52 lesions were included in the study. Bone metastases were present in 9 patients (21 lesions: 12 in the pelvic bone, 8 in the spine, and 1 in the sternum), lung nodules were present in 14 patients (15 lesions), and neck lesions were present in 12 patients (16 lesions).
PET/CT Acquisition
All patients underwent a routine clinical 18F-FDG protocol for oncologic staging with a Siemens Biograph Sensation 16 PET/CT scanner (Siemens Medical Solutions). Patients were injected with 350–500 MBq of 18F-FDG, depending on their weights. The acquisition was started 90 min after tracer injection. For AC, low-dose CT (120 keV, 20 mAs) without an intravenous contrast agent was performed.
Data Processing
Attenuation maps were obtained from the CT data by bilinear transformation (22). The CT-based attenuation maps were then segmented, on the basis of the intensity of each voxel, into the 4 classes, and predefined attenuation factors were assigned as for the CT-based attenuation maps. The intensity mapping was done as follows: voxels in the range of 0–0.005 cm−1 were assigned to the background (0 cm−1), voxels in the range of 0.005–0.05 cm−1 were assigned to the lungs (0.018 cm−1), voxels in the range of 0.05–0.093 cm−1 were assigned to fat (0.086 cm−1), and voxels over 0.093 cm−1 were assigned to soft tissue (0.10 cm−1). The Interactive Data Language (version 6.4; ITT Visual Information Solutions) was used for all data processing. Note that the segmentation was based only on the intensity of each voxel, so that no assumptions were made regarding the locations of the tissues or organs. For example, because of the partial-volume effect, a voxel at the skin could be classified as lung, with its corresponding attenuation factor. Similarly, a mass in the lung could be classified as soft tissue rather than lung.
In addition, we sought to evaluate the specific importance of bone for AC of PET data. For this purpose, all bones were removed from the original CT-based attenuation map by replacement of all voxels that had attenuation factors over 0.105 cm−1 with the value 0.1 cm−1, corresponding to soft tissue.
PET sinogram data were reconstructed by use of the original CT-based attenuation map, the attenuation map segmented into 4 classes, and the attenuation map without bones, as summarized in Figure 2. PET reconstruction software (e7 tools) from Siemens Molecular Imaging was used for this purpose. The images were reconstructed by use of the ordered-subsets expectation maximization algorithm with 4 iterations and 8 subsets.

Diagram showing 3 different PET reconstructions obtained with various attenuation maps (μ-maps). (Left) Segmented attenuation map with predefined attenuation factors. (Center) Standard CT-based attenuation map. (Right) Attenuation map after removal of specific influence of bone.
Image Analysis
A volume of interest (VOI) was manually defined on the lesions. The VOI was defined on a fused view of the PET data reconstructed by use of the original attenuation map and the CT data, and the same VOI was used to assess the SUVs in all 3 PET reconstructions. The effects of the different modifications of the attenuation map were quantified as a change in the SUV as a percentage of the original SUV.
In addition, an experienced observer interpreted the images reconstructed by use of the original and segmented attenuation maps to evaluate whether the segmentation had an effect on the clinical interpretation of the studies. The observer was unaware of which attenuation map had been used for reconstruction.
MRI-Derived Attenuation Map
As a proof of principle for the application of MRI-based AC, 2 patients (both women, 49 and 70 y old) who underwent whole-body 18F-FDG PET/CT examinations showing mediastinal lymph node metastases also underwent MRI examinations with a 2-point Dixon MR sequence (28). Acquisition was performed with a clinical 1.5-T tomograph (Espree; Siemens Medical Solutions) and required 18 s for one bed position (21 cm).
The Dixon MR sequence is particularly well suited for segmentation because it provides separate water and fat images. The MRI and CT datasets were aligned by use of a combination of a rigid registration algorithm based on the maximization of mutual information and a dense, nonrigid registration method. The nonrigid deformation was modeled as a vector field obtained by composition of a small displacement maximizing a statistical measure of similarity between the images, as described previously (29).
Subsequently, the MRI datasets were used to create an attenuation map with 4 distinct classes: background, lungs, fat, and soft tissue. The image-processing steps are shown in Figure 3. Thresholds were determined for the fat and water images to identify the voxels corresponding to fat and soft tissue and to separate them from the background; voxels representing a mixture of fat and soft tissue were also used when the values in both images were above the thresholds. The lungs were identified by connected-component analysis of the air in the inner part of the body. Some voxels containing cortical bone were occasionally identified as air because of the absence of an MR signal, as were some voxels in the heart and aorta because of blood flow. This situation was addressed by application of a morphologic closing filter (5 mm in each spatial direction) to the binary tissue–air image. Finally, the attenuation coefficients corresponding to the PET/CT patient bed were added to the MRI-based attenuation map by replacing the corresponding part of the image. The last processing step before use for AC was carried out with the tomographic reconstruction software (e7 tools), consisting of 3-dimensional gaussian filtering of 5 mm, in the same manner as that used for a CT-based attenuation map.
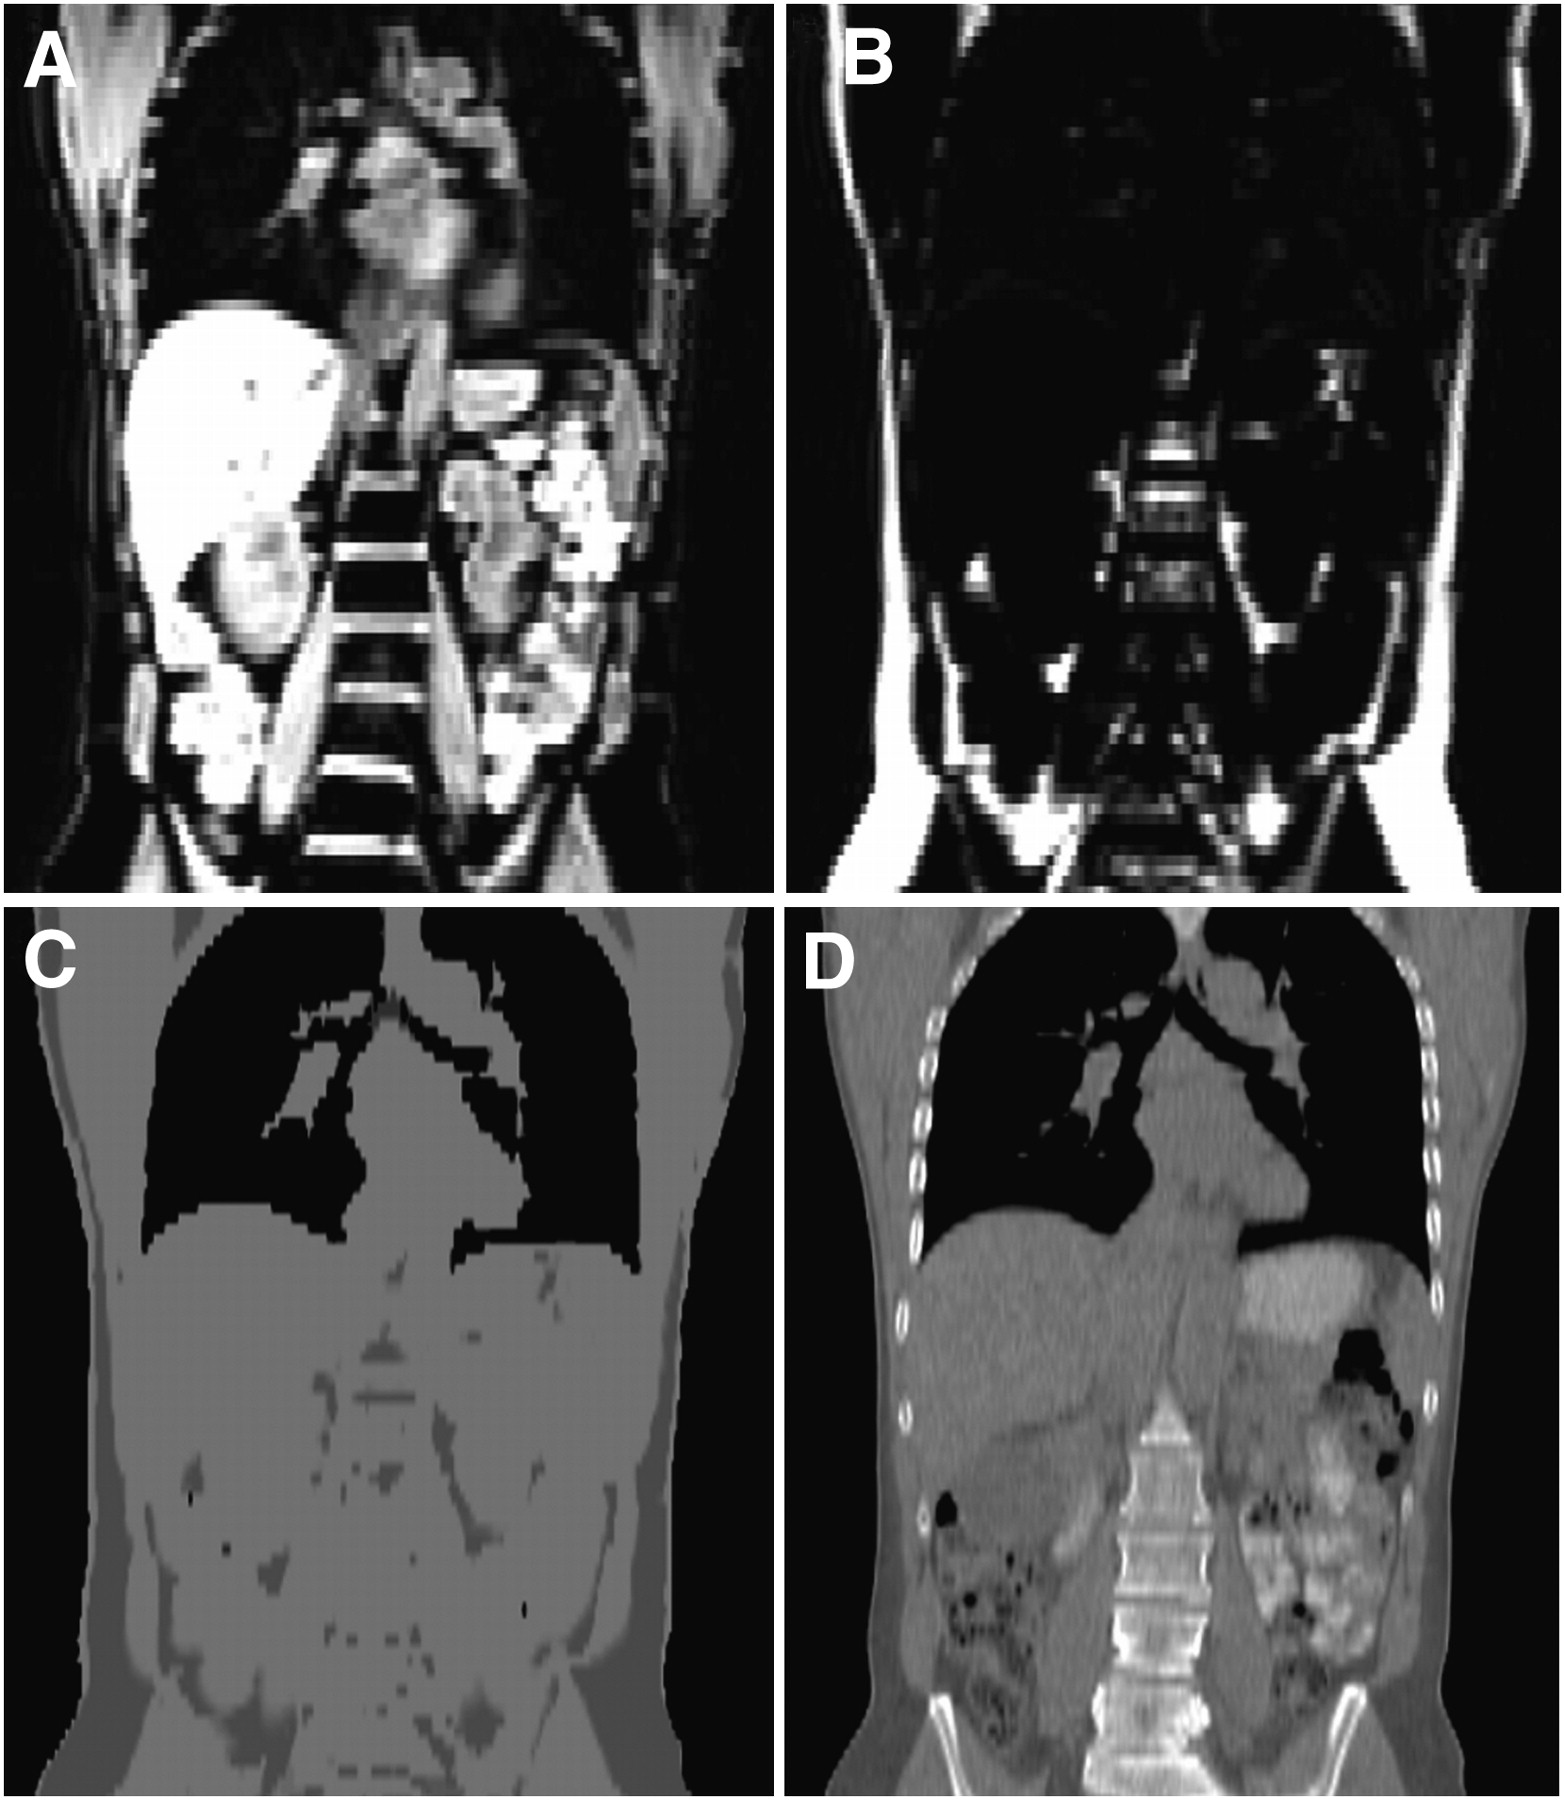
Segmentation of 2-point Dixon sequence for AC purposes. MRI water (A) and fat (B) images were combined and segmented to produce MRI-based attenuation map (C). (D) CT-based attenuation map of same patient shown for comparison.
The procedure used to derive the MRI-based attenuation map was fully automated. Manual interaction was needed only to identify the patient bed on the CT image so that it could be added to the MRI-based attenuation map.
RESULTS
The SUV changes resulting from the modification of the attenuation map depended largely on the location of the lesion considered, as summarized in Figure 4. The absence of bone in the attenuation map resulted in an undercorrection for bone attenuation, causing the SUVs of the lesions to be generally lower than the SUVs on the images reconstructed by use of the original attenuation map.

Differences in mean SUVs (top) and maximum SUVs (bottom) for each group of lesions produced by AC with segmented attenuation map (segm, ⋄) and attenuation map with bone removed (no bones, ▵) relative to AC with original map. Vertical bars indicate mean ± SD.
The average SUV on the PET images reconstructed by use of the segmented attenuation map decreased the most for osseous lesions, with an average decrease of 8.0% ± 3.3% (mean ± SD). The SUVs of lesions in the neck showed an average decrease of 3.8% ± 2.0%, and those of lung lesions decreased by 1.9% ± 2.3%. The SUV variations on the PET images reconstructed by use of the attenuation map without bones were comparable, indicating that the absence of bone was the main reason for these variations. The largest change observed for the 52 lesions considered was an underestimation of the SUV by 13.1%, which occurred for a lesion in the pelvic bone (Fig. 5).
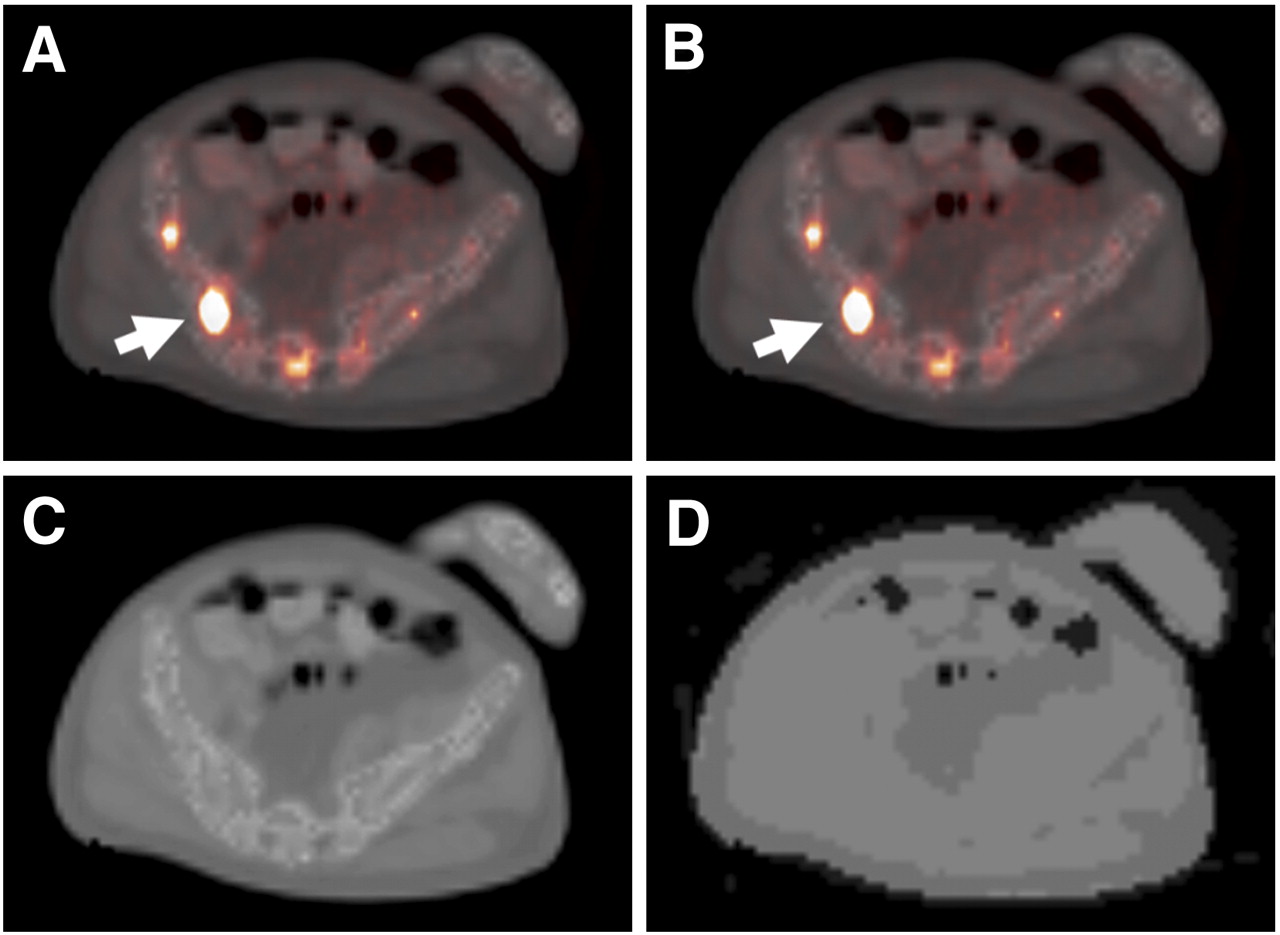
Lesion in pelvic bone (arrow) that showed largest SUV variation (13.1%) when reconstruction was done with segmented attenuation map. It was difficult to note any visual differences. (A) Original PET/CT image. (B) PET image reconstructed with segmented attenuation map fused to original CT image. (C) CT-based attenuation map. (D) Segmented attenuation map used to reconstruct image in B.
Examination of the PET images by an observer unaware of which attenuation map had been used for reconstruction revealed no differences in the clinical interpretations of the PET scans for all of the patients. Neither false-positive nor false-negative findings relative to the findings obtained with the original reconstruction were observed.
Although visual inspection of the complete PET image did not reveal noticeable changes in the activity distribution after segmentation of the attenuation map, detailed quantitative inspection revealed that the relative change in the SUV for background regions with low uptake could be significantly higher than that for lesions with high uptake. Regions with very low SUVs (<0.2) could occasionally show SUV variations of up to 50%, although this finding was clinically irrelevant. Such variations in regions with very low uptake could be related to numeric instability in the reconstruction algorithm. Furthermore, the correlation coefficients for the original and segmented attenuation maps as well as for the PET images reconstructed by use of these attenuation maps were found to be greater than 0.98.
For patients undergoing both PET/CT and MRI examinations, the SUV of a mediastinal lymph node metastasis decreased by 4.6% with MRI-based AC, compared with CT-based AC, for the first patient and by an average of 2.3% (range, −6%–+1%, in 6 VOIs located in different lymph node metastases) for the second patient (Fig. 6). Despite the use of a nonrigid registration, the exact values must be considered carefully because they represent a combination of variations resulting from 2 different sources, namely, the segmentation of the attenuation map and potential inaccuracy in the spatial registration between images.

Attenuation map (left), PET images (middle), and fused PET/CT images (right) of patient with multiple 18F-FDG–avid mediastinal and bihilar lymph node metastases. (Top) Original CT-based attenuation map and PET image reconstructed with this map. (Bottom) MRI-based attenuation map for region indicated by dashed lines and PET image reconstructed with this map. Use of MRI-based attenuation map resulted in average SUV change of 2.3% for 6 lymph node metastases relative to results obtained with CT-based AC.
DISCUSSION
The use of a segmented attenuation map with the 4 described classes resulted, in most cases, in a slight decrease in the SUV, especially in bone lesions, which were affected the most by the absence of bone in the attenuation map. The largest SUV change observed in the 52 lesions considered was 13.1%, for a patient with a metastasis in the pelvic bone, whereas lung and neck lesions showed only minor SUV changes (<8%). Reconstruction by use of the segmented attenuation map had no impact on the clinical interpretations of the images for all of the patients.
Even small SUV changes, like those reported here, can be critical in the context of patient follow-up. An SUV change (before and shortly after the start of therapy) of −25% can result in a different conclusion regarding tumor responsiveness to the current therapy than an SUV change of −35% and therefore can have an impact on patient care. It is important to note that the variation observed when using the segmented attenuation map as compared with the CT-based attenuation map would not prevent the segmented map and a potential MRI/PET scanner using this technique to be accurate for patient follow-up. Indeed, the SUV variation introduced by the segmented attenuation map should remain constant for a tumor throughout examinations at several time points.
The decreased SUV obtained for bone lesions with the segmented attenuation map agrees with the findings of Nakamoto et al. (30), who reported shortly after the emegence of PET/CT scanners that calculated radioactive concentrations in osseous lesions were higher with CT-based AC than with germanium-based AC (average difference, 11%). As with fast transmission measurements, bones cannot be reliably segmented in whole-body MRI data. The absence of bone had an impact on lesion quantification, but this impact was small for all lesions, even those located in the pelvic bone and lumbar vertebrae. However, the influence of bone could be higher in neurologic studies because of the skull, through which all photons must pass before they reach the detectors. Therefore, the proposed segmented attenuation map is not suitable for neurologic PET.
For all other regions of the body, the observed deviations should be placed in perspective when other aspects are taken into account. First, the transition from radionuclide-based attenuation to CT-based attenuation resulted in a comparable variation for osseous lesions (30). Second, greater variability (10%) is observed in repeated patient measurements as a result of all factors affecting the acquisition and data analysis (31,32). Third, CT enhanced with iodinated contrast medium is being used for AC of PET data in many centers despite its acknowledged bias (33–35); these studies showed that when CT scans with intravenous contrast agents were used for AC, average variations in the maximum SUV were 6% for the liver, 17% for the heart, 27% for the subclavian vein, and 8% for the site of primary malignancy. However, these variations did not result in differences in the clinical interpretations of the PET scans in any of the studies.
An alternative approach for MRI-based AC is atlas-based registration, in which the known distribution of attenuation factors of the atlas can be applied to the patient data after registration. This technique offers the benefit of taking bone into account for photon attenuation. Although this approach performs well in neurologic studies, the registration of whole-body images to an atlas is much more demanding and error prone because the thorax and abdomen do not have the same rigidity as the head. Experience with PET/CT so far has shown that even small emission–transmission misregistrations can have an impact on the diagnostic findings (36,37). Moreover, anatomic variations, which are common in cancer patients and often essential for AC, cannot be considered by an atlas. Figure 7 illustrates this situation for a patient with a lung tumor and pulmonary edema, abnormalities that cannot be considered by an atlas. The potential absence of the lung tumor in the attenuation map would result in a variation in the tumor SUV of 35%. In contrast, the segmented attenuation map would use the real tissue distribution and therefore would be more suitable for use with unusual anatomies.

Patient with tumor in right lung and pulmonary edema in left lung. Attenuation maps used for reconstruction (left) and reconstructed PET images fused to original CT images (right) are shown. (Top) Original CT-based attenuation map. (Middle) CT-based attenuation map with lung tumor manually removed from map. (Bottom) Segmented attenuation map. Although segmented attenuation map resulted in change in SUV of +1.6%, deletion of lung tumor resulted in change in SUV of −35%, indicating potential pitfalls for atlas-based approaches.
Although the results obtained with the segmented attenuation map showed potential for clinical use, a more extensive evaluation with MRI data for different lesions should be performed to validate the approach. Moreover, further improvements must be considered. Automated segmentation of cortical bone in whole-body MRI would be an obvious advantage, but it still does not appear to be feasible, despite recent developments (38,39). On the other hand, even though the average SUV variation of lung lesions was very small, the SD was relatively large (Fig. 4). The reason for this variation was the use of a constant attenuation factor for the lung (0.018 cm−1) that did not take into account intra- and interpatient variability. A variable attenuation factor for lung tissue should be investigated on the basis of the assumption that the MR signal intensity in the lung increases linearly with lung density. This approach would allow the variable lung density in each patient to be taken into account.
Furthermore, the method described here can account for patient-related photon attenuation, but for the correction to be complete, other attenuating components present during the acquisition (e.g., patient bed and surface coils) should be spatially localized and included in the attenuation map. In addition, the MRI field of view must cover the entire patient in each axial plane; this issue can be particularly problematic with large patients and when the acquisition is done with the arms down, because the field of view of most clinical MRI scanners is less than 55 cm (40). For combined PET/CT scanners, this problem was solved by means of nonlinear extrapolation of the truncated projections (41), but because the acquisition physics are fundamentally different, other approaches should be investigated to compensate for a potentially limited field of view in MRI.
CONCLUSION
Segmentation of the attenuation map into 4 classes for clinical PET/CT data resulted in small differences in the SUVs. These differences depended on the localization of the lesion, and the largest differences were observed for osseous lesions. There were no differences in the clinical interpretations for all of the patients. Because MRI sequences with the required contrast properties are readily available, our approach provides the basis for MRI-derived AC.
Acknowledgments
We thank Brigitte Dzewas and Sylvia Schachoff for their excellent technical assistance. We are thankful to Dr. Takahiro Higuchi for valuable discussions and to Dr. Jasmine Schirmer for editorial assistance. This project was supported in part by a research grant from Siemens Medical Solutions.
Footnotes
-
COPYRIGHT © 2009 by the Society of Nuclear Medicine, Inc.
References
- Received for publication July 18, 2008.
- Accepted for publication December 8, 2008.


Jump to section
Related Articles
Cited By...
- Dosimetry of [64Cu]FBP8: a fibrin-binding PET probe
- Impact of ComBat Harmonization on PET Radiomics-Based Tissue Classification: A Dual-Center PET/MRI and PET/CT Study
- Evaluation of Deep Learning-Based Approaches to Segment Bowel Air Pockets and Generate Pelvic Attenuation Maps from CAIPIRINHA-Accelerated Dixon MR Images
- Prognostic role of PET/MRI hybrid imaging in patients with pulmonary arterial hypertension
- Promise of Fully Integrated PET/MRI: Noninvasive Clinical Quantification of Cerebral Glucose Metabolism
- Improving 68Ga-PSMA PET/MRI of the Prostate with Unrenormalized Absolute Scatter Correction
- Early Postoperative 18F-FET PET/MRI for Pediatric Brain and Spinal Cord Tumors
- Generation of PET Attenuation Map for Whole-Body Time-of-Flight 18F-FDG PET/MRI Using a Deep Neural Network Trained with Simultaneously Reconstructed Activity and Attenuation Maps
- Dixon-VIBE Deep Learning (DIVIDE) Pseudo-CT Synthesis for Pelvis PET/MR Attenuation Correction
- The Effect of Including Bone in Dixon-Based Attenuation Correction for 18F-Fluciclovine PET/MRI of Prostate Cancer
- Improving the Accuracy of Simultaneously Reconstructed Activity and Attenuation Maps Using Deep Learning
- Reproducibility of MR-Based Attenuation Maps in PET/MRI and the Impact on PET Quantification in Lung Cancer
- Evaluation of Sinus/Edge-Corrected Zero-Echo-Time-Based Attenuation Correction in Brain PET/MRI
- MR/PET Imaging of the Cardiovascular System
- Can PET/MR Imaging Assess Coronary Artery Plaque Biology?
- Coronary Artery PET/MR Imaging: Feasibility, Limitations, and Solutions
- PET/MRI for Oncologic Brain Imaging: A Comparison of Standard MR-Based Attenuation Corrections with a Model-Based Approach for the Siemens mMR PET/MR System
- The Effect of Susceptibility Artifacts Related to Metallic Implants on Adjacent-Lesion Assessment in Simultaneous TOF PET/MR
- PET/MRI in the Presence of Metal Implants: Completion of the Attenuation Map from PET Emission Data
- 4-Dimensional MRI and Attenuation Map Generation in PET/MRI with 4-Dimensional PET-Derived Deformation Matrices: Study of Feasibility for Lung Cancer Applications
- Imaging the Cytokine Receptor CXCR4 in Atherosclerotic Plaques with the Radiotracer 68Ga-Pentixafor for PET
- Prediction of CT Substitutes from MR Images Based on Local Diffeomorphic Mapping for Brain PET Attenuation Correction
- Reproducibility of MRI Dixon-Based Attenuation Correction in Combined PET/MR with Applications for Lean Body Mass Estimation
- Impact of MR-Based Attenuation Correction on Neurologic PET Studies
- Dixon Sequence with Superimposed Model-Based Bone Compartment Provides Highly Accurate PET/MR Attenuation Correction of the Brain
- MRI-Based Attenuation Correction for PET/MRI Using Multiphase Level-Set Method
- Quantifying the Area at Risk in Reperfused ST-Segment-Elevation Myocardial Infarction Patients Using Hybrid Cardiac Positron Emission Tomography-Magnetic Resonance Imaging
- Fast Patch-Based Pseudo-CT Synthesis from T1-Weighted MR Images for PET/MR Attenuation Correction in Brain Studies
- Fetal Radiation Dose from 18F-FDG in Pregnant Patients Imaged with PET, PET/CT, and PET/MR
- Quantitative Evaluation of Segmentation- and Atlas-Based Attenuation Correction for PET/MR on Pediatric Patients
- Whole-Body PET/MR Imaging: Quantitative Evaluation of a Novel Model-Based MR Attenuation Correction Method Including Bone
- Reconstruction-Incorporated Respiratory Motion Correction in Clinical Simultaneous PET/MR Imaging for Oncology Applications
- Clinical Assessment of Emission- and Segmentation-Based MR-Guided Attenuation Correction in Whole-Body Time-of-Flight PET/MR Imaging
- Impact of Time-of-Flight PET on Quantification Errors in MR Imaging-Based Attenuation Correction
- MR-Based Attenuation Correction Using Ultrashort-Echo-Time Pulse Sequences in Dementia Patients
- Clinical Evaluation of Zero-Echo-Time MR Imaging for the Segmentation of the Skull
- Evaluation of 18F-Fluoride PET/MR and PET/CT in Patients with Foot Pain of Unclear Cause
- Integrated 18F-FDG PET/MR Imaging in the Assessment of Cardiac Masses: A Pilot Study
- Motion Correction Strategies for Integrated PET/MR
- Hybrid PET/MR Imaging: An Algorithm to Reduce Metal Artifacts from Dental Implants in Dixon-Based Attenuation Map Generation Using a Multiacquisition Variable-Resonance Image Combination Sequence
- PET Attenuation Correction Using Synthetic CT from Ultrashort Echo-Time MR Imaging
- An SPM8-Based Approach for Attenuation Correction Combining Segmentation and Nonrigid Template Formation: Application to Simultaneous PET/MR Brain Imaging
- Fat-Constrained 18F-FDG PET Reconstruction in Hybrid PET/MR Imaging
- Radiotracer Dose Reduction in Integrated PET/MR: Implications from National Electrical Manufacturers Association Phantom Studies
- Potential Clinical Applications of PET/MR Imaging in Neurodegenerative Diseases
- Principles of PET/MR Imaging
- Systematic Comparison of the Performance of Integrated Whole-Body PET/MR Imaging to Conventional PET/CT for 18F-FDG Brain Imaging in Patients Examined for Suspected Dementia
- PET/MR Imaging in the Detection and Characterization of Pulmonary Lesions: Technical and Diagnostic Evaluation in Comparison to PET/CT
- Performance of Whole-Body Integrated 18F-FDG PET/MR in Comparison to PET/CT for Evaluation of Malignant Bone Lesions
- Improvement of Attenuation Correction in Time-of-Flight PET/MR Imaging with a Positron-Emitting Source
- Qualitative and Quantitative Comparison of PET/CT and PET/MR Imaging in Clinical Practice
- MR-Based Attenuation Correction Methods for Improved PET Quantification in Lesions Within Bone and Susceptibility Artifact Regions
- Systematic Evaluation of Phantom Fluids for Simultaneous PET/MR Hybrid Imaging
- PET and MR Imaging: The Odd Couple or a Match Made in Heaven?
- Respiratory Motion Correction in Oncologic PET Using T1-Weighted MR Imaging on a Simultaneous Whole-Body PET/MR System
- Hybrid PET/MR Imaging of the Heart: Potential, Initial Experiences, and Future Prospects
- Comparison of Segmentation-Based Attenuation Correction Methods for PET/MRI: Evaluation of Bone and Liver Standardized Uptake Value with Oncologic PET/CT Data
- Workflow and Scan Protocol Considerations for Integrated Whole-Body PET/MRI in Oncology
- Variable Lung Density Consideration in Attenuation Correction of Whole-Body PET/MRI
- First Clinical Experience with Integrated Whole-Body PET/MR: Comparison to PET/CT in Patients with Oncologic Diagnoses
- MRI-Based Attenuation Correction for Hybrid PET/MRI Systems: A 4-Class Tissue Segmentation Technique Using a Combined Ultrashort-Echo-Time/Dixon MRI Sequence
- MRI-Based Attenuation Correction for Whole-Body PET/MRI: Quantitative Evaluation of Segmentation- and Atlas-Based Methods
- PET/MRI: Paving the Way for the Next Generation of Clinical Multimodality Imaging Applications