


Abstract
Metalic implants may affect attenuation correction (AC) in PET/MR imaging. The purpose of this study was to evaluate the effect of susceptibility artifacts related to metallic implants on adjacent metabolically active lesions in clinical simultaneous PET/MR scanning for both time-of-flight (TOF) and non-TOF reconstructed PET images. Methods: We included 27 patients without implants but with confirmed 18F-FDG–avid lesions adjacent to common implant locations. In all patients, a clinically indicated whole-body 18F-FDG PET/MR scan was acquired. Baseline non-TOF and TOF PET images were reconstructed. Reconstruction was repeated after the introduction of artificial signal voids in the AC map to simulate metallic implants in standard anatomic areas. All reconstructed images were qualitatively and quantitatively assessed and compared with the baseline images. Results: In total, 51 lesions were assessed. In 40 and 50 of these cases (non-TOF and TOF, respectively), the detectability of the lesions did not change; in 9 and 1 cases, the detectability changed; and in 2 non-TOF cases, the lesions were no longer visible after the introduction of metallic artifacts. The inclusion of TOF information significantly reduced artifacts due to simulated implants in the femoral head, sternum, and spine (P = 0.01, 0.01, and 0.03, respectively). It also improved image quality in these locations (P = 0.02, 0.01, and 0.01, respectively). The mean percentage error was −3.5% for TOF and −4.8% for non-TOF reconstructions, meaning that the inclusion of TOF information reduced the percentage error in SUVmax by 28.5% (P < 0.01). Conclusion: Qualitatively, there was a significant reduction of artifacts in the femoral head, sternum, and spine. There was also a significant qualitative improvement in image quality in these locations. Furthermore, our study indicated that simulated susceptibility artifacts related to metallic implants have a significant effect on small, moderately 18F-FDG–avid lesions near the implant site that possibly may go unnoticed without TOF information. On larger, highly 18F-FDG–avid lesions, the metallic implants had only a limited effect. The largest significant quantitative difference was found in artifacts of the sternum. There was only a weak inverse correlation between lesions affected by artifacts and distance from the implant.
Unlike PET/CT, for which CT transmission data are used for PET photon attenuation correction (AC), the MR data in PET/MR are not related to the electron density of the tissue but rather to the proton density and relaxation properties. Therefore, current PET/MR systems commonly use atlas- or segmentation-based methods to approximate the AC (1,2). The atlas-based methods use a population-averaged, CT-based AC map that is fit to the MR images of the individual patient (3). The segmentation-based methods often use in-phase or opposed-phase MR datasets, from which fat and water images are calculated using a Dixon-based method. These images are segmented into 3 or 4 tissue classes, such as air, lung, fat, and nonfat soft tissue (4). These regions are then assigned a representative predefined attenuation coefficient. Other methods allow for continuous variation of attenuation coefficients between fat and nonfat soft tissue (5). Because bones are not easily imaged by MR, this tissue is currently replaced by soft tissue in the segmentation-based methods.
Metallic implants such as prostheses, pacemakers, dental implants, and surgical clips are known sources of MR artifacts (6). The ferromagnetic material disturbs the local magnetic field homogeneity, potentially resulting in signal voids in the MR image. This effect may lead to inconsistencies in the AC maps and in the attenuation-corrected PET images (7–9). Changes in SUV may have an impact on follow-up examinations. Complete missing of lesions may lead to an incorrect diagnosis and incorrect therapeutic management (7,8).
New solid-state photodetector devices currently offer TOF capabilities in simultaneous PET/MR scanners (10). The PET image reconstruction process becomes better conditioned with the inclusion of TOF information and is therefore less sensitive to inaccuracies in the measured data. Therefore, although the effect of the metallic implants on the MR images and thus on the AC map remains unchanged, the TOF information might reduce the effect of the incorrect AC map on the PET image (9,11–16).
The purpose of this study was to evaluate the effect of susceptibility artifacts related to metallic implants on adjacent metabolically active lesions in clinical simultaneous PET/MR scanning for both TOF and non-TOF reconstructed PET images.
MATERIALS AND METHODS
Patients
This prospective study included 146 patients with various malignant tumors. All patients were referred clinically for a whole-body 18F-FDG PET/MR examination. Exclusion criteria were contraindications to MRI, such as severe claustrophobia and MRI-incompatible implants. From this group, we selected all patients having confirmed malignant disease and 18F-FDG–avid lesions adjacent to common implant locations (Table 1) but no real implants near these locations (17 women, 10 men; median age, 63 y; range, 21–83 y). The cantonal ethics committee approved the study, and all subjects gave written informed consent. Parts of this patient population are being evaluated in other studies in a different context.
Mean Absolute Percentage Error in SUVmax and Percentage Error Reduction Due to Inclusion of TOF Information, for Each Clinically Relevant Location
PET/MR Imaging
All patients fasted for at least 4 h before 18F-FDG was administered. The injected dose was 3 MBq/kg of body weight for patients weighing 85 kg or less and 3.5 MBq/kg otherwise. After the 60-min standardized uptake time, patients were scanned supine with the arms down in the simultaneous TOF PET/MR system (SIGNA PET/MR; GE Healthcare) (9). The whole-body acquisition consisted of 6 bed positions (2 min/position) from the vertex of the skull to the mid thighs. The TOF timing resolution of the scanner was approximately 400 ps, and it uses an atlas-based AC method for the patient’s head and a continuous fat- and water-based method in the other regions (3,5). For this AC, a multistation whole-body, 3-dimensional, dual-echo radio frequency spoiled gradient-recalled echo sequence was performed automatically. Other MR sequences were included when deemed necessary for the clinical indication.
After the acquisition, all baseline PET images were reconstructed with and without TOF using the system’s default 3-dimensional ordered-subsets expectation maximization iterative algorithm. It includes all default corrections, such as decay, scatter, randoms, dead time, attenuation, normalization, and detector response. For both situations, we applied 3 iterations, 28 subsets, a 60-cm field of view, and a 256 × 256 image grid. Images were filtered in image space using an in-plane gaussian convolution kernel with a full width at half maximum of 4.0 mm, followed by a standard axial filter with a 3-slice kernel using relative weights of 1:4:1. The procedure was similar to that used in other studies (9).
Simulating Artifacts
Metallic implants can cause susceptibility artifacts, which lead to signal voids in the MR AC maps. To simulate the effect on adjacent tumors, we inserted elliptic volumes with air-equivalent density as a simplified model into the low-resolution MR AC maps. The locations and sizes were comparable to real, clinically relevant artifacts in PET/MR AC maps (Table 1) (9). The MR AC maps were edited with MATLAB (version R2013b; The MathWorks Inc.). The model insertion was repeated in at least 5 patients for every implant location. The TOF and non-TOF reconstructions were repeated with the simulated artifacts in the AC map.
PET Image Analysis
The PET images with simulated artifacts were examined clinically and compared with the baseline images on a dedicated workstation (Advantage, model AW4.6; GE Healthcare) that allowed images to be viewed side by side as well as in fused mode. Differences in the images were scored in 4 categories (Table 2) by a nuclear medicine physician and a dually accredited radiologist–nuclear medicine physician with, respectively, 5 and 14 y of experience. The shortest distance between the borders of the lesions on the PET image and the signal voids on the AC map was also measured. Lesions inside the signal void were assigned distance zero. For the quantitative analysis, regions of interest were drawn around the lesions, and SUVmax was obtained. Percentage errors, introduced by the implant artifact on the AC map, were calculated ([SUVmax,artifact –SUVmax,baseline]/SUVmax,baseline × 100%). The percentage error reduction due to the inclusion of TOF was also calculated. In addition, percentage error maps were calculated on a voxel-by-voxel basis to visualize the spatial extent of the errors, produce absolute percentage error contour maps, and visualize the error distribution by means of histogram analysis. To avoid high error values in regions of limited interest, only voxels with a baseline SUV of at least 0.05 g/mL were included.
Scoring Categories
Statistical Analyses
Statistical analyses were performed using Prism, version 5.04 (GraphPad Software Inc.). Differences in mean percentage errors for each anatomic region in TOF and non-TOF PET images were ascertained and compared using the Wilcoxon matched-pairs signed-ranks test. A difference was deemed statistically significant when P was less than 0.05. The Spearman correlation between the percentage error and the distance between the lesion and the artifact was also calculated.
RESULTS
In total, 51 lesions were assessed in 27 patients. In 2 patients, we found a small (6-mm-diameter) lesion with moderate 18F-FDG uptake on the baseline PET images not detectable on the non-TOF PET images with a simulated femoral head prosthesis. In the reconstructed TOF PET images, the SUVs of these lesions were reduced, but both lesions were still visible. An example of such a case is presented in Figure 1, which shows a lesion on the MR image and a simulated artifact on the AC map. Its effect on the resulting PET image is shown in Figure 2A and Supplemental Figure 1 (supplemental materials are available at http://jnm.snmjournals.org) for both the non-TOF and the TOF reconstructions.

Example of small metastatic bone lesion in right acetabular roof (red arrow). (A) “Water” image as derived by system from MR images. (B) Corresponding MR AC map with introduced artifact (blue arrow), simulating signal void resulting from susceptibility artifact related to metallic hip implant.

Three examples of baseline PET images, of PET images reconstructed with simulated metallic artifact in AC, and of absolute percentage error contour plots. (A) Patient with small (moderate 18F-FDG uptake) metastatic bone lesion in right acetabular roof (arrow). (B) Patient with multiple lung lesions. (C) Patient with large (high-grade 18F-FDG uptake) lesion in lung.
Small (10- to 20-mm-diameter) lesions with higher-grade 18F-FDG uptake (compared with the previous 2 cases) suffer less from artifacts, as can be appreciated in Figure 2B, showing a patient with multiple small lung lesions at short distances from the implant artifact. All lesions are visible on both non-TOF and TOF PET images.
In larger (30- to 40-mm-diameter) lesions with high 18F-FDG uptake, the effect of TOF on error reduction due to metallic implants is rather limited (depending on the distance from the implant). For example, Figure 2C shows a patient who has a large lung tumor with high 18F-FDG uptake. After the introduction of a simulated spinal implant, the lesion appears the same on both non-TOF and TOF reconstructed images.
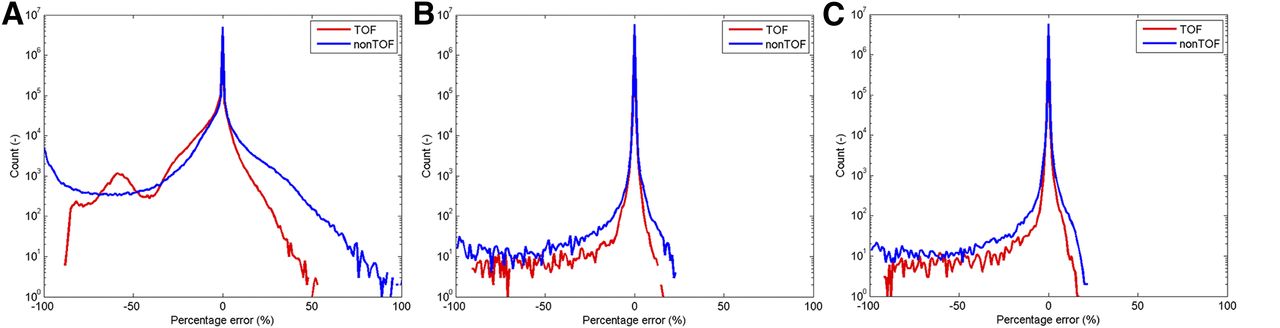
The contour plots (Fig. 2) and the percentage error histograms (Fig. 3) show that inclusion of TOF reduced the percentage error in the 3 cases mentioned here. TOF also reduced the small percentage error in the tumor region of interest. However, in the last 2 cases the effect on the measured SUVmax in the tumor was minimal. There was no significant difference in error between the non-TOF and TOF reconstructed PET images for these larger lesions with higher-grade 18F-FDG uptake.

Three examples of percentage error histograms. Graphs A, B, and C correspond to the 3 patients in Figure 2.
Qualitative Assessment
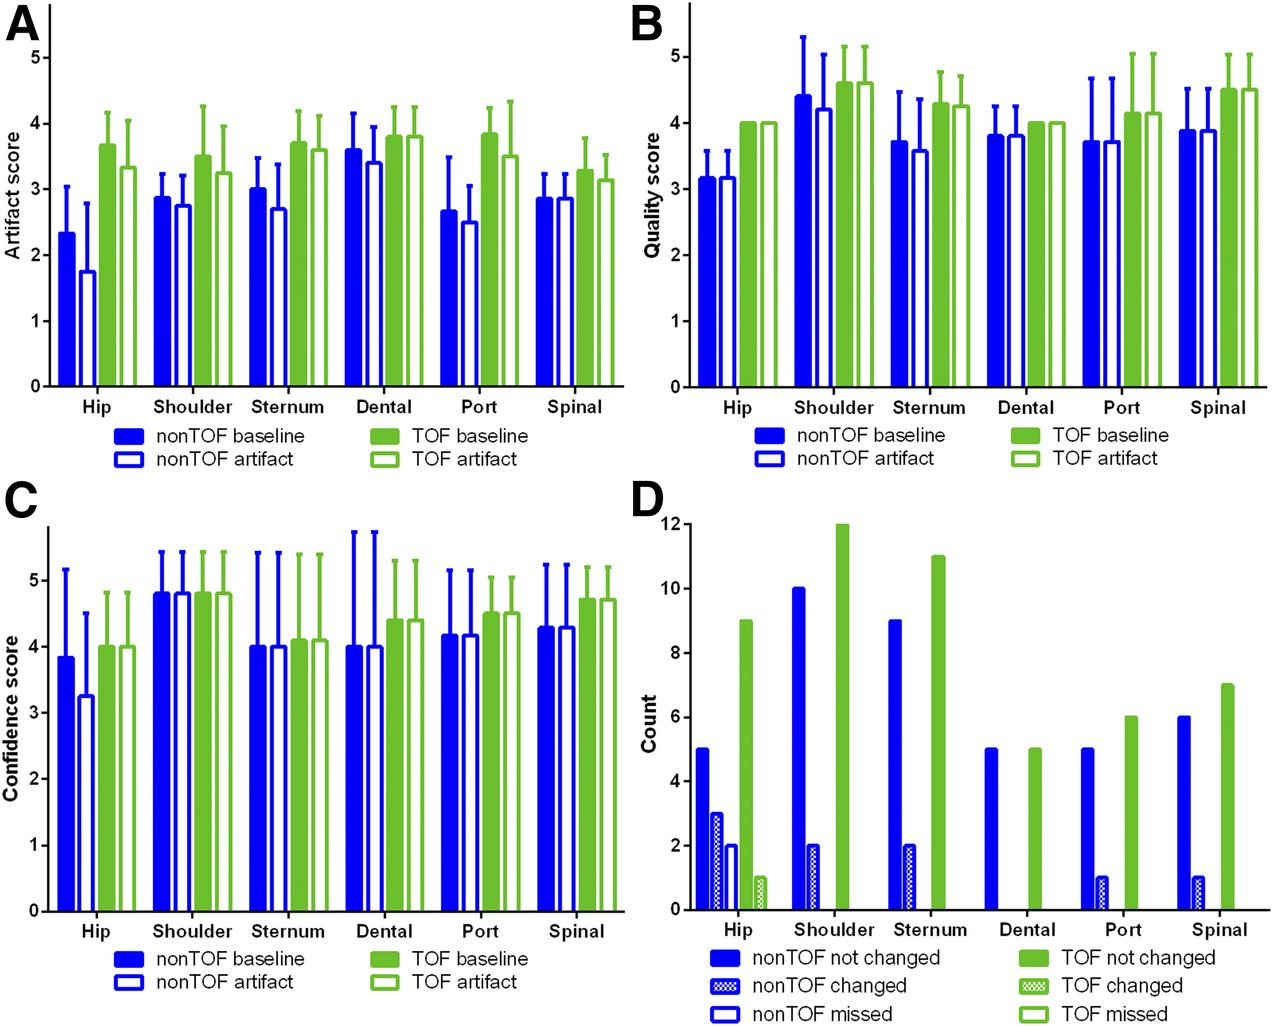
On average, both the baseline TOF PET reconstructions and the TOF PET reconstructions with simulated artifacts contained fewer artifacts, had better image quality, and engendered greater interpreter confidence than the non-TOF PET reconstructions, in all locations (Fig. 4). The inclusion of TOF information significantly reduced artifacts due to simulated implants in the femoral head, sternum, and spine (P = 0.01, 0.01, and 0.03, respectively) and improved image quality (P = 0.02, 0.01, and 0.01, respectively). Supplemental Figure 2 shows an example of a sternum case.

Scoring results: degree-of-artifacts score (A), overall image quality score (B), interpreter confidence score (C), and detectability-of-lesion score (D). Count is number of lesions. “Not changed” means there was no difference, “changed” means there was a difference, and “missed” means lesion was no longer visible after introduction of metallic artifact. Error bars indicate SD.
After the introduction of metallic artifacts, the detectability of the lesions did not change in 50 of the 51 cases for the TOF PET reconstructions and in 40 of the 51 cases for the non-TOF PET reconstructions (Fig. 4).
Quantitative Assessment
With the inclusion of TOF information, 33 of the 51 lesions had a lower percentage error in SUVmax. In 10 datasets, however, the percentage error in SUVmax increased. The mean SUVmax difference (artifact – baseline) was small, at only −0.42 g/mL (range, −2.63 to 0.03 g/mL) for TOF and −0.43 g/mL (range, −2.58 to 0.26 g/mL) for non-TOF PET reconstructions. This corresponds to a mean percentage error of −3.5% (range, −43.0%–0.15%) for TOF and −4.8% (range, −82.2%–1.5%) for non-TOF PET reconstructions. Therefore, inclusion of TOF reduced the percentage error in SUVmax by 28.5% (P < 0.01). When the values were grouped by implant location, the reduction in percentage error due to TOF ranged from −2.3% to 59.8% (Table 1; Fig. 5).
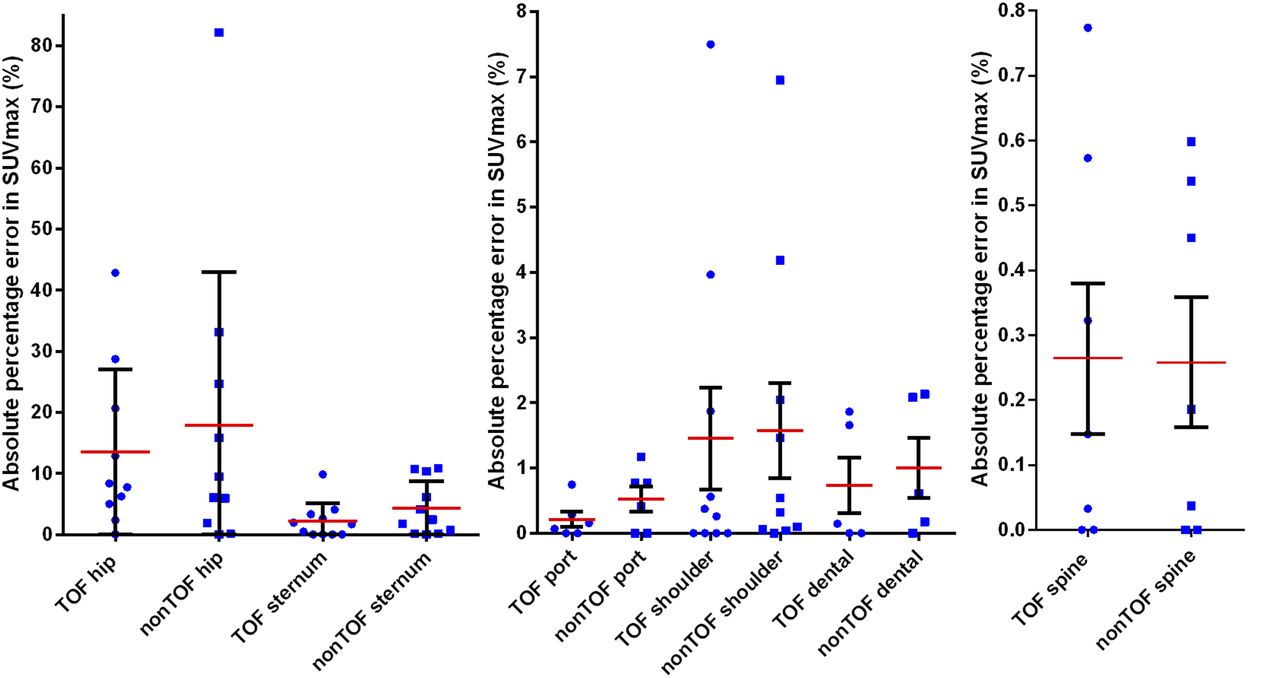
Absolute percentage errors in SUVmax for both TOF and non-TOF images in 6 relevant implant locations. Blue dots (TOF) and squares (non-TOF) indicate individual lesions; red and black lines indicate mean and SD, respectively.
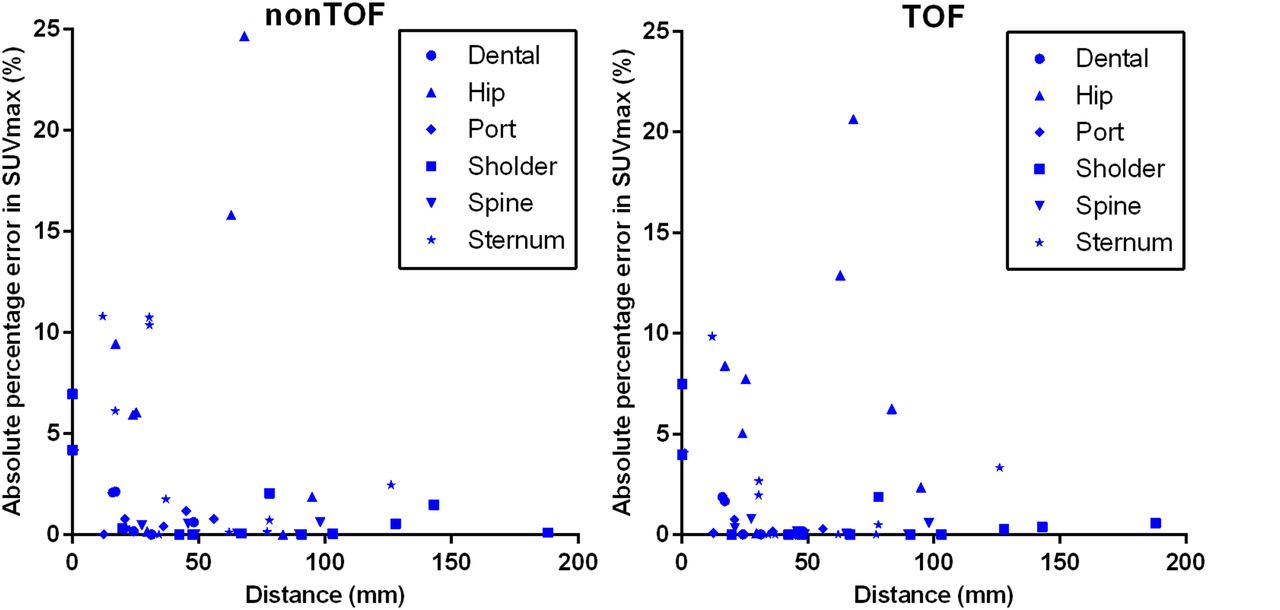
The relationship between absolute percentage error in SUVmax and distance between lesion and implant artifact is shown in Figure 6. The mean distance was 51 ± 40 mm. A weak inverse correlation (Spearman r = −0.38 and −0.30 and P < 0.01 and 0.03 for non-TOF and TOF, respectively) was found between the 2 parameters.

Scatterplots showing relationship between absolute percentage error in SUVmax and distance between lesion and implant artifact for both non-TOF and TOF reconstructed PET images. Key indicates implant location. Two data points were beyond maximum range of these plots and are therefore not shown: at distance 0 mm, 82% and 43%, and at 31 mm, 33% and 29% (non-TOF and TOF, respectively).
Histogram Analysis
The histograms of the percentage error in SUV showed an asymmetric peak around zero, as can be seen in Figure 3, for example. Because of the simulated signal void in the AC map, the SUVs in the corresponding region were lower in the PET images. This caused the large negative tail in the histograms. PET activity originating from the signal void location in the AC map was partially redistributed to other areas, where it introduced a positive error (Supplemental Fig. 1). The histograms with the simulated humeral or femoral head implant showed a wider histogram curve than the other anatomic sites. The AC artifact was larger in these 2 locations, resulting in more and larger absolute errors. In general, the voxels in and surrounding the artifact area had higher absolute errors in the non-TOF reconstructed PET images than in the reconstructed ones (Fig. 1; Supplemental Fig. 1).
DISCUSSION
In this study, we assessed the effect of simulated susceptibility artifacts related to metallic implants on the diagnostic evaluation of 18F-FDG–avid lesions on non-TOF and TOF reconstructed PET images. In the quantitative evaluation, most studied cases had a lower percentage error than expected when an artifact was introduced, whereas in the qualitative evaluation larger differences were seen.
We observed an advantage in lesion detectability using TOF information in cases with small lesions having faint or moderate uptake and located close to metallic implants. In particular, the 2 cases in which 2 lesions were scarcely visible on non-TOF PET images illustrate that implants near small lesions may lead to an underestimation of the patient’s metastatic status on non-TOF PET/MR scans and, as a consequence, an insufficient or incorrect therapeutic management. In larger lesions with high 18F-FDG uptake, the effect of TOF on qualitative evaluation was limited.
In the qualitative evaluation, the inclusion of TOF information significantly reduced artifacts and improved overall PET image quality in images with the hip prostheses, spinal fusion, and sternum implants. However, we did not find statistically significant improvements in the interpreter confidence assessment.
In the quantitative evaluation, most of the analyzed cases benefited from incorporation of TOF information in the PET reconstruction. Because of the inclusion of TOF information, the overall percentage error in SUVmax was significantly reduced (P < 0.01), by 28.5%. This reduction varied, however, from −2% to 60% depending on the specific implant location. Only in the sternum was a statistically significant improvement observed (P = 0.02).
The Spearman correlation showed only a weak dependence between percentage error in SUVmax and distance between lesion and simulated implant. This finding can partially be explained by the fan-shaped artifacts seen in the reconstructed PET images and visualized more clearly in the error contour plots. Some lesions, possibly close to the implant site, were between the streaks of the fan-shaped PET artifact and thus had only a limited error. Other lesions, possibly even farther from the implant, were within the streak artifact and thus had an increased absolute error. Also, the change in SUVmax due to the artifact in lesions with high-grade 18F-FDG avidity was relatively low, whereas the change in SUVmax in lesions with low-grade 18F-FDG avidity was consequently relatively high.
The histogram comparison between the TOF and non-TOF reconstructed PET images indicates that incorporation of TOF information reduced high-magnitude errors and increased low-magnitude errors. This finding was confirmed by the TOF contour plots (e.g., the hip prosthesis case), which showed that the central artifact with high-magnitude errors was smaller. TOF changed the distribution of smaller errors away from the origin of the artifact, meaning that lesions distant from the metallic implant might be affected by a small-magnitude error in TOF imaging. On the non-TOF contour plots, on the other hand, a larger central artifact with high-magnitude errors could be appreciated. The large photopenic area on the non-TOF reconstructed PET images could possibly lead to missing of pathologic uptake and subsequently to an incorrect diagnosis. The benefit of using TOF information in relation to metallic artifacts lies in the ability to improve the detectability of small lesions with faint to moderate 18F-FDG uptake near the implant site.
One other way to circumvent the missing of lesions is by adding PET reconstructions without AC. Such PET images cannot, however, be used for quantification and are diagnostically inferior. Several advanced MR techniques to reduce metallic artifacts are also commercially available. Some, such as the multiacquisition variable-resonance image combination and short–echo-time imaging, are already available for PET/MR and have shown potential in metallic artifact correction (17–21). Correcting the metallic artifacts on the MR image also improves the AC map and thus the PET image. Combining these techniques with TOF PET acquisitions will possibly reduce the impact of metallic artifacts on PET images even further.
Another way to circumvent metallic artifacts in the AC map is the use of maximum-likelihood reconstruction of activity and attenuation. This method tries to simultaneously reconstruct emission and attenuation images from PET emission data only (16,22–27). Moreover, external positron sources for transmission scanning can be used (28,29), as can the background radiation from the 176Lu present in Lu2Sio5:Ce scintillators (15,30). Other solutions might include, for example, whole-body AC models with bone tissue and possibly implants (31). MR sequences such as zero echo time allow the imaging of bone tissue and improve the AC maps (32–34). However, most of these new methods are still under investigation and not yet commercially available.
Our study had several limitations. The number of subjects was relatively low. The differences in histopathology, and the consequently diverse 18F-FDG avidity, might have influenced the detectability of lesions and changed the impact of TOF information on lesion detectability. However, this design allowed us to study the influence on both low-uptake lesions and high-uptake lesions. Also, not all lesions were near the simulated implants. The artifact certainly has a greater influence and effect when it is directly next to the lesion in question. A larger and histopathologically more homogeneous population might lead to a more robust estimation of the artifact error on lesions. In addition, comparison of TOF and non-TOF reconstructed PET images is not completely straightforward because of the accelerated convergence rate of the iterative algorithm with TOF. The optimal convergence properties for non-TOF turned out to be in somewhat the same range as the recommended settings for TOF. Having the same number of subsets and iterations for both non-TOF and TOF reconstructions ensured that both reconstructions converged. The excess number of iterations or subsets in TOF did not result in a significant visual improvement; in contrast, it mainly added more noise, as was also confirmed by previous phantom tests. Finally, evaluation of the images was not masked with respect to non-TOF and TOF, because TOF PET images are visually recognizable (13,14).
One possible and interesting field for future evaluation could be 68Ga-PSMA PET/MR in patients with hip prostheses and small low-uptake pelvic lymph node or bone metastases.
CONCLUSION
Qualitatively, there was a significant reduction of artifacts in the femoral head, sternum, and spine. There was also a significant qualitative improvement in image quality in these locations. Furthermore, our study indicated that simulated susceptibility artifacts related to metallic implants have a significant effect on small, moderately 18F-FDG–avid lesions near the implant site that may go unnoticed without TOF information. On larger and more 18F-FDG–avid lesions, the metallic implants had only a limited effect. The largest significant quantitative difference was in artifacts of the sternum. There was only a weak inverse correlation between lesions affected by artifacts and distance from the implant.
DISCLOSURE
Patrick Veit-Haibach received investigator-initiated study grants from Bayer Healthcare, Siemens Healthcare, and Roche Pharmaceuticals and speaker fees from GE Healthcare. Gaspar Delso is an employee of GE Healthcare. No other potential conflict of interest relevant to this article was reported.
Footnotes
Published online Jan. 6, 2017.
- © 2017 by the Society of Nuclear Medicine and Molecular Imaging.
REFERENCES
- Received for publication July 8, 2016.
- Accepted for publication November 30, 2016.


Jump to section
Related Articles
Cited By...
- No citing articles found.