


Abstract
Fusion of information from PET and MR imaging can increase the diagnostic value of both modalities. This work sought to improve 18F FDG PET image quality by using MR Dixon fat-constrained images to constrain PET image reconstruction to low-fat regions, with the working hypothesis that fatty tissue metabolism is low in glucose consumption. Methods: A novel constrained PET reconstruction algorithm was implemented via a modification of the system matrix in list-mode time-of-flight ordered-subsets expectation maximization reconstruction, similar to the way time-of-flight weighting is incorporated. To demonstrate its use in PET/MR imaging, we modeled a constraint based on fat/water-separating Dixon MR images that shift activity away from regions of fat tissue during PET image reconstruction. PET and MR imaging scans of a modified National Electrical Manufacturers Association/International Electrotechnical Commission body phantom simulating body fat/water composition and in vivo experiments on 2 oncology patients were performed on a commercial time-of-flight PET/MR imaging system. Results: Fat-constrained PET reconstruction visibly and quantitatively increased resolution and contrast between high-uptake and fatty-tissue regions without significantly affecting the images in nonfat regions. Conclusion: The incorporation of MR tissue information, such as fat, in image reconstruction can improve the quality of PET images. The combination of a variety of potential other MR tissue characteristics with PET represents a further justification for merging MR data with PET data in hybrid systems.
PET/MR is rapidly emerging as a promising new hybrid imaging modality. Among several differentiating features when compared with PET/CT, the combination of PET with MR imaging can potentially benefit from reduced radiation for the patient and predominantly from the wider range of tissue characteristics generated by appropriate MR imaging sequences and their multiparametric combinations (1). MR provides anatomic imaging with better soft-tissue depiction and more dedicated tissue contrast than CT and furthermore offers insight into a variety of aspects of human physiology with the potential to image metabolic processes and physiologic function (2–4), complementing metabolic and molecular information afforded by PET for better assessment of the underlying physiopathology (5). Beyond these diagnostic aspects, in the hybrid setting with PET, MR data are also used to estimate tissue-dependent photon attenuation and scatter to improve the quantitative accuracy of PET images (6–8). The MR-based motion correction of PET reconstruction to improve PET image quality is also supported (9,10).
Spatial resolution and quantification accuracy in PET imaging are limited by the low detector spatial resolution and poor photon counting statistics. Early developments in PET reconstruction techniques have addressed this limitation by modeling the underlying photon generation statistics and taking advantage of the physics of coincidence detection to find an appropriate balance between resolution and noise propagation. Augmentation of standard iterative reconstruction algorithms (11,12) with penalty and regularization terms to enforce desired image characteristics such as regional smoothness (13), or, equivalently, Bayesian motivated reconstruction techniques (14) using appropriate priors, has been proposed for this purpose. The insight that the spatial distribution of a PET tracer is constrained not only by the underlying physiology but also to some extent by anatomy has led to penalization approaches that use the anatomic information gained from CT or MR images, again with the rationale of achieving spatial correlation of continuities and discontinuities between metabolic and anatomic images (15–17). In this work, we incorporated into the PET reconstruction algorithm a soft constraint that down-weighs PET image values in regions of tissue types in which tracer uptake is not expected, in favor of surrounding regions. In PET/MR imaging, this idea can be tested because of the ability of MR imaging, with its high ability to differentiate soft tissue, to identify the location and extent of such tissue types.
As an example of this approach, we used the working hypothesis that 18F FDG PET tracer has limited accumulation in white body fat because of the normally minimal metabolic activity levels of this tissue type. For identification of regions of white fat, we exploited the emergence of the Dixon MR imaging technique, which allows for the separation of the imaged body tissue into 2 basic compartments: water-rich tissue and fat tissue. The constraint was implemented into a list-mode time-of-flight ordered-subsets expectation maximization (OSEM) PET reconstruction algorithm, with the hypothesis of achieving more accurate quantitation of activity distribution and a reduced partial-volume effect. The approach was validated with phantom experiments and tested on PET/MR patient scans.
MATERIALS AND METHODS
To show the basic feasibility of such an MR-augmented PET image reconstruction approach, the MR imaging and PET data must be spatially registered and consistent. A commercial hybrid time-of-flight PET/MR system (Ingenuity TF PET/MR; Philips Healthcare) was used for phantom and in vivo experiments. In vivo experiments were performed according to a standard clinical protocol that includes whole-body Dixon water/fat MR imaging before the PET scan as part of the clinical standard of care at the University Hospitals of Geneva, and the study protocol for image analysis for research purposes at the University Hospitals of Geneva and at Philips was approved by both institutional review boards. All subjects gave written informed consent, according to institutional rules.
Dixon Imaging
The Dixon technique is basically a chemical shift–encoding approach that is based on the species-specific resonant frequency shifts, such as those for water and fat, allowing the simultaneous measurement of both components (18,19). Thus, in gradient echo imaging, the 2 MR signal components, water and fat, evolve differently in time and modulate the MR signal. Recently, dual–gradient echo acquisition techniques (2-point Dixon) have been shown to be sufficient to separate water and fat signal contributions in a robust way with high accuracy (20,21).
To facilitate whole-body coverage and to overcome main magnetic field homogeneity restrictions, 3-dimensional whole-body multistation 2-point multi–gradient echo imaging (mDixon (21)) was performed to separate water and fat fractions.
A high-resolution acquisition was used for phantom experiments, with a repetition time/first echo time/second echo time of 7.9/1.42/2.6 ms, a flip angle of 10°, a field of view (right to left, anterior to posterior, foot to head) of 328 × 320 × 220 mm, a pixel size (right to left, anterior to posterior) of 1.0 × 1.0 mm, a reconstructed pixel size of 0.75 × 0.75 mm, and a slice thickness of 2 mm.
A standard-resolution acquisition was used in vivo, with a repetition time/first echo time/second echo time of 3.3/1.12/2.1 ms, a flip angle of 7°, a field of view (right to left, anterior to posterior, foot to head) of 500 × 391 × 150 mm, a slice thickness of 6 mm, a pixel size (right to left, anterior to posterior) of 1.6 × 1.6 mm, a reconstructed pixel size of 1.6 × 1.6 mm, and a slice thickness of 3 mm. The overlap of successively acquired bed positions was 30 mm.
For signal sampling, a small pixel bandwidth (water/fat shift, 0.21 pixel) was used, and the system body coil was used for patient comfort. Images were reconstructed for the 2 echo datasets first, followed by the water/fat separation (21), on the reconstruction unit of the MR system.
PET-Constrained Reconstruction
The list-mode time-of-flight OSEM PET algorithm implemented on the PET reconstruction platform (22) was modified to incorporate the fat tissue constraint into the system matrix, in a similar way to that in which time-of-flight functionality is incorporated. The list-mode time-of-flight (TOF) OSEM update equation can thus be written as follows: where
where  is the PET image matrix at the k-th iteration and m-th subset in blobs representation (23), si the sensitivity matrix, η various efficiency factors, b the scatter and randoms correction term, and H the time-of-flight system matrix excluding attenuation effects. H is computed on the fly for each line of response. The constraint weight image C (e.g., the Dixon fat MR image) must be spatially aligned with the PET geometry and resampled to a blobs representation, with its gray scale range rescaled to [0,…,max] > [1.0,...,1.0 + c] such that absence of the constraining tissue type from the blob n is represented as the neutral value 1.0 whereas maximum contribution of the tissue type is mapped to
  with a free constraint strength parameter c. Consequently, negative values for c must be used to down-weigh blobs that contain the constraining tissue type. For this work, values of
  and
and  were chosen for comparison of medium and strong influence, respectively. An additional positive strength parameter
  was used solely for visual confirmation of the effect of overweighting fat. The standard reconstruction (
 ) was used for a reference.
Apart from this modification to the algorithm, PET data were reconstructed following the scanner’s standard whole-body list-mode OSEM protocol as described by Wang et al. (23), with 3 iterations on a 75 × 75 blob slice grid and a relaxation parameter  and resampled after reconstruction to a 144 × 144 rectangular slice grid with isotropic 4-mm voxels.
PET/MR Experiments
After the mDixon acquisition, attenuation correction data for the PET reconstruction were acquired with a dedicated whole-body fast field echo T1-weighted MR sequence. Attenuation-corrected images were segmented into water and air compartments, converted to 511-keV attenuation values, and merged with template-based attenuation correction data for the patient table (24). Subsequently, PET data were acquired as detailed below.
Phantom Experiments
Phantom measurements were performed using the National Electrical Manufacturers Association (NEMA) International Electrotechnical Commission (IEC) torso phantom, which contains PET- and MR-visible structures. The 2 largest spheres of the IEC phantom were filled with water, and the other spheres were filled with an activity of 18F equal to 4 times the background signal, following NEMA recommendations for performance testing (25). The bottom half of the main compartment of the phantom was filled with water with background signal, and the phantom was then topped off with vegetable oil to mimic human white fat tissue without activity. The spheres in the top half were therefore well suited to appreciate any effect of the reconstruction constraint, whereas those in the bottom half were suited to verify that the constraint does not affect nonfat regions. The phantom was carefully placed on the patient support so that the sphere centers lay in the same axial plane. A single station of PET data was acquired for 8 min.
In Vivo Experiments
In 2 oncology patients (patients A and B), clinically indicated whole-body mDixon scans were acquired using the above protocol. After image reconstruction, these dual-echo data underwent separation to yield pure water and fat data. Multistation data were fused subsequently using overlap correction to form 2 continuous 3-dimensional datasets for water and fat, respectively.
Patient A was a 43-y-old woman with cT2 N2 invasive ductal carcinoma of the left breast undergoing PET/MR. Imaging for disease staging was performed before neoadjuvant chemotherapy, and PET was acquired 1 h after the injection of 375.4 MBq of 18F-FDG. Patient B was a 15-y-old girl presenting for follow-up of Hodgkin lymphoma and imaged with cervicothoracoabdominal PET/MR 60 min after intravenous injection of 297.4 MBq of 18F-FDG at a fasting blood glucose value of 3.3 mmol/L. Clinical PET/MR data were reviewed and had no suggestive results.
Analysis
NEMA NU2-2007 section 7 guidelines were followed for image quality assessment to evaluate and compare native to constrained reconstruction (25), with adaptation of the guidelines to the difference in phantom setup, that is, the oil-filled top half. Briefly, NEMA image quality assessment comprises the measurement of sphere-contrast recovery, background variability, and the residual count error in the lung insert, performed as an analysis of regions of interest and profile lines (Fig. 1), which we implemented in MATLAB R2012a (The MathWorks Inc.). For hot-sphere inserts 1, 2, and 3 in the phantom top half, contrast recovery analysis was replaced by signal-to-noise analysis because of the zero-activity background of the oil. For visual clarity but not for analysis, all transaxial slice images were scaled to 1,000 × 1,000 pixels with bicubic interpolation.

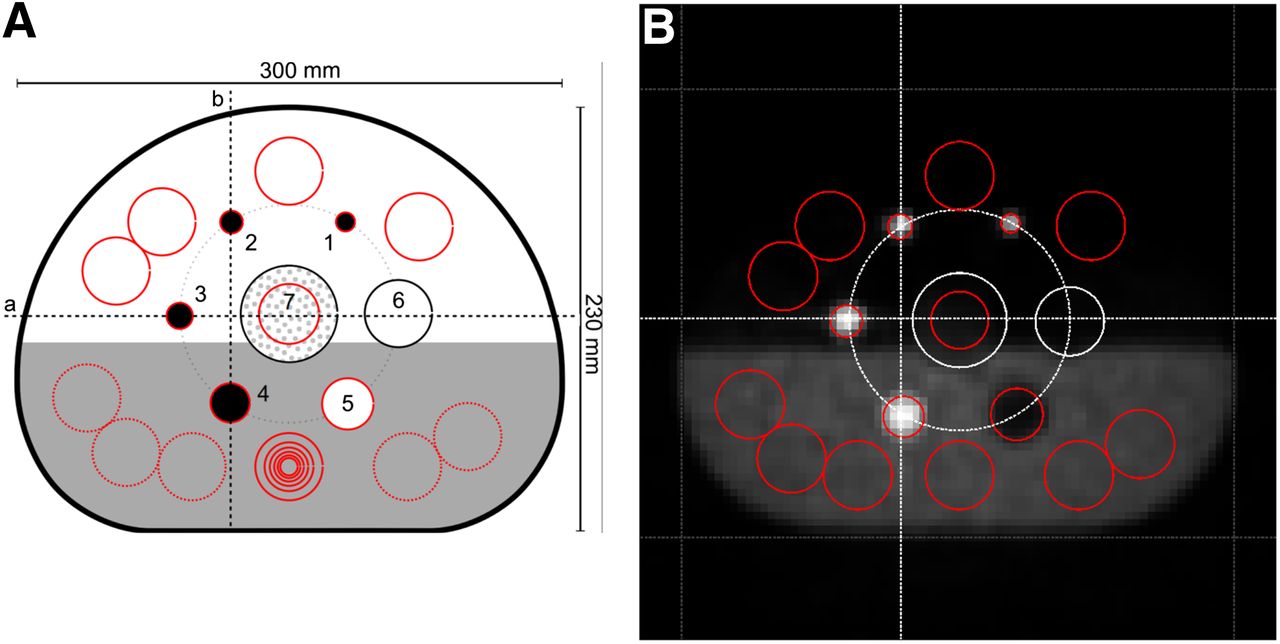
Position of circular regions of interest (ROIs) according to NEMA NU2-2007 section 7 guidelines for evaluation of image quality in IEC/NEMA phantom filled with water with background activity (bottom half) and corn oil (top half), shown schematically (A) and overlaid on mid-axial slice of native PET reconstruction (B). One ROI each was placed on sphere inserts 1–5, so that ROI diameter was as close as possible to internal diameter of insert. Six sets of concentric ROIs (10, 13, 17, 22, 28, 30 and 37 mm; all sizes shown only for middle ROI) were placed on warm phantom background (bottom half). Circular 30-mm ROI was placed on lung insert (7). Four circular 32-mm ROIs were placed on cold phantom background (top half). All background ROIs were automatically replicated to 2 transaxial slices on both sides of spheres, 12 mm (equivalent to 3 voxels) and 24 mm (6 voxels) away from sphere centers, respectively. Background ROIs in lower phantom half were used to assess NU2-2007 image quality, and background ROIs in phantom upper half were used for signal-to-noise ratio measurements. ROI on lung insert was automatically replicated to 10 transaxial slices on both sides of spheres. Finally, vertical and horizontal profile lines (a, b) were placed through centers of sphere inserts 2, 3, 4, 6, and cylindric lung insert, 7.
RESULTS
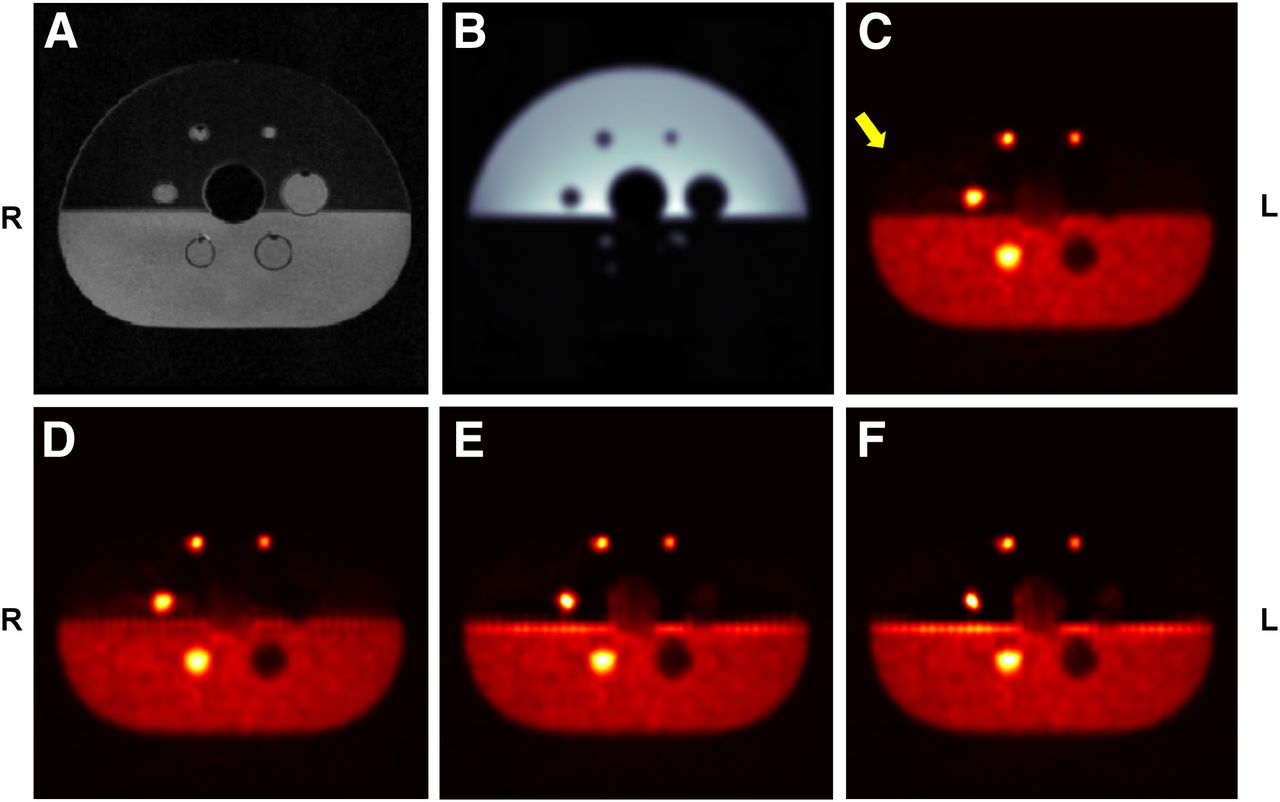
Figure 2 shows the central cross-sections of the IEC phantom scans. In the Dixon water image and the constraint image derived from the Dixon fat image, the separation between the bottom half of the main compartment filled with radioactive water and the top half filled with oil can clearly be appreciated. Visual comparison of the constrained reconstructions to the reference native PET reconstruction (Fig. 2C) confirmed the expected enhancement of uptake in the oil (Fig. 2D, control reverse-constrained reconstruction, weight  ) and suppression (Figs. 1E and 1F, weight
  and
and  , respectively). At the same time, also as expected, constraint had no impact on the inserts of the water-filled bottom half of the phantom. The apparent weak uptake in the center lung insert is an artifact from the MR-based attenuation correction algorithm, which is optimized for patient data.

Transaxial slices of IEC NEMA phantom at level of largest sphere insert diameters: MR T1-weightted gradient-echo water image (A), corresponding MR Dixon separated fat image (B), native PET reconstruction (C), constrained PET reconstruction with weight c = +0.1 (D), constrained PET reconstruction with weight c = −0.3 (E), and constrained PET reconstruction with weight c = −0.5 (F). Yellow arrow indicates suppression of uptake in oil.
The visible edge enhancement artifact at the water/fat interface in the constraint images is an effect of the constraint and deserves further consideration. It is discussed below. The results of the NEMA image quality analysis (Fig. 3) demonstrated the desired effect of the constraint: signal-to-noise ratio for the regions of interest in the oil-filled top half increased, and contrast recovery was not significantly changed in the water-filled bottom half. Background variability was only slightly increased (≤0.3% for the largest diameter). Residual count error was indeed strongly increased by constrained reconstruction because the algorithm pushes the activity out of the fat into nearby regions marked as fat-free in the constraint image. Emission density plots along the profile lines in Figure 4 quantify the desired effect of reduced spill of emission into the surrounding fat and the concomitant signal increase for in-oil hot-sphere insert 3. The vertical profile through inserts 2 and 4 also shows the erroneous uptake overshoot at the oil/water interface for some of the constrained reconstructions.
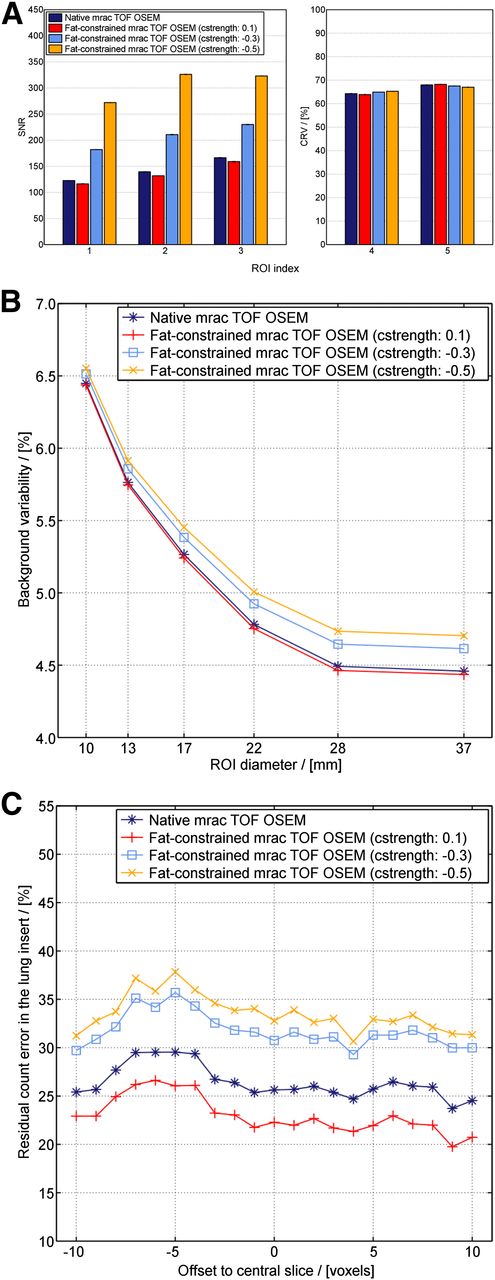
Results of phantom image quality analysis according to NEMA NU2-2007 section 7 guidelines. (A) Signal-to-noise ratio for sphere inserts 1, 2, and 3 in oil-filled top half (Fig. 1) increased from native reconstruction with constraint effect strength and was reduced for control reverse-constrained reconstruction. Contrast recovery in sphere inserts in water-filled bottom half was not significantly changed by constrained reconstruction. (B) With increasing constraint strength, background variability increased slightly over native reconstruction (black line) but otherwise exhibited consistent dependency on region-of-interest size. (C) Residual count error in phantom lung insert as percentage of average background count density was elevated with increasing constraint strength, as constraint algorithm moved reconstructed emission density from oil-filled region to nearby nonfat regions. cstrength = constraint strength; mrac = model reference adaptive control; ROI = region of interest; SNR = signal-to-noise ratio; TOF = time of flight.

Emission density profile through IEC NEMA phantom (Fig. 1). (A) Horizontal line A: peak in emission density corresponds to region of interest 3 and shows increased signal strength dependent on constraint strength as algorithm moves emission density to this nonfat region. (B) Vertical line B: Only small effects at region-of-interest peaks can be seen as result of weak or zero constraint strength (dotted line). At 30 mm, overshoot peak at water–oil interface can be appreciated. cstrength = constraint strength; mrac = model reference adaptive control; TOF = time of flight.
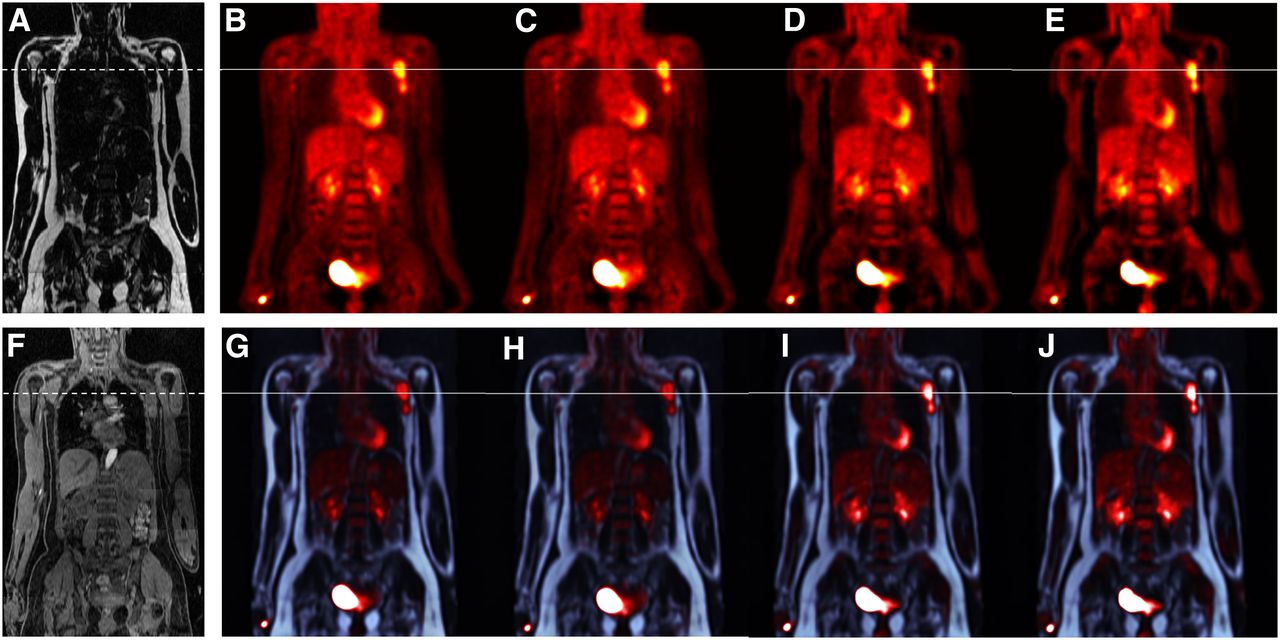
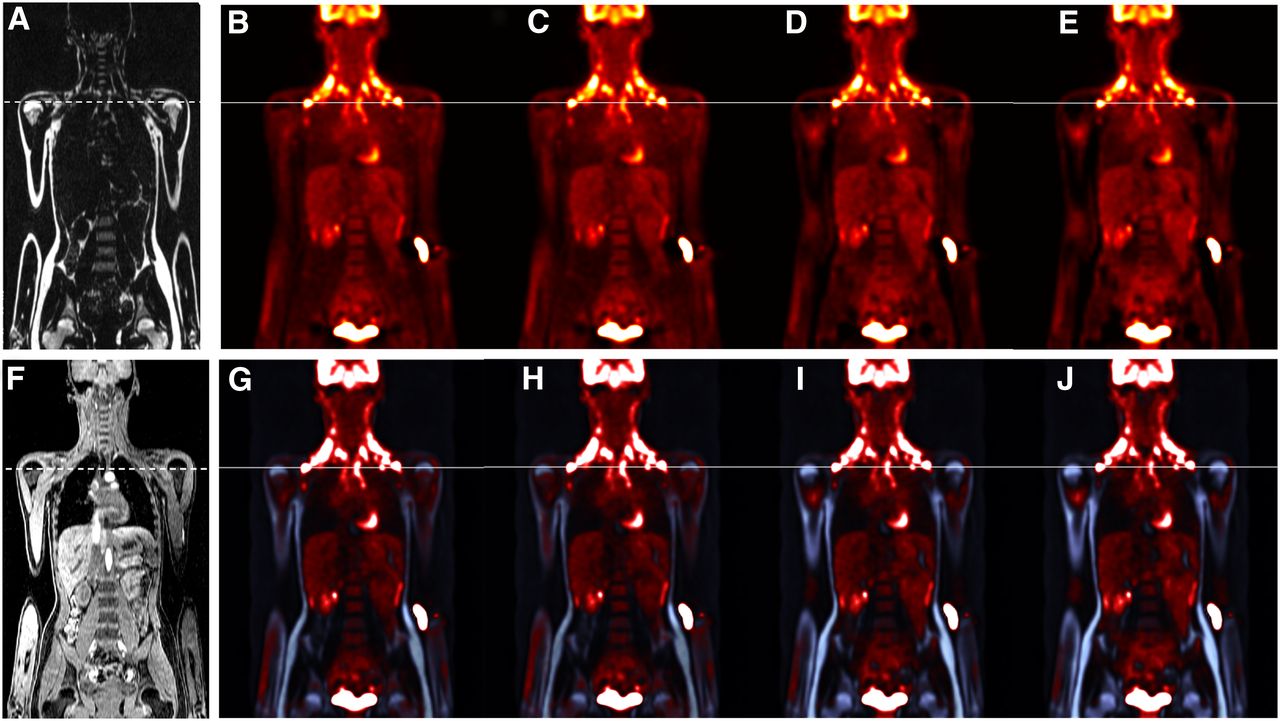
Patient A findings on the native reconstruction of whole-body PET/MR were multifocal/multicentric, enhanced/hypermetabolic tumoral extent of the left breast with massive lymph node involvement of the ipsilateral axilla, without a contralateral breast lesion or distant metastatic extent. Constrained reconstruction resulted in lower uptake in the subcutaneous fat regions at hip level and more focal axillary lymph node involvement than in the native reconstruction (Figs. 5 and 6A).

Coronal view of patient A with breast tumor and axillary lymph node involvement. (A) MR Dixon fat image. (B, C, D, and E) Respectively, native, reverse-constraint (c = 0.1), medium-constrained (c = −0.3), and strongly constrained (c = −0.5) PET reconstructions demonstrating decreasing uptake in subcutaneous fat regions at hip level. (F) MR Dixon water image. (G, H, I, and J) Respectively, native, reverse-constraint (c = 0.1), medium-constrained (c = −0.3), and strongly constrained (c = −0.5) PET reconstructions laid over MR Dixon fat-based constraint image, demonstrating more focal axillary lymph node involvement. Horizontal lines indicate position of intensity profile line shown in Figure 7A.

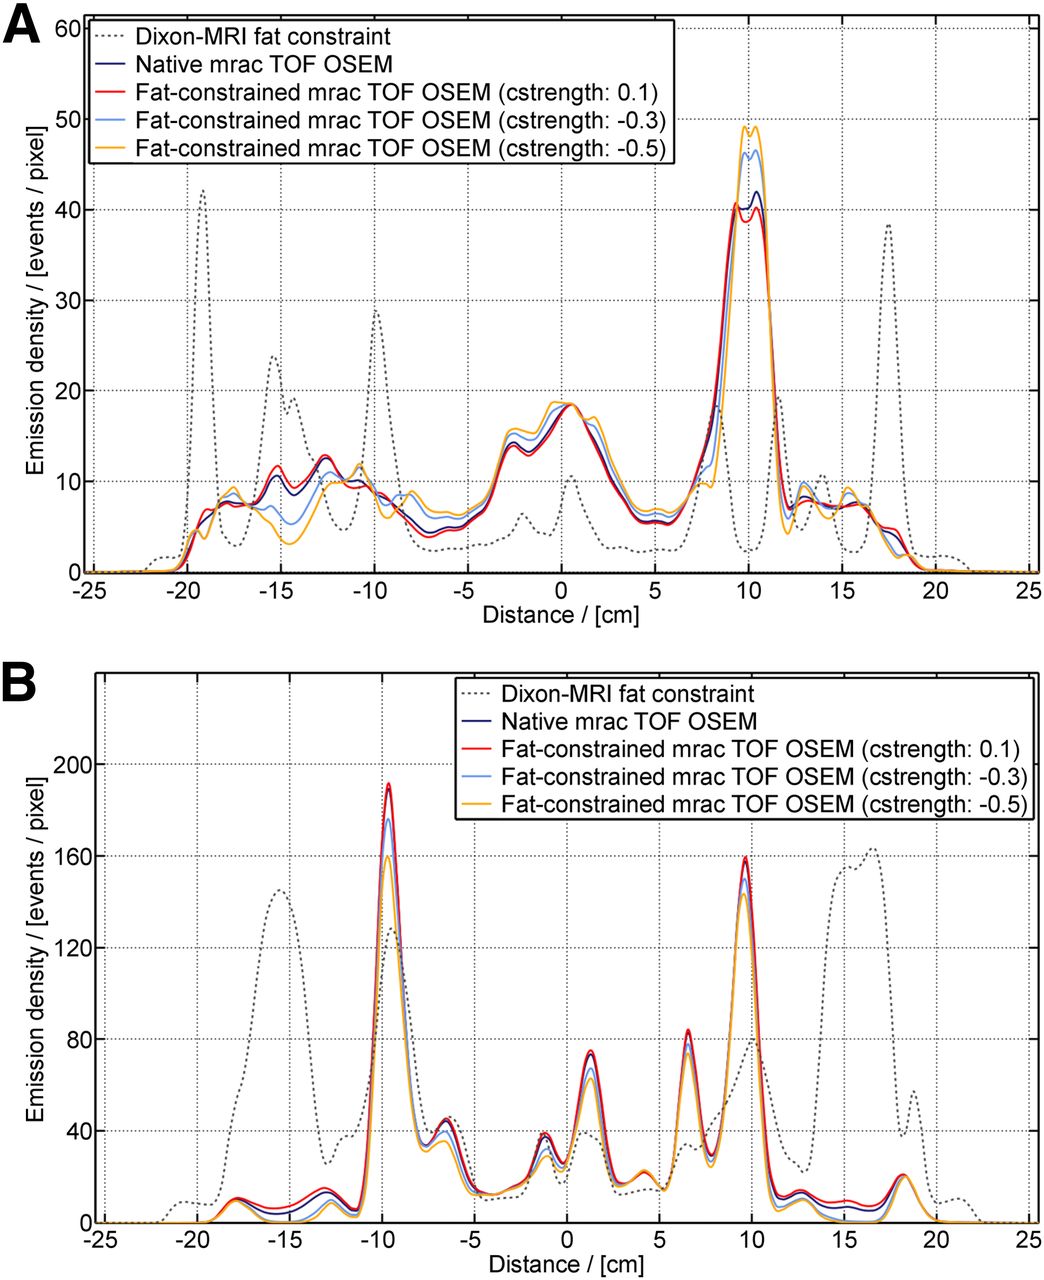
Emission density profile through coronal slices of patient data. (A) In patient A, at level of involved axillary lymph nodes (Fig. 5), peak corresponds to lymph node, demonstrating how constraint algorithm moves emission density from fat-rich neighborhood to lymph node, resulting in more focused PET signal. (B) Patient B, at level of brown fat at neck and shoulder (Fig. 7), demonstrates little effect of constrained algorithm. In peaks at −10 and 10 mm, higher fat content (dotted line) causes PET signal to be moved away by algorithm.
Patient B reconstructions demonstrated that uptake in the brown-fat neck regions of the otherwise very lean patient was not reduced by the constraint algorithm, since brown fat, contrary to white fat, at least in our dataset, did not exhibit a strong signature in the Dixon fat image (Figs. 6B and 7).

Coronal view of patient B with thermogenic brown fat in neck and shoulder region. (A) MR Dixon fat image. (B, C, D, and E) Respectively, native, reverse-constraint (c = 0.1), medium-constrained (c = −0.3), and strongly constrained (c = −0.5) PET reconstructions. (F) MR Dixon water image. (G, H, I, and J) Respectively, native, reverse-constraint (c = 0.1), medium-constrained (c = −0.3), and strongly constrained (c = −0.5) PET reconstructions laid over MR Dixon fat-based constraint image. Horizontal lines indicate position of intensity profile line shown in Figure 6B. Uptake at elbow is residual from intravenous tracer administration. cstrength = constraint strength; mrac = model reference adaptive control; TOF = time of flight.
DISCUSSION
An MR-based fat-constrained PET reconstruction algorithm was implemented, and its basic feasibility was validated in phantom and in vivo experiments. This algorithm seeks to reduce spurious signal in fatty tissue, guided by the hypothesis that biologically, tracer uptake in fat tissue is minimal. In the phantom experiment, uptake in the fat regions close to the PET hot spots was indeed significantly reduced; at the same time, uptake in the hot spots was corrected upward, resulting in a net contrast gain. Equally important, the contrast in nonfat regions was not significantly affected. Both effects were also appreciable in the patient data. The artificial edge enhancement at the oil/water interface in the phantom is an effect of the constraint but also of the straightness and extent of the boundary, which is not the case in patients. The overshoot behavior has to be further studied and might also be used in future refinements of the algorithm to guide the optimal choice of the strength parameter c or to derive appropriate regularization that avoids this behavior.
This initial implementation of a constraint algorithm followed the method applied for time-of-flight reconstruction by modifying the system matrix such that voxel contributions to each line of coincidence were down-weighted on the basis of the signal of the MR fat image at the corresponding location. However, it is important to note that the fat signal intensity measured on MR does not necessarily correspond to the fat concentration in this voxel. Depending on the MR sequence parameters and potential effects of the instrumentation, nonlinearity effects can be expected (26). MR image–based partial-volume reduction algorithms such as those reviewed by Meltzer et al. for the brain require image segmentation and are thus susceptible to segmentation error (27). Our approach of using the mDixon imaging technique with its inherent segmentation into watery and fatty compartments obviates additional image processing and may therefore be preferable. One standard approach to incorporate prior anatomic information into the reconstruction algorithm is technically motivated by the Bayesian framework, in which maximization of the logarithm of the posterior probability directly reveals the prior—here, the lower probability of tracer accumulation in fat tissue—as an additive penalty term (15,16,28). Typically, these schemes seek to establish contiguous regions of uniform uptake in the PET image that correspond to edge-separated regions in the MR or CT image, for instance, minimum cross-entropy reconstruction. This is different from the method proposed here.
To our knowledge, this is the first report on using the fat component measured by MR imaging to directly influence PET reconstruction. The idea of using MR-based information for anatomy-guided PET image reconstruction is not new: Bai et al. reviewed and compared several approaches and applied them to MR guidance (29). The use of Dixon imaging for attenuation correction in PET reconstruction in PET/MR imaging has also been described earlier and can be considered to be a reconstruction constraint in a wide sense (30). What is different in our work is the specific use of the fat component to down-weigh PET reconstruction, and the direct implementation in image reconstruction following the example of time-of-flight weighting. Compared with the more computation-intensive method of maximum a posteriori reconstruction, our approach added only minimally (<2%) to reconstruction time.
The strength of the algorithmic effect is guided by a weighting parameter. If this algorithm is to be used to actually improve the perception of active lesions outside the fat tissue, it can improve the diagnostic performance of PET images. This could offer an advantage to optimize image quality. Potential standardization should be the subject of further validation.
A second strength of our approach is that the direct separation of water and fatty tissue regions in Dixon MR imaging lends itself well to forming a basis for an anatomic prior in PET image reconstruction—from a physiologic point of view, since 18F-FDG tracer uptake is known to be minimal because of limited glucose metabolism activity there, and from a technical point of view, since it elegantly solves the otherwise hard problem of MR image segmentation.
A further opportunity for the presented algorithm may lie in PET imaging of tumor surrounded by fatty tissue. For example, perilesional fat sparing in hepatic hemangioma in fatty liver was reported as a means to detect and delineate tumors, especially in the abdominal cavity (31). Consequently, if any holes in otherwise homogeneous fat areas are indeed occupied by tumor tissue as suspected (31), the fat-constraint PET reconstruction algorithm presented here will boost and sharpen the PET contrast at such locations.
Brown adipose tissue is a separate type of fat found in mammals that is used by the body for thermogenesis (32). In comparison to white adipose tissue, brown adipose tissue contains a high number of mitochondria and capillaries (33) as well as glucose transporters (34). For this reason, brown fat accumulates 18F-FDG (35). It has been reported that about 1.8% of the scanned patient population presents metabolically active areas of brown fat on PET, which can lead to potentially false-positive interpretations of the images (36). Fusion with CT and interpretation of the PET images using the underlying anatomy and knowledge of this potential pitfall is helpful to avoid misinterpretation of brown fat as malignancy (36). MR and the above-presented constrained PET reconstruction may provide a further advantage when trying to avoid a wrong diagnosis. Brown fat can potentially be seen on the Dixon fat images, if measured using tailored MR sequences, although brown fat exhibits a lower fat fraction and a stronger T2* weighting in the images than white fat (37). Here, MR imaging and PET can show additional synergy because metabolically active brown fat could therefore potentially be identified as such when a fusion with the PET image is performed. The Dixon fat-constrained PET reconstruction implemented here may also indirectly aid in the discrimination of brown fat from white fat, because the PET signal in a brown-fat region would remain almost undiminished whereas a white-fat region would result in a strongly diminished PET signal by way of a strong constraint. This would further increase the visual difference between PET images in brown fat regions and white fat regions. Future studies with data that were not available here will be needed to support this hypothesis.
Further work will also be needed to fully validate this approach, which can potentially be extended by incorporating other MR-based priors, such as the anatomy reflected in the water image, or other MR contrasts sensitive to abnormal tissue, such as diffusion-weighted imaging.
CONCLUSION
The use of the fat compartment information delivered by Dixon MR in a hybrid PET/MR system to constrain time-of-flight list-mode reconstruction of PET/MR resulted in reduced PET image intensity in areas of fatty tissue and image enhancement of adjacent high-uptake regions. This may increase PET contrast and spatial resolution and thus be of potential diagnostic value in PET imaging. The technique explored in this early report on the use of MR information to guide PET reconstruction may prove generally useful in PET/MR imaging and can benefit further from other contrasts deliverable by MR.
DISCLOSURE
The costs of publication of this article were defrayed in part by the payment of page charges. Therefore, and solely to indicate this fact, this article is hereby marked “advertisement” in accordance with 18 USC section 1734. Sven Prevrhal, Steffen Renisch, and Peter Börnert are employees of Philips Research Germany. Susanne Heinzer is an employee of Philips AG Healthcare Switzerland. Christian Wülker is an intern at Philips Research Germany. No other potential conflict of interest relevant to this article was reported.
Acknowledgments
We thank Bénédicte Delattre, PhD, and Diego Camacho for help with carrying out the phantom experiments. Dr. Delattre and Mr. Camacho are salaried employees of Philips AG Healthcare, Zurich, Switzerland.
Footnotes
Published online Aug. 28, 2014.
- © 2014 by the Society of Nuclear Medicine and Molecular Imaging, Inc.
REFERENCES
- Received for publication March 7, 2014.
- Accepted for publication July 17, 2014.


Jump to section
Related Articles
Cited By...
- No citing articles found.