


Abstract
The objective of the present study was to evaluate whether integrated 18F-FDG PET/MR imaging could improve the diagnostic workup in patients with cardiac masses. Methods: Twenty patients were prospectively assessed using integrated cardiac 18F-FDG PET/MR imaging: 16 patients with cardiac masses of unknown identity and 4 patients with cardiac sarcoma after surgical therapy. All scans were obtained on an integrated 3-T PET/MR device. The MR protocol consisted of half Fourier acquisition single-shot turbo spin-echo sequence, cine, and T2-weighted images as well as T1-weighted images before and after injection of gadobutrol. PET data were acquired simultaneously with the MR scan after injection of 199 ± 58 MBq of 18F-FDG. Patients were prepared with a high-fat, low-carbohydrate diet in a period of 24 h before the examination, and 50 IU/kg of unfractionated heparin were administered intravenously 15 min before 18F-FDG injection. Results: Cardiac masses were diagnosed as follows: metastases, 3; direct tumor infiltration via pulmonary vein, 1; local relapse of primary sarcoma after surgery, 2; Burkitt lymphoma, 1; scar/patch tissue after surgery of primary sarcoma, 2; myxoma, 4; fibroelastoma, 1; caseous calcification of mitral annulus, 3; and thrombus, 3. The maximum standardized uptake value (SUVmax) in malignant lesions was significantly higher than in nonmalignant cases (13.2 ± 6.2 vs. 2.3 ± 1.2, P = 0.0004). When a threshold of 5.2 or greater was used, SUVmax was found to yield 100% sensitivity and 92% specificity for the differentiation between malignant and nonmalignant cases. T2-weighted hyperintensity and contrast enhancement both yielded 100% sensitivity but a weak specificity of 54% and 46%, respectively. Morphologic tumor features as assessed by cine MR imaging yielded 86% sensitivity and 92% specificity. Consent interpretation using all available MR features yielded 100% sensitivity and 92% specificity. A Boolean ‘AND’ combination of an SUVmax of 5.2 or greater with consent MR image interpretation improved sensitivity and specificity to 100%. Conclusion: In selected patients, 18F-FDG PET/MR imaging can improve the noninvasive diagnosis and follow-up of cardiac masses.
Cardiac tumors are rare. Primary cardiac tumors have been found in autopsy at an incidence of about 0.02% (1). About 75% of primary tumors are benign and 25% malignant (1). In contrast, secondary cardiac tumors (e.g., metastases) are found in more than 10% of tumor patients at autopsy. The most frequent primary cardiac tumors are atrial myxoma in adults and rhabdomyosarcoma in children (1,2). However, cardiac thrombus is the most frequent intracavitary mass. In some instances, cardiac thrombus can be challenging to differentiate from a cardiac neoplasm using conventional echocardiographic assessment methods (3).
Because of resulting functional cardiac disorders, the treatment of choice in most tumor cases is complete resection. Furthermore, in malignant tumors surgery will be combined with chemo- or radiotherapy. The assessment of tumor malignancy and tumor expansion and their relation to critical structures such as valves or papillary muscles by imaging is often critical for preoperative planning. Also, the posttreatment identification of local relapse by imaging is an important element of the overall treatment strategy.
Cross-sectional imaging such as CT, MR imaging, or echocardiography in many cases provides excellent depiction of tumor morphology, which may allow for the assessment of malignancy or may even predict histologic diagnosis (4–8). Cardiac MR imaging has been shown to be particularly helpful in the diagnostic workup of cardiac tumors (4,9). More recently, 18F-FDG PET/CT has been shown to provide incremental diagnostic information in the determination of malignancy and staging of cardiac tumors (10).
Integrated 18F-FDG PET/MR imaging provides a combination of superior morphologic tumor characterization and visualization of tumor metabolism (11–14) and, thus, might hold great potential in the diagnosis and follow-up of cardiac tumors.
In this pilot study, we sought to evaluate whether integrated 18F-FDG PET/MR imaging provided significant benefit over 18F-FDG PET or MR imaging alone.
MATERIALS AND METHODS
Patients
Twenty patients were prospectively enrolled in this study: 16 patients had cardiac masses of unknown identity (n = 12 found by echocardiography; n = 4 found by CT), and 4 patients presented with cardiac sarcoma after surgical therapy.
Patient entry criteria included the following: age 18 y or older, cardiac mass of unknown identity or indication for follow-up imaging after resection of cardiac malignancy, and no contraindications against the application of gadolinium-based contrast agents or general MR imaging contraindications. Two patients were excluded from the analysis: one patient with echocardiographically detected intracavitary mass in the right atrium was excluded because of incomplete PET/MR examination caused by claustrophobia, and the other patient with angiographically seen focal contrast enhancement of the septal wall was excluded because the suspected tumor was not found in PET/MR imaging and thus was considered an artifact.
All patients underwent simultaneous cardiac PET/MR imaging and were prepared with a customized study information sheet and informed consent discussion. The present study was approved by the local institutional review board. All patients gave written informed consent before their examination.
Scanner
All scans were obtained on an integrated whole-body PET/MR imaging system with a 3-T field strength (Biograph mMR; Siemens Healthcare) coupled to lutetium oxyorthosilicate avalanche photodiodes for PET acquisition (15).
PET Protocol
To suppress physiologic glucose uptake in the myocardium, the patients were prepared with a high-fat, low-carbohydrate diet in a period of 24 h before the examination, and 50 IU/kg of unfractionated heparin were intravenously administered 15 min before the 18F-FDG injection. Blood glucose levels at the time of tracer injection were less than 120 mg/dL.
An activity of 199 ± 58 MBq of 18F-FDG was administered intravenously. The PET/MR scan started 94 ± 35 min after injection of 18F-FDG and comprised a cardiac PET scan with 1 bed position (61 ± 7 min) and 3-dimensional image reconstruction (voxel size, 2 × 2 × 2 mm) using ordinary Poisson ordered-subset expectation maximization with 3 iterations and 21 subsets, a gaussian filter with 5.0 mm in full width at half maximum, and a 344 × 344 image matrix. For automatic attenuation correction of the acquired PET data, a 4-compartment-model attenuation map was calculated from fat-only and water-only Dixon-based sequences by segmentation into background, lung, fat, and soft tissue (16).
MR Imaging Protocol
All examinations were performed including the following sequences. First, an axial 2-dimensional (2D) half Fourier acquisition single-shot turbo spin-echo sequence (HASTE) was performed (repetition time [TR], 510–938 ms; echo time [TE], 51 ms; slice thickness, 8 mm; matrix size, 256 × 105; and in-plane resolution, 1.0 × 2.3 to 1.0 × 2.5 mm [depending on patient body habitus]). Second, balanced steady-state free precession sequences (cine) (TR, 3.44 ms; TE, 1.51 ms; slice thickness, 8 mm; matrix size, 216 × 256; and in-plane resolution, 0.9 × 1.7 to 0.9 × 2.0 mm [depending on patient body habitus]) were performed. These were followed by 2D turbo spin-echo T1-weighted (T1w) sequences (TR, 1 R-R interval; TE, 27 ms; echo train length, 9; flip angle, 180°; slice thickness, 5 mm; matrix size, 256 × 208; and in-plane resolution, 0.8 × 2.1 to 1.1 × 1.6 mm [depending on patient body habitus]). Fourth, 2D turbo-inversion recovery-magnitude T2-weighted sequences with short inversion time were performed (T2w) (inversion time, 180 ms; TR, 2 R-R intervals; TE, 44 ms; echo train length, 20; flip angle, 180°; slice thickness, 8 mm; matrix size, 256 × 130; and in-plane resolution, 1.0 × 1.7 to 0.9 × 1.9 mm [depending on patient body habitus]). Finally, 2D turbo spin-echo T1w postcontrast sequences with spectral fat saturation were performed (pcT1w) (TR, 1 R-R interval; TE, 27 ms; echo train length, 9; flip angle, 180°; slice thickness, 5 mm; matrix size, 208 × 256; and in-plane resolution, 0.5 × 1.1 to 1.1 × 1.6 mm [depending on patient body habitus]).
All sequences were electrocardiogram-triggered and acquired in breath-hold. The mean heart rate was 75 (47–102) beats per minute, corresponding to a mean R-R interval of 840 (587–1,289) ms. HASTE images were acquired in axial slices covering the whole thorax. Cine images were acquired in 4-, 3-, and 2-chamber views and in contiguous short-axis views covering the entire heart. T1w, T2w, and pcT1w images were acquired in 2 orthogonal slices both transecting the tumor. Before the acquisition of pcT1w images, gadobutrol (Gadovist; Bayer Healthcare) was administered as a contrast agent at a weight-adapted dosage of 0.1 mmol/kg of body weight. Patients were scanned supine with their arms at their sides (arm-down position).
Image Analysis
Tumor characteristics were analyzed by 2 interpreters in consensus (both board-certified radiologists with >10 y of experience in cardiac MR imaging and oncologic PET). Volumetric assessment of tumor size was performed manually in HASTE images using OsiriX imaging software (OsiriX Foundation). The signal intensity of the tumors in T1w and T2w images as well as contrast enhancement in pcT1w images was visually classified with reference to the normal myocardium. Pericardial effusion was assessed in cine steady-state free precession (SSFP) images.
Morphologic tumor characteristics were assessed using cine SSFP images. Findings were classified according to characteristic features as being rather malignant or rather benign. Malignant classification comprised close attachment to adjacent tissue or infiltration, extracardiac extension, irregular tumor margin, and inhomogeneity in signal intensity. Benign classification comprised intracavitary location, blood flow–dependent mobility, rounded shape, and homogeneous signal intensity. If characteristic features for malignancy and benignancy were present within 1 lesion, features were weighted based on their explicitness by both interpreters in consensus.
Mean standardized uptake values (SUVs) of the blood pool were measured using 3-dimensional volumes of interest placed in the left ventricular cavity, not including any papillary muscles. Maximum SUVs (SUVmax) were measured using volumes of interest fully encompassing the tumors.
Statistical Analysis
Variables were given as arithmetic mean ± SD unless otherwise specified. Group comparisons were performed using Wilcoxon and χ2 tests as appropriate. Correlation analyses were performed using the Spearman rank correlation coefficient. Classification analysis was performed using receiver-operating characteristics. Significance was inferred at a level of P less than 0.05. All statistical calculations were performed using the R-software environment for statistical computing (R Foundation for Statistical Computing).
RESULTS
Cardiac masses were diagnosed as follows (Table 1): metastases, 3 (Fig. 1); direct infiltration via pulmonary vein, 1; local relapse of primary sarcoma after surgery, 2 (Fig. 2); Burkitt lymphoma, 1; scar/patch tissue after surgery of primary sarcoma, 2; myxoma, 4 (Fig. 3); fibroelastoma, 1; caseous calcification of mitral annulus (CCMA), 3 (Fig. 4); and thrombus, 3 (Fig. 1). Diagnosis was histologically proven in 15 patients. In 3 patients with caseous calcification of mitral annulus, no biopsy was acquired because typical location and calcifications (found in additional CT scans) were considered sufficient for diagnosis, and surgery was not indicated. In 2 patients with scar/patch tissue after surgery, diagnosis was confirmed via follow-up MR scans.
Patient Characteristics
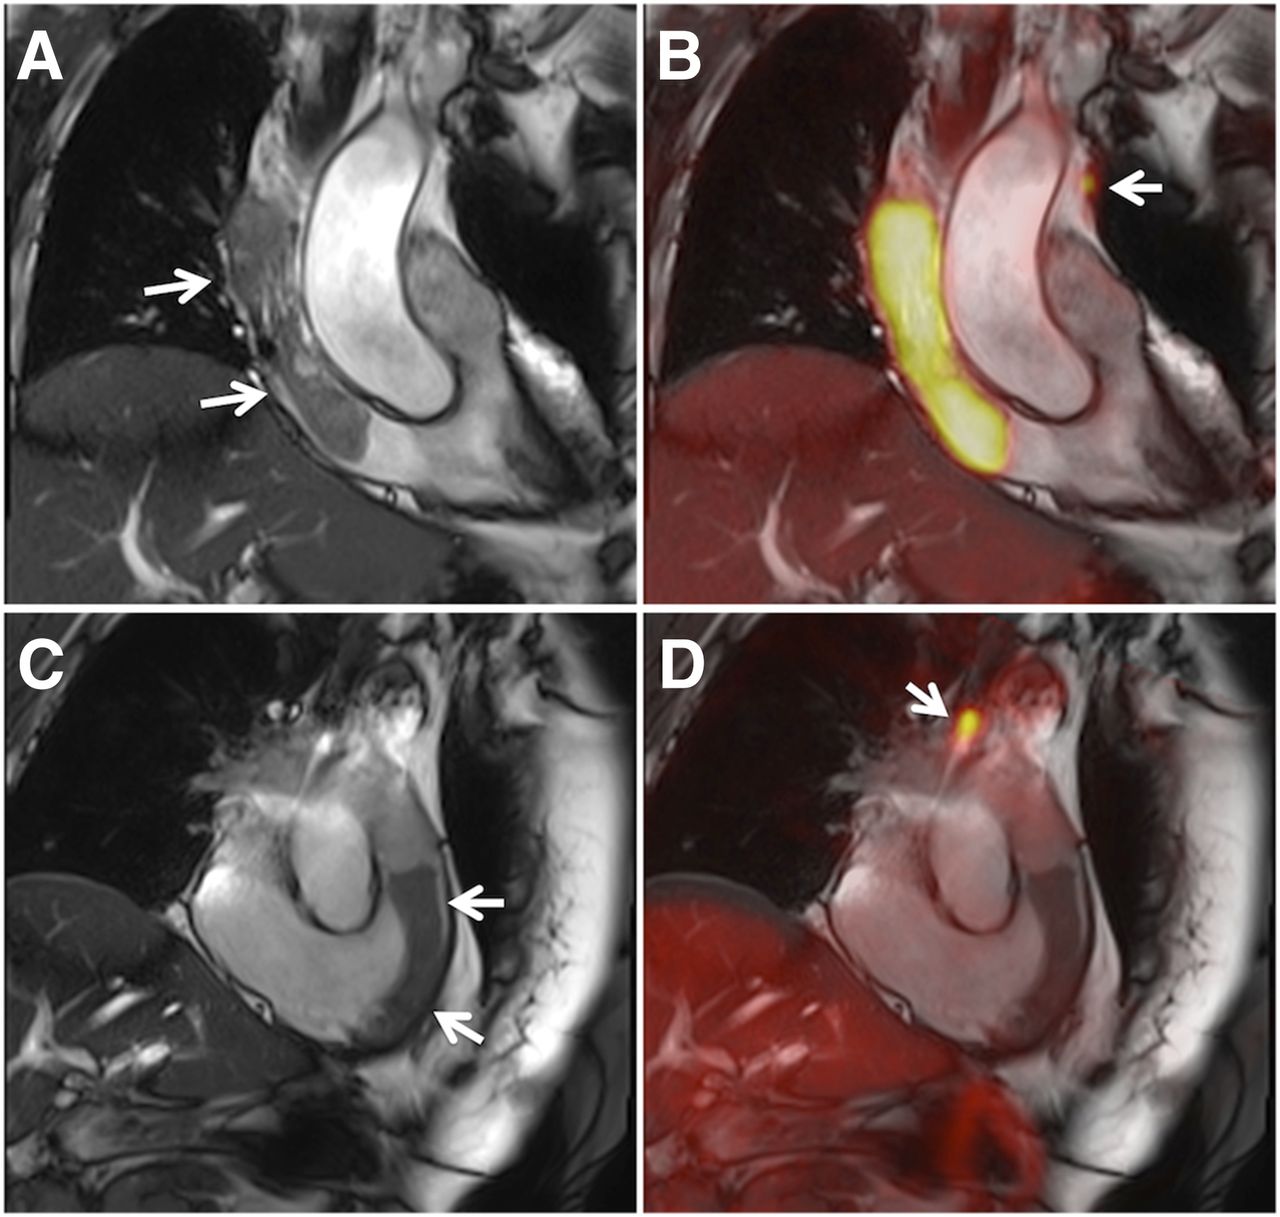
(A and B) Images of patient with history of breast cancer (Table 1, patient 1). (C and D) Images of patient with anal cancer (Table 1, patient 18). In both patients, large intracavitary masses were initially found in echocardiography. Arrows in A and C show SSFP images of large tubular masses in superior vena cava and right atrium (A) and in right ventricular outflow tract (C). B and D show fusion images of SSFP and PET clearly demonstrating malignancy in patient with breast cancer (B) and benign mass in patient with anal cancer (D). However, closer inspection of PET images revealed mediastinal lymph node metastases in both patients (B and D; arrows).

SSFP image (A) of patient with local relapse of cardiac Ewing sarcoma (Table 1, patient 5) showing massive pericardial infiltration with intense 18F-FDG uptake (fusion B; SUVmax, 14.6). T2w images demonstrated hyperintensity of tumor masses (C), and postcontrast T1w images showed significant contrast enhancement (D).
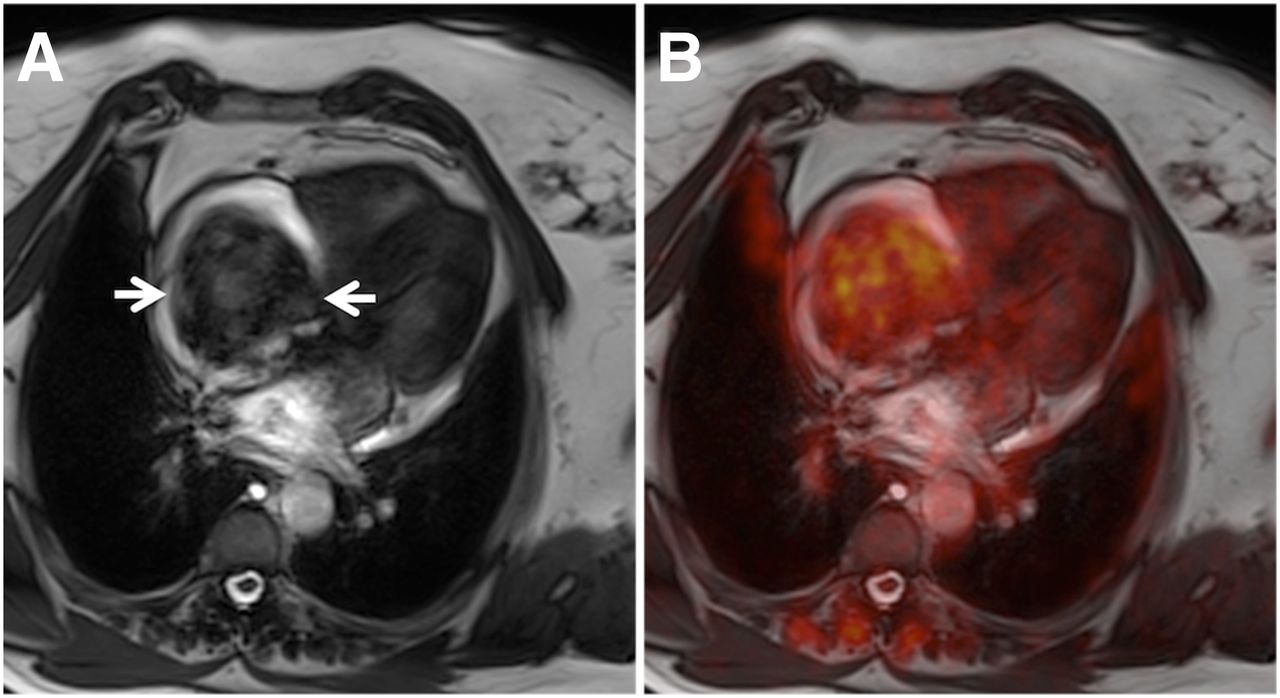
(A) SSFP image of large intracavitary tumor in right atrium (arrows) causing dyspnea and thoracic pain (Table 1, patient 13). PET images (fusion B) demonstrated mediocre 18F-FDG uptake in tumor (SUVmax, 3.8). Imaging diagnosis of myxoma was later confirmed by histopathology.

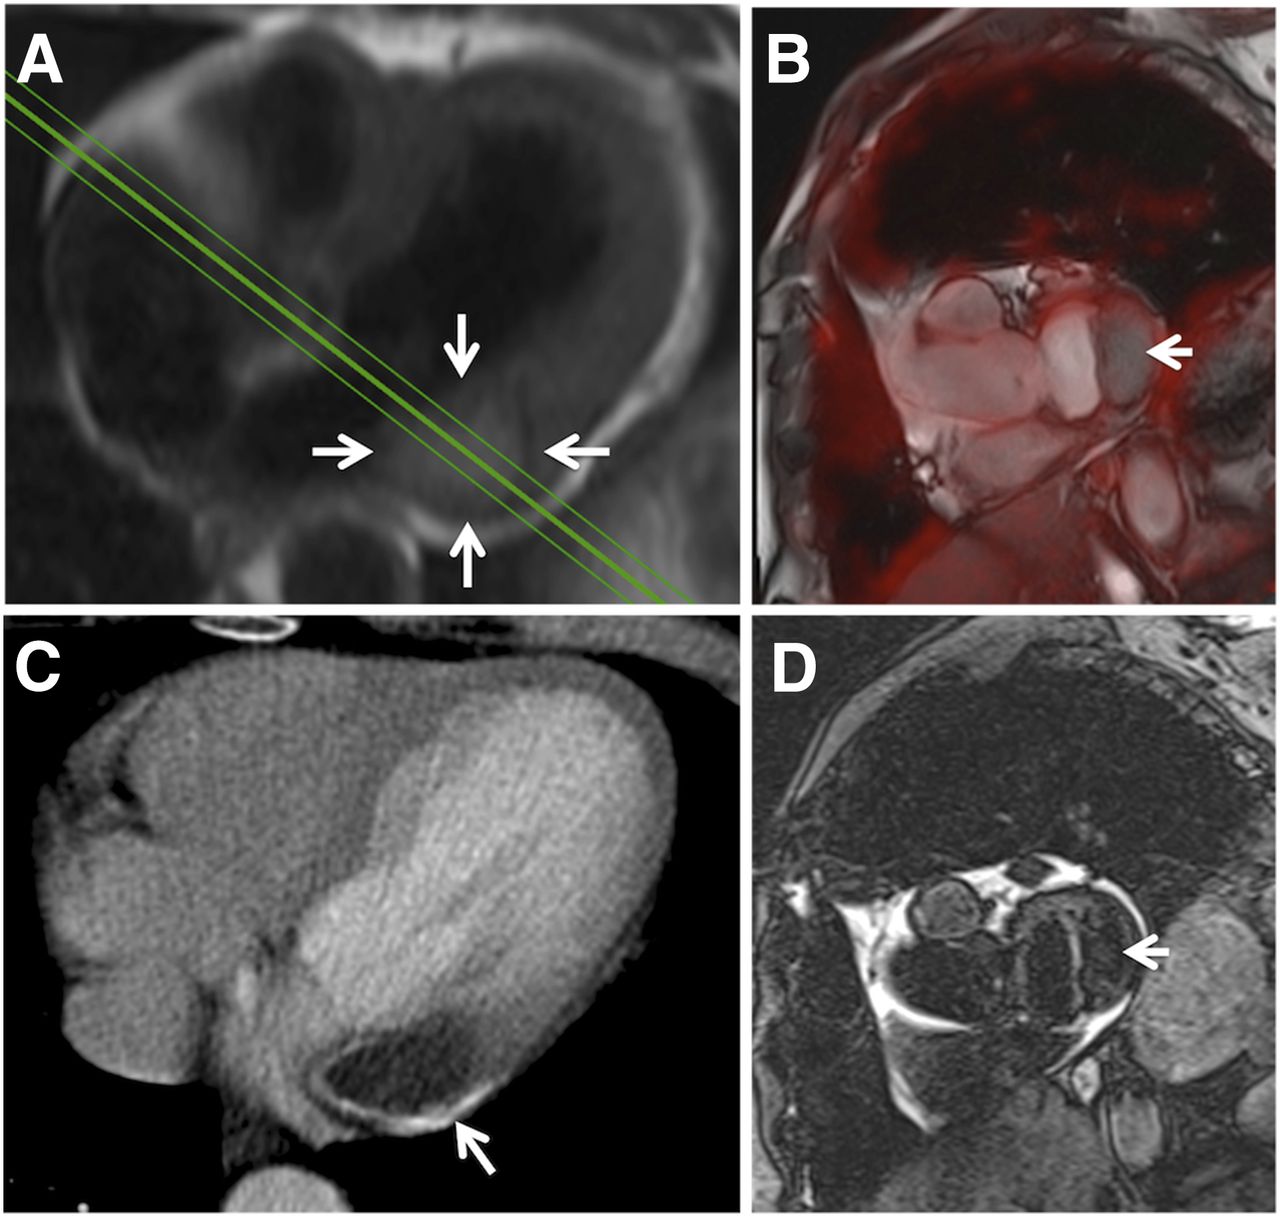
(A) Axial HASTE image (arrows) of lesion in basolateral myocardial wall adjacent to mitral valve. Lesion did not show any significant 18F-FDG uptake (fusion B; arrow). Lesion also showed calcifications on CT scan (C; arrow) and was diagnosed as caseous calcification of mitral annulus (Table 1, patient 17). Lesion was hypointense on T2w images (D; arrow).
In 3 patients, additional metastases were detected by PET/MR imaging. In 1 patient with local relapse of cardiac angiosarcoma, additional pulmonary metastases were found (Table 1, patient 6). In 1 patient with no local relapse after resection of cardiac fibrosarcoma, a metastasis in the upper right thoracic wall was found (Table 1, patient 9). In 1 patient with anal carcinoma and a large thrombus in the right ventricular outflow tract, mediastinal lymph node metastases were found (Table 1, patient 18; Fig. 1).
18F-FDG Uptake
The mean SUV in the blood pool was 1.3 ± 0.3 (range, 0.8–2.1; n = 20). The mean SUVmax in primary and secondary malignant tumors was 13.2 ± 6.2 (range, 5.2–21.3; n = 7). The mean SUVmax in benign tumors and thrombi was 2.0 ± 0.9 (range, 1.0–3.8; n = 11). The mean SUVmax in all nonmalignant cases (benign tumors, thrombi, and scar tissue) was 2.3 ± 1.2 (range, 1.0–5.2; n = 13). The mean SUVmax was significantly higher in malignant tumors (Wilcoxon test P = 0.0004).
Malignant and benign cases overlapped at an SUVmax of 5.2, which was found in one patient with cardiac metastases of angiosarcoma of the limb (Table 1, patient 3) and in another patient with patch tissue after resection of a primary fibrosarcoma (Table 1, patient 9).
A statistically significant correlation between tumor size and SUVmax was found (Spearman ρ = 0.60, P = 0.005).
MR Imaging
Mean tumor volume was significantly larger in malignant cases (140 ± 171 vs. 17 ± 23 mL, Wilcoxon test P = 0.0012). Pericardial effusion was found in 5 of 7 malignant cases and in 2 of 13 nonmalignant cases (χ2 test P = 0.044). All malignant cases showed hyperintense signal in T2w images. However, T2w hyperintensity was also found in 6 of 13 nonmalignant cases (χ2 test P = 0.055). All malignant cases showed contrast enhancement in T1w images after intravenous injection of a gadolinium-based contrast agent. However, contrast enhancement was also found in 7 of 13 nonmalignant cases (χ2 test P = 0.102). Six of 7 malignancies were correctly identified by morphologic features using cine SSFP imaging, whereas 12 of 13 nonmalignant cases were correctly identified (χ2 test P = 0.003). Considering all available MR features, consent interpretation correctly identified all 7 malignancies, whereas also 1 nonmalignant case was falsely classified as being malignant (χ2 test P = 0.0004).
Classification Analysis
Receiver-operating-characteristic analysis showed SUVmax to identify malignant cases best when using a threshold of 5.2 or greater, resulting in 100% sensitivity and 92% specificity. Tumor volume was found to identify malignant cases best when using a threshold of 23.1 mL or more, resulting in 100% sensitivity and 85% specificity. T2w hyperintensity and contrast enhancement both yielded 100% sensitivity but a weak specificity of 54% and 46%, respectively. Pericardial effusion yielded 71% sensitivity and 85% specificity. Morphologic tumor features as assessed by cine MR imaging yielded 86% sensitivity and 92% specificity. Consent interpretation using all available MR features yielded 100% sensitivity and 92% specificity. A Boolean ‘AND’ combination of SUVmax 5.2 or greater with consent MR image interpretation improved sensitivity and specificity to 100% (Table 2).
Diagnostic Performance of PET and MR Features
DISCUSSION
In this study, we sought to evaluate whether integrated 18F-FDG PET/MR imaging could improve the diagnostic workup of cardiac tumors. Interpreted independently, we found both 18F-FDG PET and MR imaging to yield 100% sensitivity and 92% specificity in determining tumor malignancy. A combination of 18F-FDG PET and MR imaging yielded 100% sensitivity and specificity, when both tests were required to be positive for diagnosing malignancy.
Perfect classification (100% sensitivity and specificity) is extremely unlikely for any biomedical test. However, one has to consider that first, 18F-FDG PET and cardiac MR imaging alone have already been reported to yield high sensitivity and specificity (9,10), and second, the sample size in the present study was relatively small. In fact, there were just 2 cases (both with an SUVmax of 5.2) that could not be differentiated using 18F-FDG PET alone. Classification by any optimal SUVmax threshold would correctly classify one and misclassify the other, resulting in only 1 misclassification in 20 cases. Thus, any more sensible values for sensitivity and specificity (e.g., >95%, but <100%) could not be expected because of the small sample size. Considering both 18F-FDG PET and MR imaging, these findings could be unequivocally identified as malignancy in the one case and patch tissue in the other. In another case, in which scar tissue was misclassified by MR imaging as local relapse of cardiac angiosarcoma, a relatively low SUVmax of 2.2 made malignant relapse unlikely. Therefore, these findings indicate additional value of PET/MR imaging in selected cases.
An 18F-FDG PET/CT study by Rahbar et al. in 24 patients with cardiac tumors yielded 100% sensitivity with 86% specificity at an SUVmax cutoff of 3.5 and 94% sensitivity with 100% specificity at an SUVmax cutoff of 4.6 (10), which were similar to our findings. In fact, applying their cutoff of 3.5 to our data yielded nearly the same values for sensitivity (100%) and specificity (85%). T1w and contrast-enhanced MR imaging were found to yield high sensitivity but low specificity, which was expected from known MR characteristics of cardiac tumors (4,17,18). Hyperintensity on native T1w images was not helpful as a classifier on its own but is a prerequisite to reliably evaluate contrast enhancement on T1w postcontrast images. Because size and metabolism are predictors of tumor malignancy, a certain correlation between both was anticipated. Interestingly such a correlation was not found in the study by Rahbar et al., which might be explained by their 1-dimensional assessment of tumor size (10).
As clinical availability of integrated PET/MR imaging rises (14) and the feasibility of cardiac PET/MR imaging has been demonstrated (19), it is important to know whether 18F-FDG PET/MR imaging provides added value over established imaging methods in the assessment of cardiac tumors. 18F-FDG PET/CT alone can quite accurately discriminate between malignant and benign tumors; however, CT is suboptimal for the presurgical assessment of tumor morphology. Cardiac MR imaging allows for excellent delineation of cardiac tumors due to high soft-tissue contrast, particularly regarding infiltration in adjacent tissue and the involvement of critical structures such as valves or papillary muscles. Also, impairment of cardiac function can be measured by quantification of systolic function, wall motion, and blood flow. Integrated 18F-FDG PET/MR imaging obviously combines the advantages of both methods within a single examination and moreover seems to be the most accurate method for the determination of malignancy. However, in many cases sequential PET/CT and MR imaging (with or without post hoc fusion) might be equally well suited, with the exception of those cases for which optimal coregistration is essential. Particularly the differentiation of scar tissue versus relapse in follow-up examinations after surgery of cardiac malignancies might benefit from simultaneous PET/MR imaging.
The main limitation of this study is the small sample size. Cardiac tumors are rare, and integrated PET/MR imaging has been available just for a few years. Thus, the results of this pilot study must be considered preliminary, and further multicenter studies and meta-analyses should follow. Another limitation was the availability of a histologic reference standard in only 15 of 20 patients. However, in all 5 patients without a histologic reference standard, both interpreters were confident of their diagnoses so that cardiac biopsy was not performed because this is rather invasive and has the risk of severe complications. Also, in both patients with a history of cardiac sarcoma the diagnosis was later confirmed by follow-up imaging. A general limitation of integrated PET/MR imaging is the lack of transmission-based attenuation correction for PET data. The segmentation-based attenuation correction that was used in the present study has been shown to result in SUV measurement errors of varying degree when compared with a reference standard based on PET/CT (16). However, larger differences were primarily found in bone lesions and less in soft tissue (16). Still, SUVs close to the diagnostic cutoff need to be handled with care, and visual inspection of attenuation maps for segmentation errors seems mandatory. Finally, MR imaging offers many more techniques for tissue differentiation that were not integrated in our study protocol to keep the overall acquisition time within certain limits. MR imaging techniques such as rest perfusion imaging or postcontrast T1w imaging with long inversion times are often used for thrombus discrimination (20), whereas semiquantitative techniques such as diffusion-weighted imaging and T1 and T2 mapping might further improve the diagnostic accuracy in the assessment of cardiac tumors.
CONCLUSION
Simultaneous PET/MR imaging with 18F-FDG combines detailed morphologic tumor characterization with the accurate assessment of tumor malignancy and thus seems to be a powerful tool in the diagnostic workup of cardiac tumors. However, given the already strong performance of competitive methods such as PET/CT and MR imaging, high cost, and limited availability of PET/MR scanners, simultaneous PET/MR imaging might be reserved for selected cases for which true benefit can be expected.
DISCLOSURE
The costs of publication of this article were defrayed in part by the payment of page charges. Therefore, and solely to indicate this fact, this article is hereby marked “advertisement” in accordance with 18 USC section 1734. No potential conflict of interest relevant to this article was reported.
Footnotes
Published online Dec. 31, 2014.
- © 2015 by the Society of Nuclear Medicine and Molecular Imaging, Inc.
REFERENCES
- Received for publication August 26, 2014.
- Accepted for publication December 8, 2014.


Jump to section
Related Articles
Cited By...
- PET/MRI, Part 4: Clinical Applications
- Cardiac myxomas: clinical presentation, diagnosis and management
- Diagnostic Accuracy of Cardiac Computed Tomography and 18F-Fluorodeoxyglucose With Positron Emission Tomography in Cardiac Masses
- Cardiac Tumors: JACC CardioOncology State-of-the-Art Review
- MR/PET Imaging of the Cardiovascular System
- Characteristics and Survival of Malignant Cardiac Tumors: A 40-Year Analysis of >500 Patients