


Abstract
Simultaneous reconstruction of activity and attenuation using the maximum-likelihood reconstruction of activity and attenuation (MLAA) augmented by time-of-flight information is a promising method for PET attenuation correction. However, it still suffers from several problems, including crosstalk artifacts, slow convergence speed, and noisy attenuation maps (μ-maps). In this work, we developed deep convolutional neural networks (CNNs) to overcome these MLAA limitations, and we verified their feasibility using a clinical brain PET dataset. Methods: We applied the proposed method to one of the most challenging PET cases for simultaneous image reconstruction (18F-fluorinated-N-3-fluoropropyl-2-β-carboxymethoxy-3-β-(4-iodophenyl)nortropane [18F-FP-CIT] PET scans with highly specific binding to striatum of the brain). Three different CNN architectures (convolutional autoencoder [CAE], Unet, and Hybrid of CAE) were designed and trained to learn a CT-derived μ-map (μ-CT) from the MLAA-generated activity distribution and μ-map (μ-MLAA). The PET/CT data of 40 patients with suspected Parkinson disease were used for 5-fold cross-validation. For the training of CNNs, 800,000 transverse PET and CT slices augmented from 32 patient datasets were used. The similarity to μ-CT of the CNN-generated μ-maps (μ-CAE, μ-Unet, and μ-Hybrid) and μ-MLAA was compared using Dice similarity coefficients. In addition, we compared the activity concentration of specific (striatum) and nonspecific (cerebellum and occipital cortex) binding regions and the binding ratios in the striatum in the PET activity images reconstructed using those μ-maps. Results: The CNNs generated less noisy and more uniform μ-maps than the original μ-MLAA. Moreover, the air cavities and bones were better resolved in the proposed CNN outputs. In addition, the proposed deep learning approach was useful for mitigating the crosstalk problem in the MLAA reconstruction. The Hybrid network of CAE and Unet yielded the most similar μ-maps to μ-CT (Dice similarity coefficient in the whole head = 0.79 in the bone and 0.72 in air cavities), resulting in only about a 5% error in activity and binding ratio quantification. Conclusion: The proposed deep learning approach is promising for accurate attenuation correction of activity distribution in time-of-flight PET systems.
The attenuation correction of annihilation photons is a critical procedure in PET image generation for providing accurate quantitative information on the radiotracer distribution. In current PET/CT systems, the linear attenuation coefficient (μ) for 511-keV photons is converted from the CT Hounsfield unit (1,2). In PET/MRI, various approaches, including Dixon and ultrashort echo-time MRI segmentation- and atlas-based algorithms, have been suggested (3–6). However, a limitation of CT-based PET attenuation correction is the artifacts attributed to the position mismatch between the PET and CT scans (7–9). MRI-based PET attenuation correction remains far from ideal on account of the inaccurately estimated linear attenuation coefficients (μ-values) in the skeletal structures and heterogeneous soft tissues (10–12). In particular, bones are poorly identified in whole-body PET/MRI studies (13) and local MRI signal loss produced by metallic implants results in the considerable error in image segmentation.
Simultaneous reconstruction of activity and attenuation using only emission data is a promising method for the PET attenuation correction augmented by the recent advancement of time-of-flight technology (14–17). Because no anatomic images are necessary for the attenuation correction if the simultaneous reconstruction works properly, it is a potentially significant approach to overcoming the above-mentioned limitations of PET attenuation correction in PET/CT and PET/MRI (18–20). Among the simultaneous reconstruction algorithms for PET attenuation correction, the maximum likelihood reconstruction of activity and attenuation (MLAA) method has the advantages of providing an μ-map and enabling the incorporation of prior knowledge of the μ-values for global scaling (15,16,21,22). However, because of the limited timing resolution of current clinical PET scanners, the MLAA suffers from several problems, including the crosstalk artifacts (between activity and μ-maps), slow convergence speed, and noisy μ-maps (23,24).
Recently, deep learning has outperformed the traditional machine learning and Bayesian approaches in many different applications (25,26). In addition, recent studies have shown the remarkable advancements in the noise reduction of CT based on deep learning technology (27,28). Accordingly, it is of interest whether the deep learning approach can mitigate the limitations of MLAA simultaneous reconstruction. In this study, we therefore designed deep convolutional neural networks (CNNs) to be suitable for MLAA output (activity distribution and μ-map) processing. We examined the quality improvement of MLAA μ-maps and emission PET images by applying deep learning with a focus on noise and crosstalk reduction.
We applied this new approach to one of the most challenging clinical PET cases for simultaneous reconstruction (brain dopamine transporter imaging). The crosstalk between the activity and attenuation is severe and the background noise level is high in the dopaminergic PET images because of the highly specific binding of the tracers only in the striatum of brain.
MATERIALS AND METHODS
Dataset
The 18F-fluorinated-N-3-fluoropropyl-2-β-carboxymethoxy-3-β-(4-iodophenyl)nortropane (18F-FP-CIT) brain PET/CT scan data of 40 patients (16 men and 24 women; mean age ± SD, 67.5 ± 9.2 y) with suspected Parkinson disease were retrospectively analyzed. In 14 of the 40 subjects, the tracer uptake in both basal ganglia was preserved. The retrospective use of the scan data and waiver of consent were approved by the Institutional Review Board of our institute. The PET/CT data were acquired using a Biograph mCT 40 scanner (Siemens Healthcare). The PET scanner achieves an effective timing resolution of 580 ps. The PET/CT imaging was performed for 10 min at a single PET bed position 90 min after the intravenous injection of 18F-FP-CIT (189.7 MBq on average). The head of each participant was positioned in a head holder attached to the patient bed, and the PET/CT scan followed the routine clinical protocol for brain studies (topogram, CT, and emission PET scans). The CT images were reconstructed in a 512 × 512 × 149 matrix with a voxel size of 0.59 × 0.59 × 1.5 mm and converted into the μ-map for 511-keV photons (μ-CT, 200 × 200 × 109; 2.04 × 2.04 × 2.03 mm).
We reconstructed all datasets using ordered-subset expectation maximization (OSEM) with μ-CT (3 iterations, 21 subsets, 5-mm gaussian postprocessing filter) and MLAA with the time-of-flight information (8 iterations and 21 subsets, 5-mm gaussian postprocessing filter) into 200 × 200 × 109 matrices. To correct the global scaling problem, the boundary constraint suggested in the original time-of-flight MLAA paper (15) was applied during the attenuation image estimation in the MLAA.
To evaluate the performance of proposed CNNs, we performed 5-fold cross-validation. The 40 patient datasets were randomly partitioned into 5 groups (8 in each group). The CNNs were trained with 4 groups and tested with the other one. This cross-validation process with different test sets was repeated 5 times. For the CNN training and testing, the activity distribution and μ-map derived from the MLAA (λ-MLAA and μ-MLAA) were used as input X, and μ-CT was used as output Y. All the input and output images were used in 2-dimensional slice format.
Network Architecture
We tested 3 different CNN architectures (Fig. 1). The first one was the convolutional autoencoder (CAE). The autoencoder was originally proposed for unsupervised feature learning; nevertheless, it also showed good performance for image restoration and denoising networks (29). The second one was Unet, which showed excellent performance in various tasks, including image segmentation and denoising (30). Unet structures are similar to those of the CAE. However, unlike CAE, Unet supplements the contracting path that enables high-resolution features to be combined in the output layers. The third one was the Hybrid form of CAE and Unet, which we propose herein to prevent the noise propagation from the high-frequency feature of the PET activity distribution (Hybrid network).

CNN architectures used to learn μ-CT from λ-MLAA and μ-MLAA. (A) CAE. (B) Unet. (C) Hybrid network of CAE and Unet. Green and red vertical strips at far left indicate inputs to CNN, and red stripes at right indicate output. Each box represents multichannel feature map. Number of feature maps and dimension of each feature map are denoted on interior and bottom of box. Data flow is left to right through contracting path to capture context and symmetric expanding path to recover image. Arrows stand for copying feature maps, and sky-blue boxes are copied feature map.
The 3 networks (CAE, Unet, and Hybrid) consisted of convolution layers, rectified linear units (an activation function defined as f(x) = max(0, x) and used to provide nonlinearity in the learning model), 2 × 2 max-pooling layers, deconvolution layers, and a 1 × 1 convolution layer (Fig. 1). The max-pooling, a reduction operation for calculating the maximum value in each rectangular window, was required to reduce the number of parameters of the network and provide a shift-invariant characteristic to CNN. In the first layer, we performed a convolution with a 3 × 3 × 2 kernel to merge 2 input datasets (MLAA activity distribution and μ-map). Each convolution and deconvolution layer except the first convolution layer was composed of a 3 × 3 kernel and rectified linear units. The last 1 × 1 convolution layer performed a role in scaling. The number of feature maps in the first layer was empirically determined to yield the best results. We implemented the networks using the TensorFlow, an open-source library for deep learning (31).
Data Augmentation and Training
Because the number of parameters in the deep networks was too large to be estimated from the limited patient dataset, we had to increase the training data (data augmentation). We conducted the data augmentation by rotating the images by −6°, −3°, 0°, 3°, and 6° in 3-dimensional orthogonal planes (5 × 5 × 5 = 125 times augmentation). Additionally, we used images flipped in the transverse plane to double the training set. Accordingly, the total number of slices available for training was 32 (patient) × 109 (transverse plane) × 125 (rotating) × 2 (flip) = 872,000. Among them, only 800,000 slices were used as the training set after eliminating slices with only negligibly small pixel values and the last 5 slices at the bottom.
The cost function was the L2-norm between the MLAA μ-map and μ-CT. The cost function was minimized using the adaptive moment estimation method (32). Weights in the networks were initialized using the Xavier initialization method, which engendered a faster convergence rate compared with uniform or gaussian random initialization (33). To prevent network overfitting, a part of the nodes was dropped out (34). In each convolution layer, the dropout probability (ratio of remaining node number of total) was 0.7. The batch size was 60, and the number of epochs (the number of times the algorithm sees the entire dataset) was 6. When using the Ryzen 1700X central processing unit with a GTX 1080 graphics processing unit, each epoch involved approximately 300 min.
Image Analysis
The μ-maps obtained using the MLAA before (μ-MLAA) and after (μ-CAE, μ-Unet, and μ-Hybrid) applying the deep CNNs to the test set were compared with the μ-CT, the ground truth. The similarity of μ-maps was evaluated using the Dice similarity coefficient (D) (3,35), which measured the overlap of the segmented bone and air regions according to the following equation: where Nμ-CT and Nμ-PET are, respectively, the number of bone (or air) voxels in the μ-maps derived from CT and PET (emission only) data (3,35). N(μ-CT∩μ-PET) indicates the number of overlapped voxels between CT and PET μ-maps. In the μ-maps, the voxels having a μ-value of more than 0.1134 (=300 Hounsfield units) were classified as bone; those having a μ-value of less than 0.0475 (= −500 Hounsfield units) were denoted as air. Additionally, the voxels having a μ-value between them were regarded as soft tissue (3,36).
For comparison with the ground truths of the PET activity distribution obtained using OSEM reconstruction with μ-CT, the activity images were generated using the same OSEM algorithm and parameters (8 iterations and 21 subsets, 5-mm gaussian postprocessing filter) with μ-MLAA, μ-CAE, μ-Unet, and μ-Hybrid (Fig. 2). The ground truth PET activity was spatially normalized using an in-house 18F-FP-CIT PET template and Statistical Parametric Mapping software (version 8; http://www.fil.ion.ucl.ac.uk/spm). The same transformation parameters were applied to the others. Then, we measured the PET activity concentration in 4 regions of interest (head of caudate nucleus, putamen, occipital cortex, and cerebellum) using an automatic region-of-interest delineation method with statistical probabilistic anatomic maps (37,38). For the comparison, the relative ratio of specific binding ([Cspecific – Cnonspecific]/Cnonspecific) was calculated (Cspecific and Cnonspecific are the activity concentrations in specific and nonspecific [cerebellum or occipital cortex] binding regions) (3).
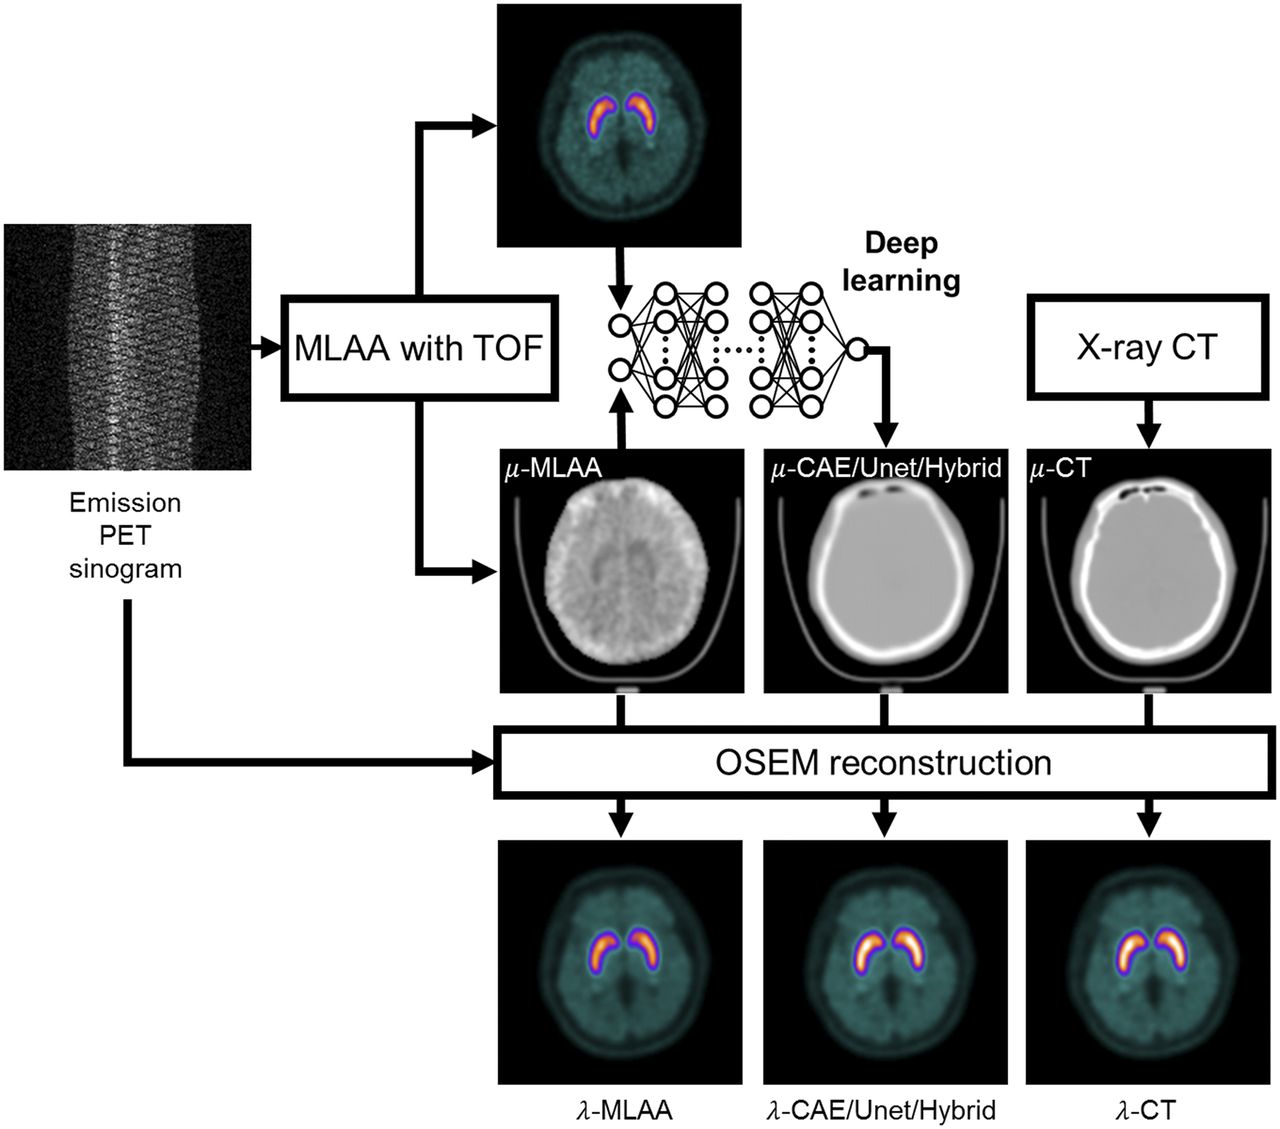
Flow chart of image analysis. For comparison, emission PET sinogram was reconstructed using μ-maps obtained using MLAA before (μ-MLAA) and after (μ-CAE, μ-Unet, and μ-Hybrid) applying deep CNNs and ground truth μ-CT. TOF = time of flight.
RESULTS
The CNNs remarkably reduced the noise and crosstalk in μ-MLAA. In Figure 3, the CNN-generated μ-maps (μ-CAE, μ-Unet, and μ-Hybrid) of a patient are compared with the μ-CT and μ-MLAA. As expected, the CNNs generated less noisy and more uniform images than μ-MLAA. Among the CNNs, the CAE and Unet yielded the most blurred and sharpened μ-maps, respectively. The air cavities and bones were better resolved in the proposed CNN outputs than with the μ-MLAA. However, the details of these structures did not perfectly match the μ-CT. Moreover, slight discontinuities of air cavities and bone structures still appeared in the sagittal and coronal planes because of the application of the CNNs to the 2-dimensional slices. Figure 3 also shows that the proposed deep learning approach is useful for mitigating the crosstalk problem in MLAA reconstruction. The red arrows on μ-MLAA point to the striatal region where the crosstalk between activity and attenuation is substantial in MLAA outputs. This artifact disappears in the μ-maps corrected by deep learning (μ-CAE, μ-Unet, and μ-Hybrid).
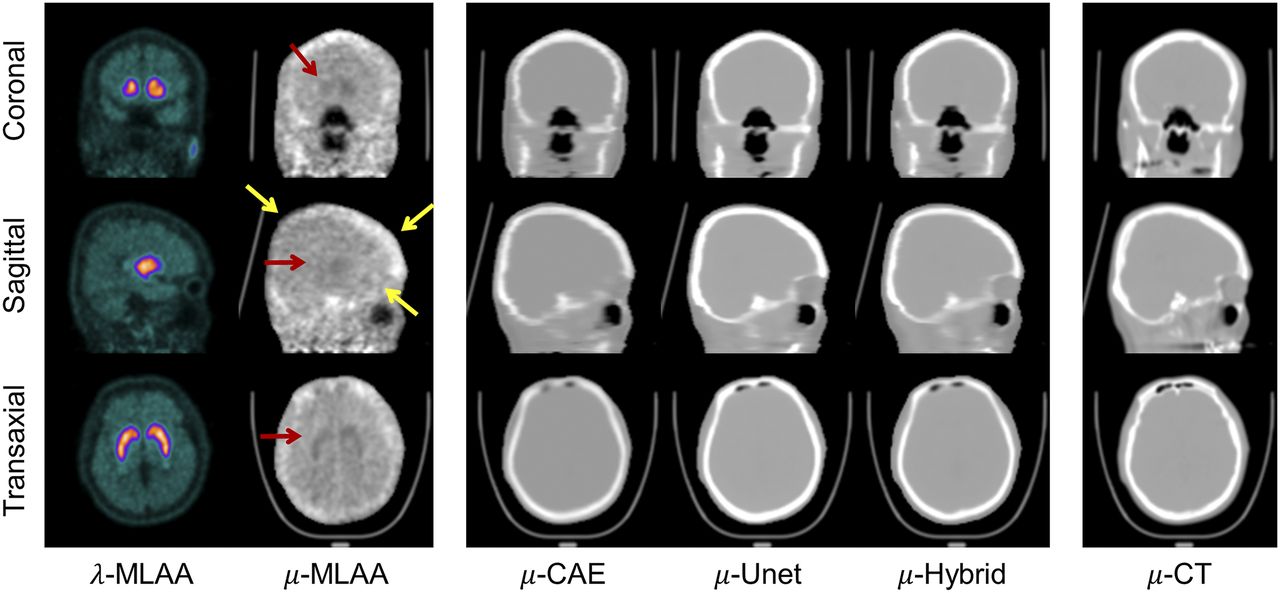
Comparison of CNN outputs (μ-CAE, μ-Unet, and μ-Hybrid) to μ-MLAA and μ-CT. Red and yellow arrows indicate, respectively, crosstalk artifacts and bone estimation error shown in μ-MLAA.
The CNN-generated μ-maps showed higher similarity with the μ-CT than the original μ-MLAA did. In Figure 4, root-mean square errors from the μ-CT are plotted across the slice axial location (average of all 40 test subjects). The CNN-generated μ-maps yielded fewer errors than μ-MLAA in almost all axial locations. The Hybrid network outperformed the CAE and Unet at the top of the head, and it achieved approximately 50% error reduction relative to the original MLAA in the μ-value estimation. The bias and root-mean square error of μ-maps relative to the μ-CT are summarized in Supplemental Figure 1; supplemental materials are available at http://jnm.snmjournals.org.
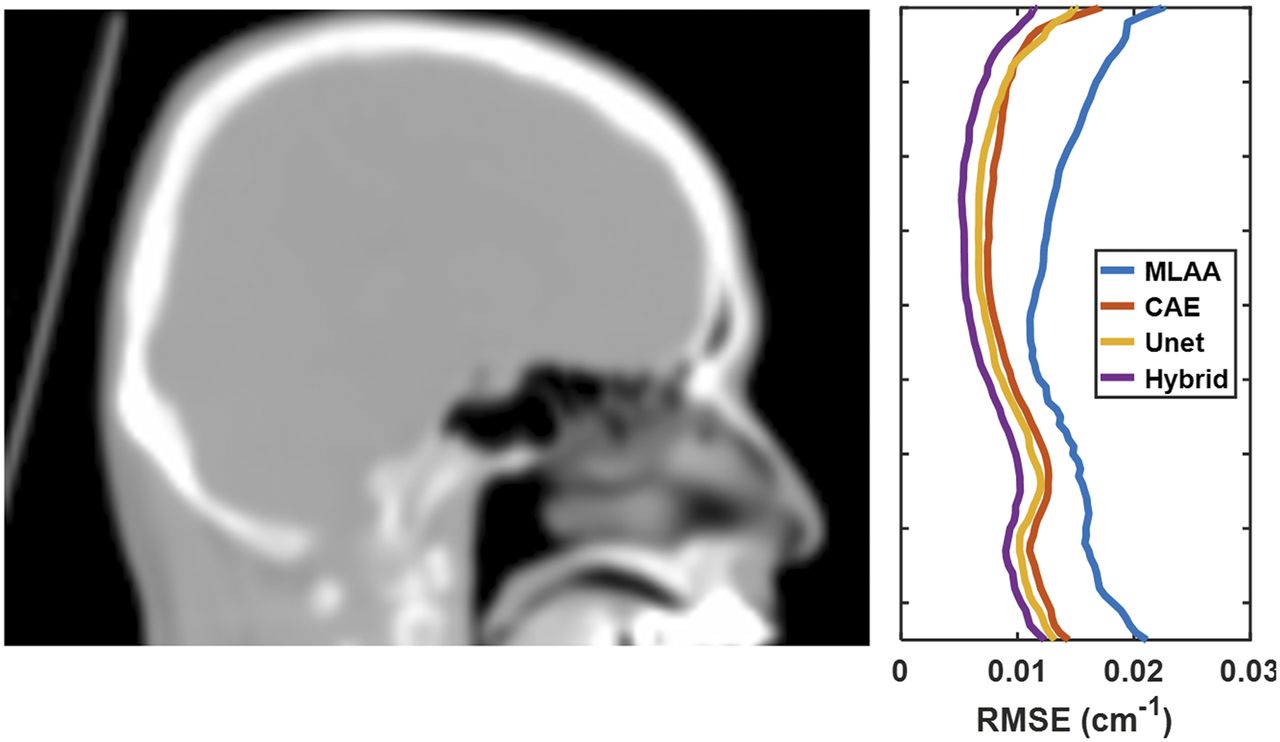
Root-mean square errors (RMSE) relative to μ-CT plotted across slice axial location (average of 40 test sets).
As shown in Table 1, the Dice similarity coefficients measured in the whole head and only the cranial bone regions for air and bone were generally much higher in the CNN-generated μ-maps. The SD of the Dice similarity coefficients were considerably smaller in the CNN-generated μ-maps than in those of μ-MLAA, indicating improvement in the consistency of μ-value estimation. In μ-MLAA, the skull intensity and thickness were under- or overestimated in some regions (yellow arrows in Fig. 3). However, the CNNs properly corrected these errors. Among the CNNs, the Hybrid network and CAE yielded the respective highest and lowest Dice similarity coefficients in all the regions. The Supplemental Figure 2 shows that these results were consistent across all the cross-validation sets.
Dice Similarity Coefficients with μ-CT for Whole Head and Cranial Bone Region
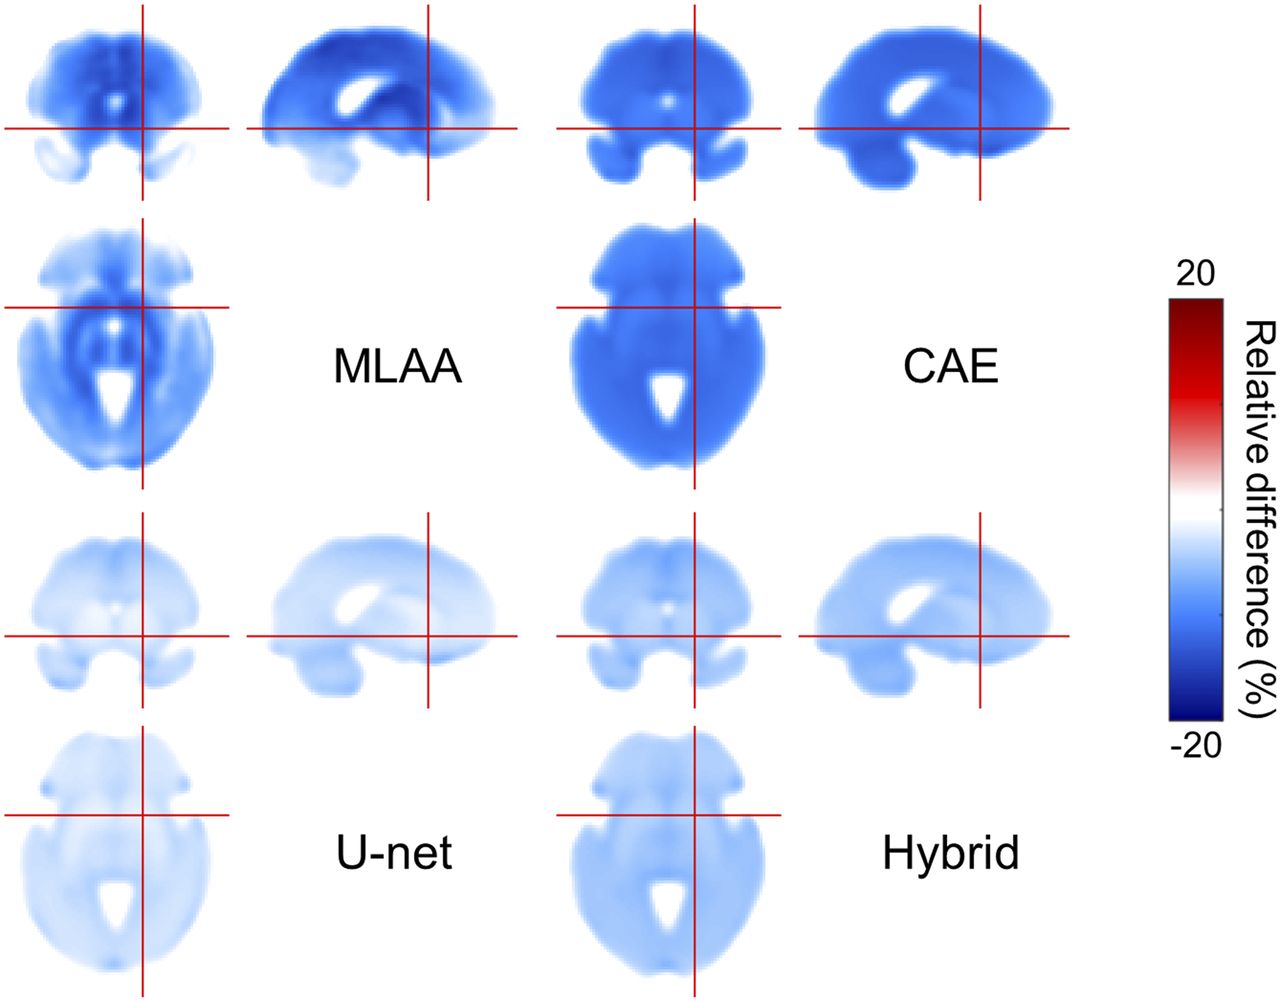
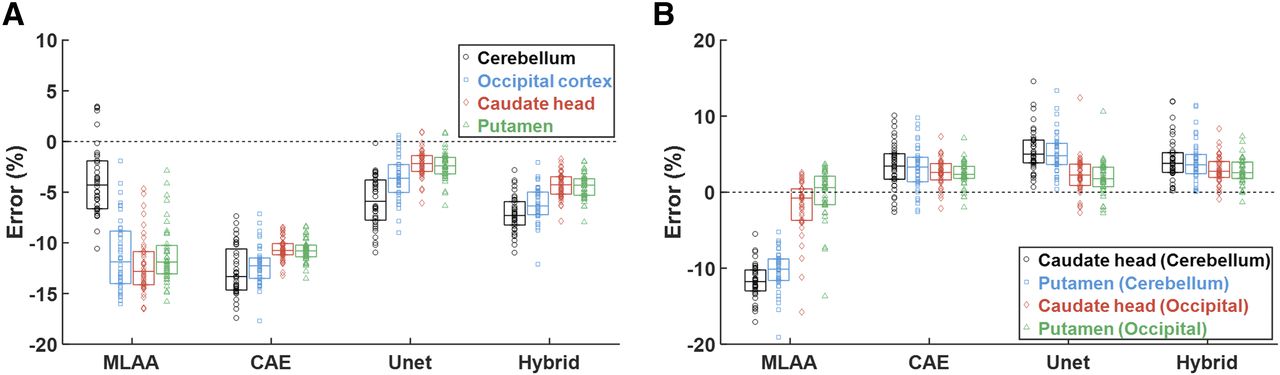
The enhancement in μ-map quality and accuracy by applying the deep CNNs improved the accuracy in the quantification of the regional activity and binding ratio of 18F-FP-CIT PET. The percentage error map of the spatially normalized activity distribution (average of 40 test subjects) is compared in Figure 5, indicating the reduced error in activity distribution with Unet and Hybrid network. Meanwhile, Figure 6 shows the percentage error in activity and binding ratio estimation relative to the ground truth (OSEM with μ-CT). The μ-MLAA yields a negative bias in activity quantification that is higher than 10% in the occipital cortex and striatum. The error is reduced using μ-Unet and μ-Hybrid.

Percentage error map of spatially normalized activity distribution (average of 40 test sets).

Percentage error in activity (A) and binding ratio (B) estimation relative to ground truth (OSEM with μ-CT). Each horizontal bar and vertical box indicates median and SD, respectively. In B, specific and nonspecific regions for binding ratio calculation are indicated as “specific (nonspecific).”
DISCUSSION
Supervised and unsupervised machine learning methods based on artificial neural networks have been investigated for various biomedical engineering applications (39,40). Learning the difference between the patient and control data and predicting the prognosis after treatment based on region-of-interest–driven features were the main application field in nuclear medicine image interpretation and processing (41–43). Additionally, data-driven blind source separation techniques based on an unsupervised neural network were successfully applied to dynamic PET data for the separation of various physiologic and anatomic components (44–47). The use of artificial neural network techniques has been also suggested for more accurate and reliable determination of the annihilation photon interaction position in PET detector blocks (48,49). Meanwhile, deep learning, an emerging technology in machine learning, is showing its initial impact on the medical imaging field (50). However, problem-specific design and optimization of deep networks and rigorous validation with real clinical data are required to justify the medical use of this emergent technology.
One of the main limitations of simultaneous activity and attenuation reconstruction is the crosstalk artifacts between the activity and attenuation in output images. These crosstalk artifacts are most severe in regions with a high contrast against the background, which may be the abnormal uptake of radiotracer requiring high accuracy in activity quantification. The deep CNNs proposed in this paper outperformed the original MLAA algorithm in suppressing the crosstalk and noise in the dopamine transporter PET images. The mitigation of crosstalk artifacts by the CNNs was not simply the consequence of reducing the noise (or suppressing the high-frequency features) in μ-maps and recognizing the location of crosstalk artifacts (Supplemental Fig. 4). Only when the activity and attenuation information were jointly processed by the 3-dimensional convolution kernel at the first layer of the networks was this crosstalk successfully suppressed. The joint feature learning from both the activity and attenuation at the early stage was also useful for the accurate restoration of bone structures and air cavities in μ-maps (Fig. 3). The lower radioactivity in the bone and air relative to the soft tissue and cerebrospinal fluid would enable the CNNs to learn how to correctly differentiate them.
Most CNN parameters were empirically determined through trial and error. The performance of CNN was not much influenced by the kernel size (i.e., 5 or 7 yielded results similar to 3). The 20 feature maps in the first layer yielded the lowest and most stable learning curve. In contrast, the learning curve did not converge with feature maps smaller than 12 and showed an overshoot at early iterations with the maps larger than 28. Learning rate and other parameters were also determined mostly while observing the learning curves.
The CNNs trained in this study yielded better μ-maps than our multiphase-level-set–based ultrashort echo-time MRI segmentation (3) with respect to the similarity to μ-CT. Particularly, the Dice similarity coefficients for air cavities were remarkably higher in the present study (0.72 vs. 0.61 in the whole head and 0.74 vs. 0.62 in the cranial region). Although the Hybrid method has a higher Dice coefficient than Unet, Unet performs slightly better than the Hybrid method in activity quantification (Figs. 5 and 6) because the Dice coefficient measures similarity in terms of segmented region overlap but does not measure similarity in terms of quantitative values. As shown in Supplemental Figure 1, the Unet yielded lower bias in average μ-values than the other methods, explaining why the activity maps estimated by the Hybrid method are less accurate than those estimated by Unet despite the better segmentation.
There are some existing works on applying deep learning to predict CT μ-maps based on T1-weighted MR images or a combination of Dixon and zero-echo-time images (51,52). The approach using the Dixon and zero-echo-time images would be more physically relevant than the T1-weighted MRI-based approach because the Dixon and zero-echo-time sequences provide more direct information on the tissue composition than does the T1 sequence. The method proposed in this study has the same physical relevance as the Dixon or zero-echo-time approach but does not require the acquisition of additional MR images.
CONCLUSION
In this work, we developed deep CNNs to overcome the main limitations of the MLAA simultaneous reconstruction algorithm. We verified their feasibility using an 18F-FP-CIT brain PET dataset. The proposed deep learning approach remarkably enhanced the quantitative accuracy of simultaneously estimated MLAA μ-maps by reducing the noise and crosstalk artifacts. The Hybrid network of CAE and Unet yielded μ-maps the most similar to μ-CT (Dice similarity coefficient in the whole head = 0.79 in the bone and 0.72 in air cavities), resulting in only about a 5% error in activity and binding ratio quantification. Because the proposed method requires no transmission data, anatomic image, or atlas/template for PET attenuation correction, it has potential to replace the conventional attenuation correction methods in stand-alone PET, PET/CT, and PET/MRI.
DISCLOSURE
This work was supported by the National Research Foundation of Korea (NRF), funded by the Korean Ministry of Science and ICT (grants NRF-2014M3C7034000, NRF-2016R1A2B3014645, and NRF-2017M3C7A1044367). The funding source was not involved in the study design, collection, analysis, or interpretation. No other potential conflict of interest relevant to this article was reported.
Footnotes
Published online Feb. 15, 2018.
- © 2018 by the Society of Nuclear Medicine and Molecular Imaging.
REFERENCES
- Received for publication September 28, 2017.
- Accepted for publication January 25, 2018.


Jump to section
Related Articles
Cited By...
- Improving 18F-FDG PET Quantification Through a Spatial Normalization Method
- Nuclear Medicine and Artificial Intelligence: Best Practices for Algorithm Development
- PET/MRI, Part 2: Technologic Principles
- Machine Learning in Nuclear Medicine: Part 2--Neural Networks and Clinical Aspects
- Denoising of Scintillation Camera Images Using a Deep Convolutional Neural Network: A Monte Carlo Simulation Approach
- Intelligent Imaging: Artificial Intelligence Augmented Nuclear Medicine
- Generation of PET Attenuation Map for Whole-Body Time-of-Flight 18F-FDG PET/MRI Using a Deep Neural Network Trained with Simultaneously Reconstructed Activity and Attenuation Maps