


Abstract
We present a novel technique for accurate whole-body attenuation correction in the presence of metallic endoprosthesis, on integrated non–time-of-flight (non-TOF) PET/MRI scanners. The proposed implant PET-based attenuation map completion (IPAC) method performs a joint reconstruction of radioactivity and attenuation from the emission data to determine the position, shape, and linear attenuation coefficient (LAC) of metallic implants. Methods: The initial estimate of the attenuation map was obtained using the MR Dixon method currently available on the Siemens Biograph mMR scanner. The attenuation coefficients in the area of the MR image subjected to metal susceptibility artifacts are then reconstructed from the PET emission data using the IPAC algorithm. The method was tested on 11 subjects presenting 13 different metallic implants, who underwent CT and PET/MR scans. Relative mean LACs and Dice similarity coefficients were calculated to determine the accuracy of the reconstructed attenuation values and the shape of the metal implant, respectively. The reconstructed PET images were compared with those obtained using the reference CT-based approach and the Dixon-based method. Absolute relative change (aRC) images were generated in each case, and voxel-based analyses were performed. Results: The error in implant LAC estimation, using the proposed IPAC algorithm, was 15.7% ± 7.8%, which was significantly smaller than the Dixon- (100%) and CT- (39%) derived values. A mean Dice similarity coefficient of 73% ± 9% was obtained when comparing the IPAC- with the CT-derived implant shape. The voxel-based analysis of the reconstructed PET images revealed quantification errors (aRC) of 13.2% ± 22.1% for the IPAC- with respect to CT-corrected images. The Dixon-based method performed substantially worse, with a mean aRC of 23.1% ± 38.4%. Conclusion: We have presented a non-TOF emission-based approach for estimating the attenuation map in the presence of metallic implants, to be used for whole-body attenuation correction in integrated PET/MR scanners. The Graphics Processing Unit implementation of the algorithm will be included in the open-source reconstruction toolbox Occiput.io.
Accurate estimation of photon attenuation is one of the primary challenges in achieving unbiased measurements of the radiotracer concentration in hybrid PET/MRI (1). Current PET/MR scanners are not equipped with a transmission source (2,3) or x-ray CT components. Thus, the 511-keV photon attenuation maps (μ-maps) need to be estimated directly from the MR or PET data. Although substantial progress in generating accurate head MR-based μ-maps has been made (4–9), there are still many hurdles in estimating whole-body μ-maps (e.g., bone tissue misclassification, arm truncation due to the limited transaxial MR field of view, susceptibility artifacts caused by foreign objects) (10). In this article, we propose a method to correct for the errors in the PET images arising from MR susceptibility artifacts (e.g., image distortions and signal voids) around metallic objects (e.g., prosthetic devices) (11).
In PET/CT imaging, metallic objects lead to streak artifacts in the reconstructed CT images, diminishing their quality and biasing the PET images reconstructed using CT-based μ-maps. In PET/MRI, MR susceptibility artifacts that extend well beyond the implant propagate as signal voids in the resulting MR-based μ-maps. Additionally, the implant attenuation itself is completely ignored. These 2 effects lead to substantial bias in PET quantification both locally and globally and can potentially compromise the clinical interpretability of the resulting PET images. We propose here a novel implant PET-based attenuation map completion (IPAC) method to minimize the bias due to metallic objects in PET quantification.
Attenuation-correction (AC) strategies proposed for PET/MR can be grouped broadly into 3 categories: approaches based on MR segmentation, methods based on MR/CT atlases, and techniques aimed at jointly estimating activity and attenuation from PET emission data. Although the first 2 categories have been shown to achieve promising results for attenuation estimation of human tissues, they cannot account for the presence of metallic implants. For example, the segmentation-based method available on the Biograph mMR (Siemens Healthcare) (12) classifies metal implants and the surrounding tissue as air. This, in turns, propagates a large bias into the emission image. In atlas-based methods, μ-map image estimates are generated through a propagation scheme by locally matching a subject’s MR-derived morphology to an MR/CT template set using local image similarity measurements (4–6). An MR/CT atlas-based attenuation synthesis method (13) was adapted by Bezrukov et al. (14) to include metal artifact correction. However, given the high degree of variability in the position and shape of metal implants, and the large deformations of the MR images in the adjacent areas, current methods based on atlases are of limited applicability. Creating databases large enough to account for the wide range (i.e., shape, dimension, composition) of metallic implants is problematic; incomplete MR data and deformations are complicating the required intra- and intersubject registrations of the training datasets.
Methods to simultaneously reconstruct the radioactivity and attenuation have previously been proposed (15–22). A particularly influential approach is referred to as maximum-likelihood reconstruction of attenuation and activity (15). However, estimating the complete μ-map from the emission data is an ill-posed problem and the resulting activity/attenuation pair often suffers from cross-talk artifacts, where bias in radioactivity features propagates into compensatory bias in the μ-map (and vice versa), reflecting the nonuniqueness of the solution. The incorporation of time-of-flight (TOF) information has been demonstrated to reduce (but not to eliminate) the cross-talk effect (16–20) and the metal-induced artifacts (21). TOF information is, however, currently unavailable on most of the installed hybrid PET/MR scanners.
In the case of the μ-maps generated from the MR data in the presence of an implant, information about the linear attenuation coefficients (LACs) is available everywhere except in the signal void region. Estimating only the missing data in this scenario is a less ill-posed problem than simultaneously estimating the entire μ-map (and the activity distribution) from the attenuated emission data.
Building on previous work published by Nuyts et al. (15), we describe a method for accurate determination of the position, shape, and LAC of a metallic implant. In the standard maximum-likelihood reconstruction of attenuation and activity algorithm (15), the activity and μ-map update steps are alternatively performed using a gradient descent optimization method that does not directly enforce constraints. Moreover, to reach convergence, a different number of gradient ascent steps for the activity with respect to the μ-map must be used while iterating (or a relaxation coefficient must be added to the μ-map update formula).
For our purpose, we implemented the joint reconstruction using a limited-memory Broyden–Fletcher–Goldfarb–Shanno (BFGS) quasi-Newton optimizer (L-BFGS-B) that permits the direct imposition of constraints on the μ-map during reconstruction and does not require the predetermination of a relaxation coefficient.
We have applied the IPAC algorithm to phantom and human data acquired on the Biograph mMR scanner at 2 different institutions. The performance of the method was compared with both the AC method provided by the manufacturer (the Dixon-based approach) and the gold standard CT-based AC.
MATERIALS AND METHODS
Data Acquisition
In a phantom experiment, a hip cobalt/chromium endoprosthesis (LAC, 0.72 cm−1) was placed in the center of a polymethyl methacrylate 16 × 16 × 30 cm3 container (Supplemental Fig. 1; supplemental materials are available at http://jnm.snmjournals.org). The phantom was filled with water mixed with approximately 54 MBq of 18F-FDG, and emission data were acquired for 5 min.
PET/MR datasets from 11 subjects presenting 13 different metal implants were included in the study. PET and MR data were acquired simultaneously using the Biograph mMR scanners installed at 2 of the authors’ institutions (Table 1) as part of larger prospective studies approved by the respective institutional review boards. The emission data were acquired 205 ± 67 min (mean ± SD) after administration of 498 ± 181 MBq (6.55 MBq/kg) of 18F-FDG. The metal implants included 1 hip chromium alloy replacement, 6 hip titanium replacements, 1 femur replacement, 3 sets of titanium spine screws, and 2 sets of dental implants (Table 1). The LAC of the implants were 0.36 cm−1 for titanium and 0.72 cm−1 for cobalt/chromium alloy. The implant characteristics and their material properties were obtained from the manufacturer specifications. Data acquisition parameters, implant material, and dimension specifications for each patient are presented in Table 1 and Supplemental Table 1.
Data Acquisition Parameters, Implant Material Specifications, and Results for DSC and Mean LAC Analysis
Emission data were acquired in 3-dimensional mode for 7.3 ± 2.7 min per bed position and reconstructed using the standard 3-dimensional ordinary Poisson ordered-subset expectation maximization algorithm provided by the manufacturer with 3 iterations and 21 subsets (including corrections for random coincidences, variable detector sensitivity, dead-time, isotope decay, scatter, and photon attenuation). Images were reconstructed into a 344 × 344 × 127 matrix with voxel sizes of 2.086 × 2.086 × 2.031 mm3. MR data were acquired simultaneously with the PET data using a dual echo Dixon–volumetric interpolated breath-hold examination (VIBE) sequence. All subjects underwent a low-dose CT examination within 1 wk of their PET/MRI scan using either a Siemens Biograph-64 or a Philips Gemini TF PET/CT scanner.
Joint Reconstruction of Activity and Attenuation
Building on previous work for non-TOF emission data (22), the simultaneous estimation of the activity and attenuation coefficients was studied here in the framework of maximum a posteriori estimation. The algorithm presented jointly estimates the vector of emission rates (λ) and the vector of LACs (μ) by maximization of the Poisson loglikelihood of emission data and regularization terms: Eq. 1where the elements hid represent the geometric probability that photons emitted from voxel i are detected in line of response d; vd are the emission data;
  are the attenuation factors; cd are the detector normalization factors; lid is the intersection length of the line of response d with voxel i; and sd and rd are the expected contributions of scatter and random coincidences, respectively. The space-invariant smoothing priors for λ and μ, used for regularization, are of the form:
  , with wik = 1 when pixels i and k are neighbors and wjk = 0 otherwise. Each voxel i is connected to its 26 nearest neighbors. Variables α and β are the regularization parameters.
The joint optimization was implemented using an L-BFGS-B algorithm (23). The BFGS is a quasi-Newton method, which uses an approximation of the inverse Hessian matrix to steer its search. The Hessian matrix is approximated from successive gradient values, so only the computation of the gradients is necessary for the optimization. The gradients of the cost function in Equation 1 with respect to λ and μ are given by the following equations: Eq. 2
Eq. 2 Eq. 3The gradients of the smoothing prior term are computed by applying the Laplace filter to λ and μ, respectively. The “L” in L-BFGS stands for limited memory (23), because the algorithm maintains a history of the past m = 16 updates of the gradients to estimate the Hessian and its inverse. The step length in the minimization of the log-posterior is defined implicitly, thus eliminating the need for the predetermination of a relaxation coefficient. Because the choice of the initial inverse Hessian approximation has been shown to be critical, the algorithm was here initialized with an estimation obtained after 2 iterations of the standard gradient ascent maximum-likelihood reconstruction of attenuation and activity algorithm. Finally, the L-BFGS-B is a box-constrained solver that permits the imposition of nonnegativity constraints and explicit constraints in the estimation of the μ-map.
The μ-maps used for the algorithm initialization were generated using the method currently available on the Biograph mMR scanner (12). The images acquired with the Dixon-VIBE sequence are segmented into 3 tissue classes: air, fat, and soft tissue. LACs of 0, 0.085, and 0.0968 cm−1 were then assigned to these tissue classes, respectively. A semiautomatic inpainting method similar to that in Ladefoged et al. (24) was used to segment the region of MR void produced by metal susceptibility artifacts (MSA). A LAC of 0.0968 cm−1 was assigned to this region as an initialization value.
During reconstruction, the Dixon μ-map values were held fixed in the region outside the MSA void; using the box constraint feature of L-BFGS-B, the LACs inside the void were constrained between 0.08 and 1 cm−1, and nonnegativity constraints were applied to the λ coefficients (λi ≥ 0). An isotropic quadratic prior with a small weight α = 0.02, β = 0.01 was included in the radioactivity and attenuation update functions. Reconstructed μ-maps, obtained with the algorithm described above, will be denoted as IPAC μ-maps henceforth.
Scatter-distribution sinograms were calculated using a fully 3-dimensional implementation of the single scatter simulation method (25) with relative scaling, provided by the manufacturer. The whole scatter-correction process went through 2 iterations (using the first μ-map estimation as the input for the second iteration) to refine the scatter estimate.
CT-Based AC μ-Map Generation
To compare the proposed IPAC method with CT-based AC, the CT images were converted from Hounsfield units (HUs) to LACs (μCT) at 511 keV using the bilinear transformation method described by Burger et al. (26). Gaussian smoothing with a 4-mm kernel was applied to these μ-maps to match the PET spatial resolution. The resulting reference CT μ-maps were rigidly registered to the corresponding IPAC μ-maps inside the MSA void and nonrigidly registered (using Elastix software (27)) outside the void. Nonrigid registration outside the void is desirable because CT and MR images were acquired at different times with the patient’s hip in different positions with respect to the pelvis.
Because of saturation of the HU dynamic range in clinical CT, an incorrect LAC of 0.24 was assigned to the metal implant region when the standard transformation method described in Burger et al. (26) was applied. Additionally, CT μ-maps were reconstructed using the standard reconstruction algorithm implemented in the scanner and therefore presented metal induced artifacts (techniques for the suppression of beam-hardening artifacts (28) were not applied). To limit the effect of these artifacts, the CT μ-map values outside the void but within the body contour and with an LAC of less than 0.085 were set to 0.085 to generate thresholded CT (thCT) μ-maps.
Analysis of Image Quality
The accuracy in estimating the shape of the implant was evaluated by calculation of the DSC of the segmented IPAC μ-map with respect to the segmented thCT reference μ-map. In both μ-maps, every voxel with an LAC of greater than 0.2 cm−1 was considered to be part of the implant class. The accuracy in estimating the LAC of the metal compound was evaluated by calculating the relative mean of the implant LACs and comparing it with the value obtained on the basis of the characteristics of the respective metal implant.
AC factors in sinogram space generated from the IPAC, Dixon, and thCT μ-maps were used to model attenuation during reconstruction with the ordinary Poisson ordered-subset expectation maximization algorithm, and the corresponding PETIPAC, PETthCT, and PETDixon volumes for all subjects were generated. Voxel-based analysis was performed to assess the accuracy of the μ-maps and reconstructed PET images. Only voxels included in the body contour mask were used in these comparisons. Bland–Altman plots, bias, SD, and Pearson coefficients were used to calculate the correlation of the PETIPAC images with respect to the PETthCT and PETDixon images. Absolute relative change (aRC) images were defined as follows: Eq. 4where IX corresponds to either of the PET images, PETDixon or PETIPAC, and Iref corresponds to the reference image PETthCT.
RESULTS
In Figure 1, we present the CT μ-map and IPAC μ-map for the uniform 18F-FDG phantom with a cobalt–chromium alloy implant (Supplemental Fig. 1). The shape of the implant was estimated in great detail using the IPAC algorithm (with conceivably better results than the CT). From Figure 1B, it can be also noted that saturation of the HU dynamic range leads to a truncation of the implant LACs in the CT image, whereas the correct implant LAC was obtained using the proposed method. The corresponding reconstructed PET images corrected with the CT- and IPAC-based AC methods are shown in Supplemental Figure 2.
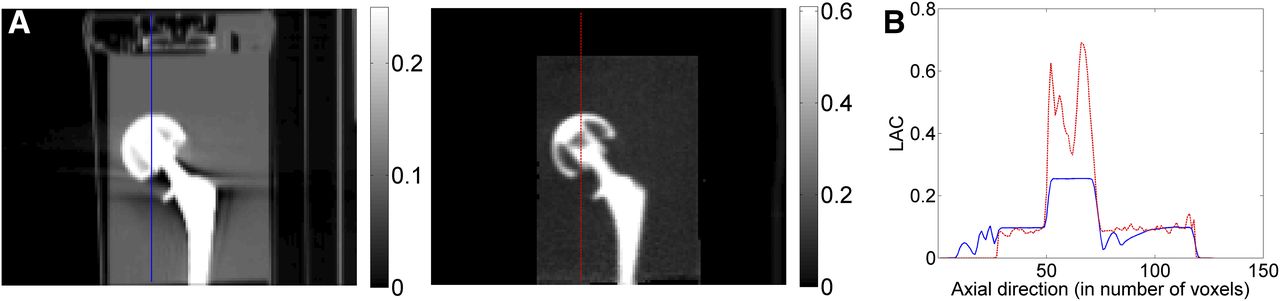
Uniform 18F-FDG phantom with cobalt–chromium alloy implant. (A) CT μ-map (left) and IPAC μ-map (right) are shown. (B) Corresponding LAC profiles are shown (CT μ-map in blue and IPAC μ-map in red).
Representative Dixon, CT, and IPAC μ-maps are shown in Figures 2 and 3 and Supplemental Figures 3 and 4 for patients with right hip cobalt–chromium alloy endoprosthesis (Fig. 2), a titanium spinal pedicle screw implant (Fig. 3), titanium endoprosthesis on both hips (Supplemental Fig. 3), and dental implants (Supplemental Fig. 4). These images demonstrate excellent correspondence between the μIPAC and μCT maps and the obvious misclassification of the tissues within the MSA void in the μDixon map.
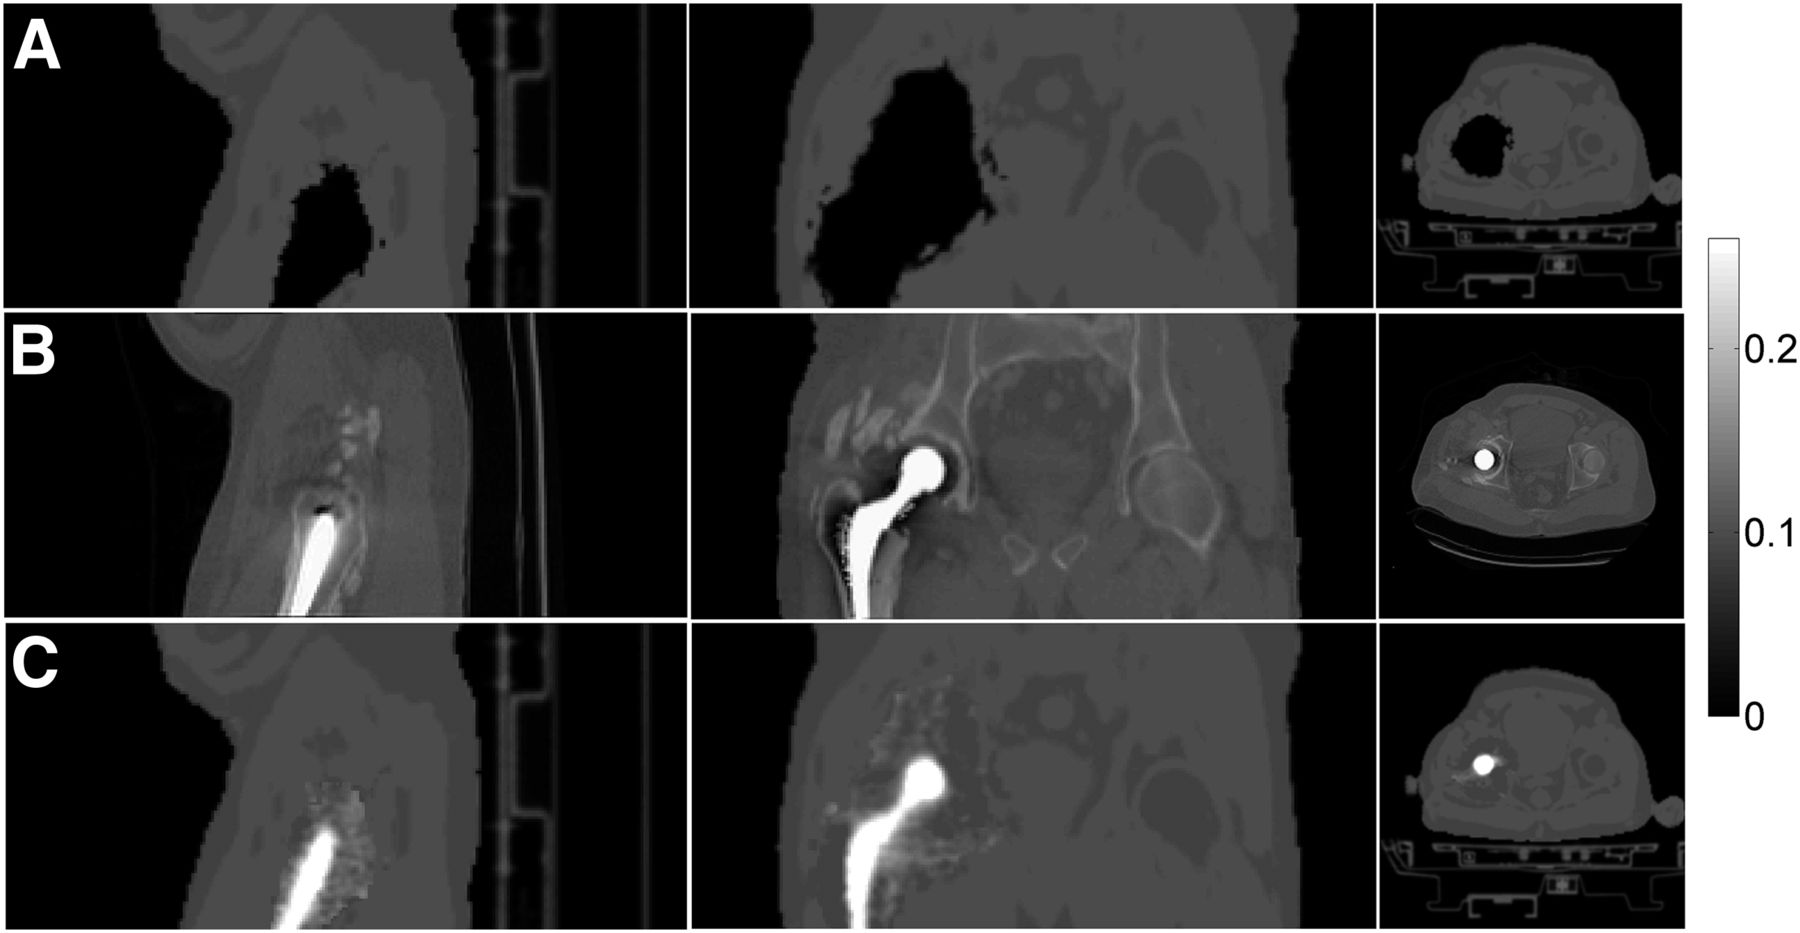
Patient presenting right hip cobalt–chromium alloy endoprosthesis (patient 1). Dixon (A), CT (B), and IPAC (C) μ-maps are shown. The 3 columns show (from left to right) sagittal, coronal, and axial planes.
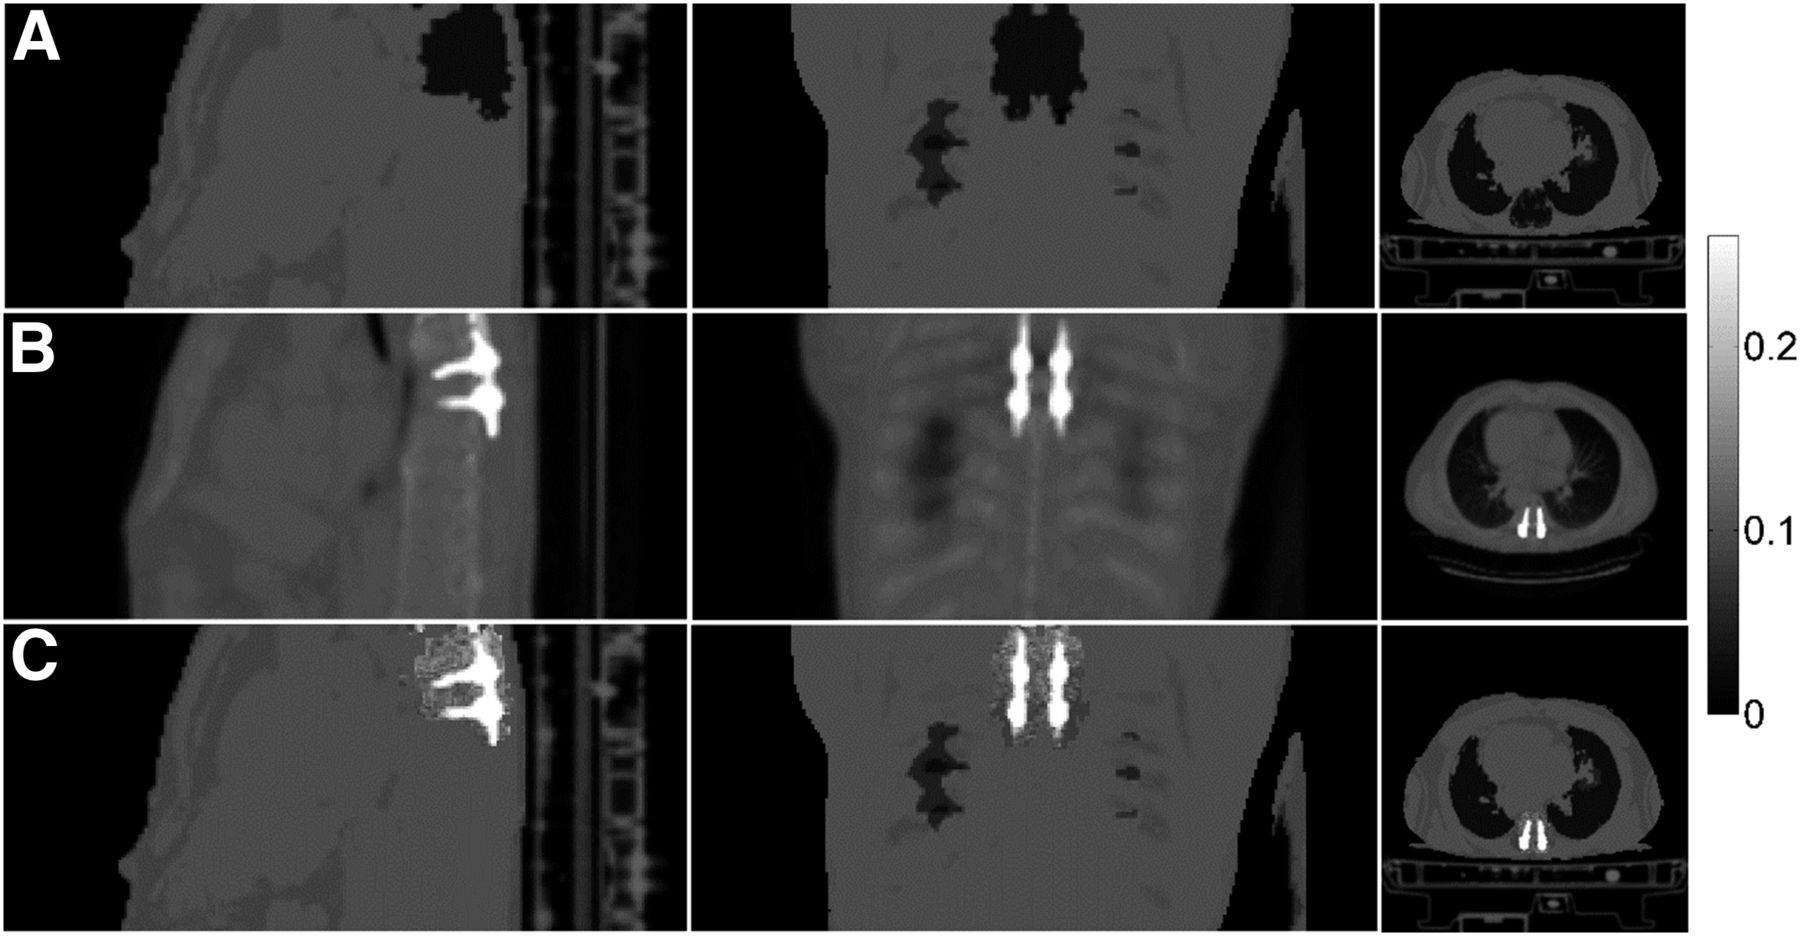
Patient presenting titanium spinal implant and pedicle screws (patient 1B). Dixon (A), CT (B), and IPAC (C) μ-maps are shown. The 3 columns show (from left to right) sagittal, coronal, and axial planes.
The implant LAC means and the DSCs for all 11 test subjects are given in Table 1. The mean LAC percentage error obtained with the IPAC method was 15.7% ± 7.8%, which was significantly smaller than the Dixon- (100%) and CT- (39%) derived values. A mean DSC of 73% ± 9% was obtained when comparing the IPAC- with the CT-derived implant shape. These results suggest that the proposed IPAC algorithm is capable of accurately reconstructing the shape and LAC of a metallic implant.
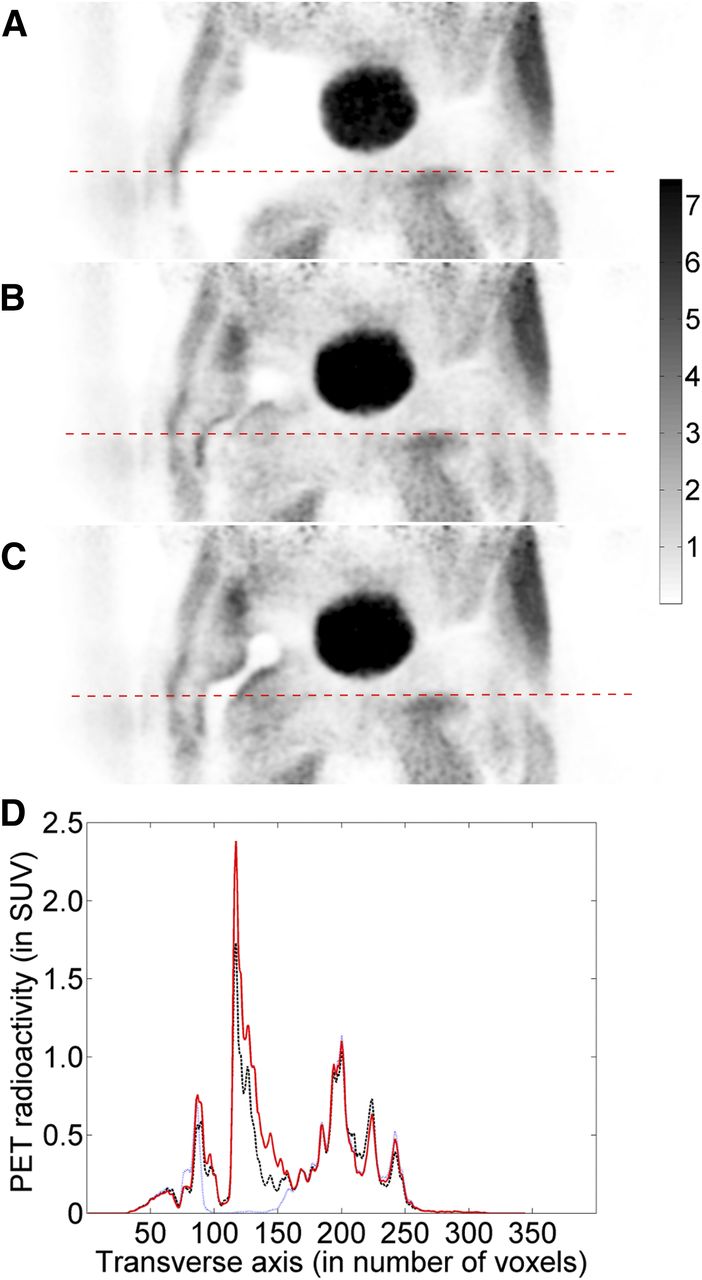
The reconstructed PET images corrected with the 3 AC methods for the subject shown in Figure 2 are presented in Figure 4. As expected, the largest errors occurred in the MSA-void region. The results of the quantitative voxel-based analyses for all the subjects are summarized in Supplemental Table 1. The mean aRC was 13.2% ± 22.1% for the PETIPAC and 23.1% ± 38.4% for the PETDixon across the whole field of view. The mean aRC in the MSA region around the implant was 20.3% ± 23.1% for the PETIPAC and 80.1% ± 27.1% for the PETDixon.

Reconstructed PET images corrected with the 3 AC methods for the validation subject of Figure 2. Dixon (A), thCT (B), and IPAC (C) μ-maps were, respectively, used for AC during reconstruction. (D) Corresponding radioactivity profiles are shown (Dixon in blue, thCT in black, and IPAC in red).
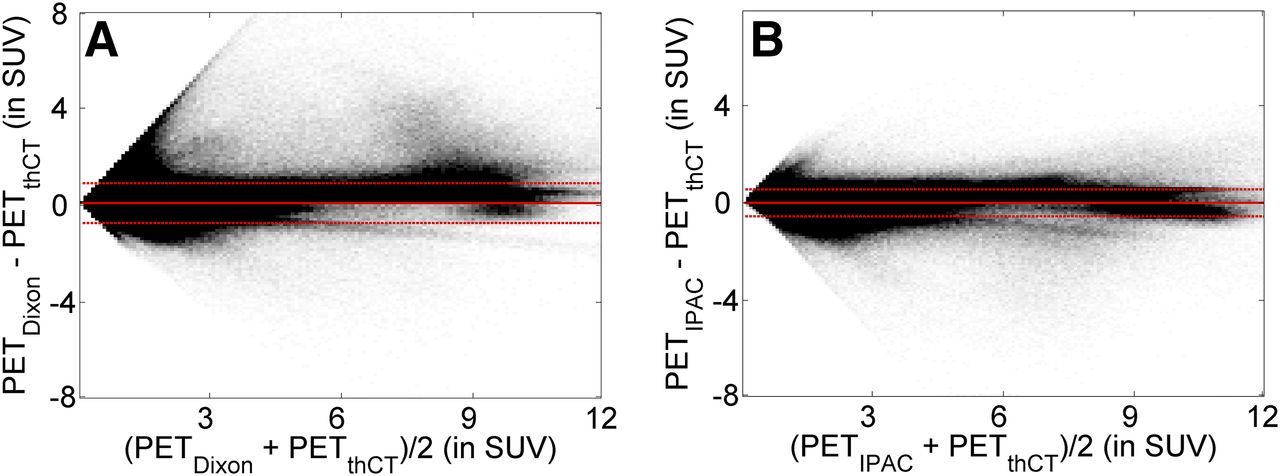
Figure 5 shows the Bland–Altman plots for the voxel-based analyses for all the validation subjects, comparing the PETDixon (Fig. 4A) and the PETIPAC (Fig. 4C) with the PETthCT (Fig. 4B). Pearson correlation coefficients for Figure 5A and Figure 5B, were RIPAC = 0.08 and Rdixon = 0.33, respectively. The mean difference in all voxels, with respect to the PETthCT, was 0.055 ± 0.56 for the PETIPAC and 0.087 ± 0.91 for the PETDixon, demonstrating that the presented method significantly improves PET quantification in the presence of metal implants.

Bland–Altman plots showing voxel-based comparisons (for all validation subjects) between PETDixon/PETthCT (A) and PETIPAC/PETthCT (B). Continuous red lines show mean, and dashed red lines show the of difference.
DISCUSSION
We have presented a method to estimate the location, shape, and LAC of a metallic implant from non-TOF PET emission data to substantially improve the accuracy of the MR-based whole-body μ-map estimation on integrated PET/MR scanners.
Our method relies on the assumptions that the metal implants have zero activity and an LAC higher than that of any body tissue. This establishes a special case in which the estimation of the μ-map directly from the PET emission data is a less ill-posed problem. The proposed IPAC algorithm produces good results in patients presenting metal replacements in one or both hips (Supplemental Fig. 3) and composed of different materials. The method is also capable of reconstructing the shape of smaller metallic implants such as titanium pedicle screws and dental implants (Fig. 3; Supplemental Fig. 4).
Overall, we would expect the performance of the proposed IPAC algorithm to depend on the count statistics of the emission data; the spatial distribution of the radiotracer in the body to support μ-map estimation (which in turn depends on the type of radiotracer); the size of the MSA void, because sufficient information about the LACs is required to obtain a scaled solution (20); and the shape and dimensions of the metal implant. However, assessing the exact contribution of each of these factors was beyond the goal of this proof-of-concept study. Additionally, further investigation is required to assess the robustness of the method in other scenarios. In particular, the data used in this study were acquired approximately 3 h after injection of 18F-FDG whereas clinical whole-body scans are typically obtained 1 h after injection, when the count statistics and contrast-to-noise ratios are different. Moreover, the performances of the IPAC method was not evaluated for radiotracers other than 18F-FDG. Finally, distinguishing between bone and soft tissue in the MSA-void region is not possible with the current implementation.
The IPAC algorithm can be combined with other approaches for addressing the remaining issues in MR-based AC. The initial μ-map outside the void could be generated using an atlas-based method that properly accounts for bone tissue. Additionally, MR metal artifact reduction sequences (29,30) are expected to further improve the initial μ-map inside the void. For example, a slice encoding for metal artifact correction sequence (29) has been proposed for reducing artifacts arising from hip arthroplasty. When multiacquisition variable-resonance image combination (a similar sequence) was used, the overall mean artifact area was reduced by 60% using 3-T MR in patients with hip arthroplasty (30). Although these sequences will not allow the estimation of the exact shape or LACs of the metal implants, they will further aid the joint reconstruction, by minimizing the signal void and providing more accurate information about the tissue surrounding the implants. Alternatively, when the implant material is known so that its LAC can be obtained, the IPAC method could be used to precisely estimate the implant shape and location in the body. We also expect that TOF information, when available, could further improve the accuracy of the IPAC method in distinguishing between bone and soft tissue.
A package containing the necessary software will be included in the Graphics Processing Unit-based Occiput reconstruction toolbox (occiput.io (31)), and its specific implementation for the Biograph mMR will be provided to interested users on request.
CONCLUSION
We have presented an emission-based approach for deriving the location, shape, and LAC of metallic implants from non-TOF PET emission data. The IPAC algorithm can, in principle, be used in any PET/MR scanner. The results presented suggest that our method provides more accurate quantification than previously proposed MR-AC methods in the presence of metal implants, both in terms of the accuracy of the μ-maps and the PET quantification.
DISCLOSURE
Funding for this work was provided by NIH grant 1R01EB014894 and DOE training grant DE-SC0008430. No other potential conflict of interest relevant to this article was reported.
Acknowledgments
We thank Dr. Edward K. Rodriguez from Orthopedic Trauma BIDMC and HMS for providing the hip implant endoprosthesis that was used in the phantom experiment.
Footnotes
Published online Jan. 26, 2017.
- © 2017 by the Society of Nuclear Medicine and Molecular Imaging.
REFERENCES
- Received for publication August 29, 2016.
- Accepted for publication December 26, 2016.


Jump to section
Related Articles
Cited By...
- No citing articles found.