


Abstract
The PET compound 18F-fluoroestradiol (18F-FES) has been developed and tested as an agent for the imaging of estrogen receptor (ER) expression in vivo. 18F-FES uptake has been shown to correlate with ER expression assayed in vitro by radioligand binding; however, immunohistochemistry (IHC) rather than radioligand binding is used most often to measure ER expression in clinical practice. We therefore compared 18F-FES uptake with ER expression assayed in vitro by IHC with both qualitative and semiquantitative measures. Methods: Seventeen patients with primary or metastatic breast cancer were studied with dynamic 18F-FES PET; cancer tissue samples, collected close to the time of imaging, were assayed for ER expression by IHC. For each tumor, partial-volume-corrected measures of 18F-FES uptake were compared with ER expression measured by 3 different ER scoring methods: qualitative scoring (0–3+), the Allred score (0–10), and a computerized IHC index. Results: There was excellent agreement (r = 0.99) between observers using IHC as well as the different methods of measuring ER content (P < 0.001). ER-negative tumors had 18F-FES partial-volume-corrected standardized uptake values of less than 1.0, whereas ER-positive tumors had values above 1.1. Correlation coefficients for the different measures of ER content and the different measures of 18F-FES uptake ranged from 0.57 to 0.73, with the best correlation being between the computerized IHC index and 18F-FES partial-volume-corrected standardized uptake values. Conclusion: Our results showed good agreement between 18F-FES PET and ER expression measured by IHC. 18F-FES imaging may be a useful tool for aiding in the assessment of ER status, especially in patients with multiple tumors or for tumors that are difficult to biopsy.
Breast cancer is the most common nondermatologic cancer and the second leading cause of cancer death in women (1). Advances in the understanding of breast cancer biology have led to the development of a wide array of systemic therapies for patients with breast cancer relapse. One major therapeutic option is hormonal therapy, directed at interrupting the estrogen-based signal that stimulates growth in the majority of breast cancers (2). The level of estrogen receptor (ER) expression in breast cancer has been shown to carry important prognostic information and also to predict the likelihood of a response to hormonal therapy (3–5). ER expression is measured in newly diagnosed breast cancer, as a matter of clinical routine, most commonly by immunohistochemistry (IHC) of fixed tissue (6,7). Comparisons of IHC and the previously used radioligand-binding assay for measuring ER expression have shown the practicality and predictive capability of IHC (6–9), and most centers now use IHC rather than radioligand binding as their routine assay for ER expression.
Studies have shown that PET with 18F-fluoroestradiol (18F-FES) can be used to noninvasively assess regional ER expression (10,11) and has the potential to overcome the sampling errors that arise from disease heterogeneity and that are associated with in vitro assays for cancer. PET can simultaneously measure the in vivo delivery and binding of estrogens and thus ER expression at multiple tumor sites. Earlier studies showed that 18F-FES uptake at a tumor site correlates with ER expression assayed in vitro by radioligand binding (11) and that the level of uptake predicts the likelihood of a response to tamoxifen and aromatase inhibitor treatment (12–14). In this study, we extended this work to compare 18F-FES uptake with ER expression assayed in vitro by IHC, the method currently used for making clinical therapy decisions at most centers (9,15,16). We also report alternate measures of 18F-FES uptake that account for 18F-FES blood clearance to account for rapid 18F-FES metabolism and variable 18F-FES blood levels (17). Our hypotheses were that 18F-FES uptake correlates with ER expression measured in vitro as a semiquantitative index of ER immunostaining and that measures of 18F-FES uptake accounting for blood clearance or metabolism may improve the correlation with in vitro assays of ER expression.
MATERIALS AND METHODS
Seventeen patients (16 women and 1 man) with biopsy-proven or clinically assessed breast cancer were enrolled in the study. All patients with newly diagnosed or recurrent breast cancer and at least one tumor site that had a diameter of 1.5 cm or greater and that had been sampled or was being considered for sampling were eligible for the study. All patients underwent either core needle or surgical biopsy or removal of their tumors close to the time of the 18F-FES PET scan. For patients undergoing surgical biopsy or mastectomy (n = 10), PET was performed before surgery in all but 1 patient to avoid the confounding effects of recent surgery on tracer delivery. In the one exception, there was known extensive residual disease because the patient's surgery was discontinued during an intraoperative consultation. For patients undergoing core needle biopsy, our experience has shown little influence on subsequent PET studies (18,19); therefore, they were allowed in this protocol (n = 7; 6 needle biopsies before the 18F-FES scan (21–2 d before) and 1 needle biopsy the day after the 18F-FES scan). All but 2 patients were not receiving treatment for breast cancer at the time of the PET studies and biopsies. One patient received short-term exposure to an aromatase inhibitor, and one patient had 1 wk of chemotherapy and radiation therapy between the 18F-FES scan and the biopsy. Six patients with earlier tamoxifen use were studied at least 2 mo after discontinuing tamoxifen to avoid receptor-binding antagonism by tamoxifen or tamoxifen metabolites. There was no required minimum time for not receiving therapies not known to bind to the ER or to block estradiol–ER binding. One patient had been on the antiestrogen fulvestrant but had stopped the treatment 2 mo before the 18F-FES scan. One patient had stopped aromatase inhibitor therapy 2 d before the 18F-FES scan. One patient was on hormone replacement therapy up to 1 wk before the 18F-FES scan. All patients met eligibility requirements and signed informed consent forms in accordance with University of Washington human subject guidelines. The protocols were approved by the University of Washington Human Subjects Committee and Radioactive Drug Research Committee.
An additional 21 patients who underwent both tissue sampling and an 18F-FES scan were considered for inclusion. They were excluded from the analysis because the tissue samples were outside the field of view of the 18F-FES study (n = 4), the tumor was too small (<1.5 cm) to accurately quantify with PET (n = 2), no tumors were present in the tissue samples (n = 4), the patients had intervening breast cancer treatment of several weeks or more between the scan and the biopsy (n = 8), the specimens were from lung cancer patients with earlier breast cancer and possible lung metastases (n = 2), or the specimen was a vertebral lesion (n = 1) with too few tumor cells present for a histologic assay of ER expression.
Tissue was sampled from the breast (n = 12), lymph nodes (n = 1), axilla (n = 2), sternum (n = 1), and chest wall (n = 1). The mean tumor size was 3.3 cm (range = 1.5–12 cm).
18F-FES Synthesis and Quality Control
Reagents and solvents for synthesis and purification were obtained from Aldrich Chemical Co. or from U.S. Pharmacopeia–approved suppliers and were used without further purification unless otherwise noted. 18F was produced by use of either a Siemens Eclipse or a Scanditronix MC-50 cyclotron. 18F-FES was prepared according to modifications of published methods (20). A typical injection consisted of approximately 222 MBq of radiopharmaceutical in 20 mL of isotonic phosphate-buffered saline containing less than 15% ethanol by volume.
High-performance liquid chromatography–mass spectrometry analysis [Waters 2690 and MicroMass ZMD (ES−)] was performed immediately after each synthesis to evaluate radiochemical and chemical purities and to measure the mass of 18F-FES in the dose. In all instances, the radiochemical purity was found to be ≥98%. The specific activity was typically greater than 37 × 1012 Bq/mmol at the time of injection. In no instance was more than 5 μg of 18F-FES injected.
PET
All patients were positioned supine and imaged with a GE Healthcare Advance PET scanner. Performance details for the tomograph were previously reported (21,22). Calibration of the PET scanner was routinely done by imaging vials containing a known quantity of 18F assayed in a dose calibrator (model CRC-12; Capintec). The vial images were reconstructed with the same reconstruction parameters as those used in the patient studies to allow cross-calibration of MBq/mL from region-of-interest (ROI) analysis of the images.
Before PET, patients had intravenous catheters placed for radiopharmaceutical injection and for blood sampling. Using short transmission scans, patients were placed in the tomograph in a position to view a known tumor site for which biopsy results were available for comparison. Chest sites were preferred to enable image-based measurement of the arterial blood clearance curve by use of the left ventricular blood pool (23). A 20- to 25-min transmission scan was performed for attenuation correction. 18F-FES at 125.8–233.1 MBq (3.4–6.3 mCi) (average = 196.1 MBq [5.3 mCi]) was infused over 2 min in a volume of 20 mL. Dynamic emission imaging began with the start of infusion and continued for 60 min with the following time bins: 4 × 20 s, 4 × 40 s, 4 × 60 s, 4 × 180 s, and 8 × 300 s. Data obtained at 30–60 min were summed to measure the 18F-FES standardized uptake value (SUV) and to aid in drawing ROIs.
Plasma Processing for Metabolite Analysis
Samples of whole venous blood were collected from patients at 5, 20, and 60 min after injection. The blood was centrifuged at 3,000 rpm for 5 min, and the plasma was withdrawn. The plasma was used for high-performance liquid chromatography metabolite analysis to determine blood radioactivity present as 18F-FES versus labeled metabolites as previously described (17).
PET Image Analysis
ROIs were placed over the central portion of the tumor site by reference to an 18F-FDG PET scan, correlative anatomic imaging (mammogram, ultrasound, or CT), and the PET transmission scan. Square ROIs (1.5 cm in diameter) were placed over the center of the tumor site on 3 adjacent imaging planes by use of 18F-FES and 18F-FDG PET images as guides. We used a similar approach in earlier PET studies as a compromise between partial-volume effects seen with larger regions and the high statistical image noise experienced with smaller regions (18). For patients undergoing core needle biopsy, the site of the biopsy was considered in placing the ROIs. Three adjacent 1.5-cm ROIs were placed over the left ventricle to measure the blood clearance curve. We previously showed that this approach results in a blood clearance curve comparable to that obtained by arterial blood sampling (24).
The estimated uptake of 18F-FES at the tumor site was corrected for partial-volume sampling by use of tumor sizes obtained from the anatomic imaging study (mammogram, ultrasound, or CT) that best depicted the tumor boundaries. As in earlier studies (19), the partial-volume-corrected (PV) uptake was calculated with the following expression: Eq. 1where A′ is the PV uptake, A is the uncorrected tumor uptake, Bck is the background uptake obtained from a contralateral normal tissue ROI, and RC is the recovery coefficient. Recovery coefficients, which are equal to measured divided by true activity concentrations, were obtained from an analysis of hot-sphere phantoms with the same ROIs as those used to obtain tumor time–activity curves (25). Note that in Equation 1, when there was no partial-volume count loss (RC = 1), then A′ = A. This was the case for tumors larger than 2.5 cm. No tumors were close to the liver, in which uptake could affect the background value.
Tumor 18F-FES uptake was quantified by use of 3 different uptake measures: the average SUV of the hottest portion of the tumor (SUV), total flux (fluxtot), and flux corrected for labeled metabolites (fluxcorr). The SUV was calculated by a commonly used formula: Eq. 2where
  is the average tissue uptake at 30–60 min after injection, ID is the injected dose (in MBq), and wt is the patient weight (in kilograms).
The fluxtot measure of 18F-FES uptake, which accounts for variable 18F-FES blood clearance, was defined as follows: Eq. 3where Cb is the blood clearance curve over time. The flux measure has units of mL/min/g and is similar to the SUV but uses the area under the blood clearance curve as an indicator of tracer availability to the tumor instead of injected dose/patient weight (26). We also calculated the flux measure when the blood clearance curve was corrected for labeled metabolites, as previously described (17); this measure (fluxcorr) was defined as follows:
 Eq. 4where CbFES is the blood clearance curve corrected for labeled metabolites over time.
IHC Analysis
Tissue blocks from sections of the 18F-FES-imaged tumors were prepared, sectioned in 4- to 5-μm-thick slices, and placed on glass slides. IHC of tumor samples was performed with monoclonal antibody 1D5 (M 7047/JA/03.03.99; Dako), directed against the ER. All reagents were purchased from Dako, and testing was done by use of a Dako autostainer. All samples were processed in a single batch with a positive control. For each sample, a pathologist, unaware of the 18F-FES results, identified 3 areas on each slide for digital photography and storage. All photomicrographs were recorded with the same magnification and lighting to minimize differences. The results of the immunoassay for ER were qualitatively assessed by a pathologist using a scale from 0 to 3+, with a sample being reported as positive if greater than 5% of the cells in the sample were positively immunostained. If a discrepancy in the score existed between the original pathology report at the time of the surgery and the score determined from the digital photographs (n = 2), then the photographs were reviewed by another pathologist. The samples were also scored by a pathologist using the Allred scoring system, which was recently adopted as the standard method of reporting ER staining at the University of Washington (7,27). Each photomicrograph was evaluated, and the score for the 3 photomicrographs was averaged to produce one value per patient.
In addition, a semiquantitative index of ER staining (IHC index) was calculated by use of a previously described automated image analysis technique and was verified by comparison with a radioligand-binding assay (Photoshop; Adobe Systems) (28,29). In brief, the Photoshop Magic Wand tool was used to identify a representative cell and subsequently cells with a similar intensity. The histogram command was then applied to obtain the mean optical density, which was recorded as the mean value for the tumor. The inverse area was then selected, and the histogram mean density was recorded as the background. The final value recorded was the background minus the mean.
To test the variability of the IHC index, which has not yet been reported, we sent the digitized photographs to 2 independent reviewers for analysis. Each reviewer repeated the procedure 3 times on each of 3 photomicrographs, selecting a different initial cell. The 3 readings on each photomicrograph were averaged, and the averages for the 3 photomicrographs were then averaged to produce one value. The latter values from the reviewers were then averaged to obtain the final quantitative value.
Statistical Analyses
Although partial-volume correction adds complexity to the estimation of 18F-FES uptake, the intent of our study was to validate 18F-FES uptake as a measure of ER expression in comparison with ER expression determined by IHC independent of tumor size. Because of the expected influence of partial volumes for smaller tumors, partial-volume corrections were necessary to accurately measure 18F-FES uptake. Therefore, only PV 18F-FES uptake values were compared with the ER expression results. The measures of 18F-FES uptake (PV SUV [PVSUV], PV fluxtot [PVFES fluxtot], and PV fluxcorr [PVFES fluxcorr]) were compared with the measures of ER expression (qualitative ER scoring, Allred scoring, and IHC), and the results were reported by use of Spearman correlation coefficients (ρ). The correlation between 18F-FES uptake and the semiquantitative IHC index was also evaluated by use of a linear bivariate fit.
RESULTS
Patient Characteristics
The average age of the 17 patients was 55 y (range=39–79 y). Eleven patients (65%) were postmenopausal. Six patients (35%) had estradiol levels below the detectable level of 20 pg/mL. The average estradiol level for the remaining 11 patients was 63 pg/mL (range = 26–149 pg/mL). Eight patients (47%) had no therapy before the 18F-FES scan. Two patients (12%) had previously received chemotherapy and radiation therapy. The remaining 7 patients (41%) each had previously received one of the following therapies: tamoxifen alone; chemotherapy alone; radiation therapy and tamoxifen; chemotherapy, radiation therapy, and tamoxifen; chemotherapy, tamoxifen, and an aromatase inhibitor; radiation therapy, tamoxifen, and an aromatase inhibitor; or chemotherapy, radiation therapy, tamoxifen, and an aromatase inhibitor.
Two patients had short-term exposure to antitumor agents before the 18F-FES scan and biopsy. One patient began aromatase inhibitor treatment less than 1 mo before the 18F-FES scan and biopsy. One patient received several doses of oral cyclophosphamide and 1 wk of fractionated radiation between the 18F-FES scan and surgery.
Blood was collected from all but one patient, for whom PVFES fluxcorr therefore could not be calculated. Thus, data from 16 patients were included in the PVFES fluxcorr analyses, and data from 17 patients were included in all of the other analyses.
IHC Index Observer Variability
Our analysis of the interobserver variability of the IHC index showed excellent agreement between the 2 observers who used the automated analysis to calculate ER uptake measured by IHC, as shown in Figure 1. The r value was 0.99 (P < 0.001), and the average difference between observers was one percentage point (coefficient of variation = 6%).

Interobserver variability of IHC index determined by Photoshop analysis. Line of identity is also shown. Average difference between observers was 1%. Linear correlation was 0.99. Treated patients are identified by closed circles.
Comparison of ER Analysis Methods
There was good agreement among all in vitro measures of estrogen content, as shown in Figure 2. The rank correlation coefficients were 0.74 (P < 0.001) when qualitative ER uptake (ER positive, 1+ to 3+ immunostaining, vs. ER negative) was compared with the Allred scores (Fig. 2A) and 0.73 (P < 0.001) when it was compared with the IHC index (Fig. 2B). For 3 patients, qualitative ER uptake and the Allred scores were both 0. The correlation coefficient for the Allred scores and the IHC index was 0.81 (P < 0.001) (Fig. 2C).
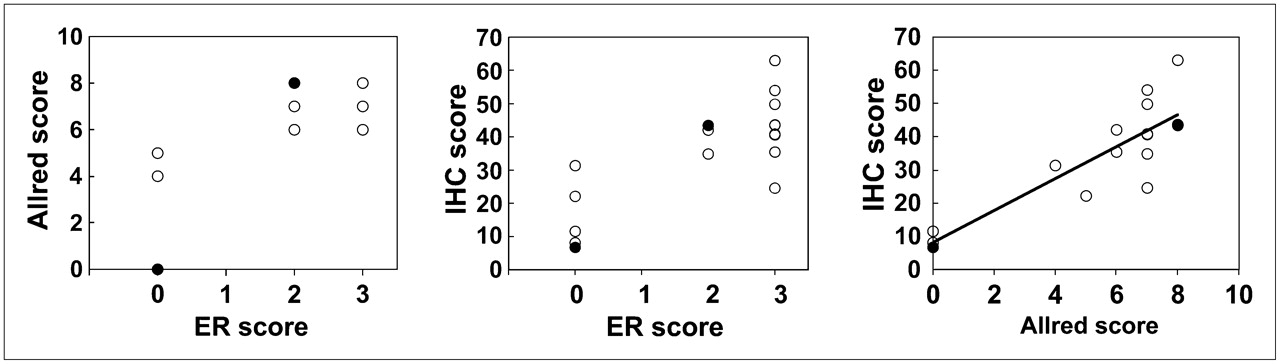
Comparison of qualitative and semiquantitative measures of ER content by IHC of biopsy material. Left and center graphs compare qualitative ER scoring with Allred scoring and IHC index (Photoshop analysis). Treated patients are identified by closed circles.
18F-FES Uptake Values and Comparison with IHC Results
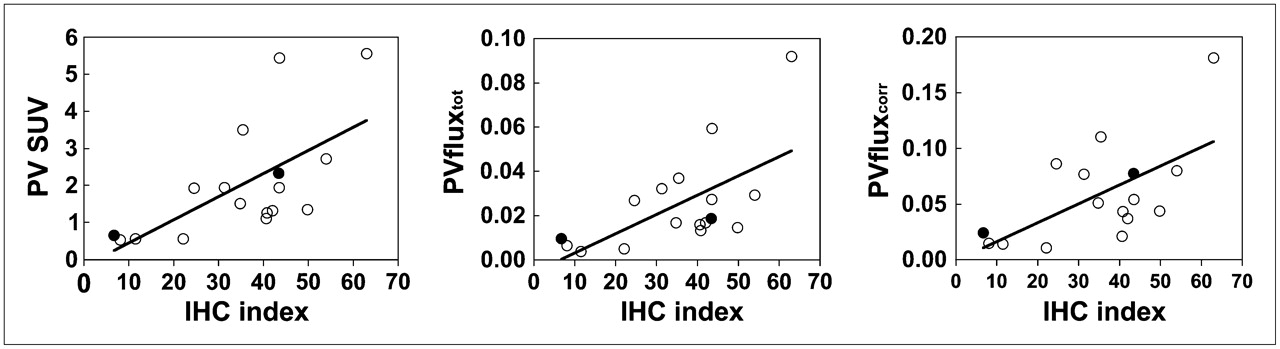
The mean SUV for the 17 patients included in the present study was 1.3 (range = 0.54–5.4). When the SUVs were corrected for partial-volume sampling, the mean value changed to 2.0 (range = 0.54–5.6). The means (ranges) for flux measures were as follows: fluxtot, 0.016 mL/min/g (0.004–0.059); and PVFES fluxtot, 0.025 mL/min/g (0.004–0.092). For the 16 patients whose data were used for metabolite analysis, the mean (range) fluxcorr was 0.035 mL/min/g (0.010–0.067), and the mean (range) PVFES fluxcorr was 0.058 mL/min/g (0.011–0.18).
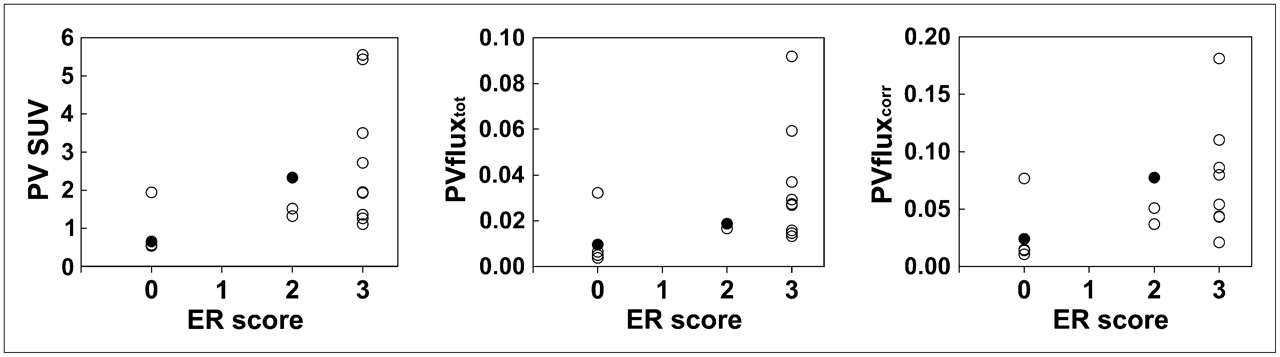
18F-FES uptake measures were compared with qualitative ER uptake measured by IHC (Fig. 3). For 18F-FES uptake versus qualitative IHC results, ρ = 0.62 (P = 0.009) for PVSUV, ρ = 0.57 (P = 0.02) for PVFES fluxtot, and ρ = 0.60 (P = 0.01) for PVFES fluxcorr. For non–PV SUVs versus qualitative IHC results, ρ = 0.52 (P = 0.03). IHC indicated that 5 patients had ER-negative tumors and 12 patients had ER-positive tumors (3 with 2+ immunostaining and 9 with 3+ immunostaining); no patient in the series had 1+ immunostaining. With the exception of one patient, all patients with ER-negative tumors had PVSUVs of less than 1.0, whereas patients with ER-positive tumors had values above 1.1. When an SUV of 1.1 was used to discriminate ER-positive and ER-negative tumors, there was 94% agreement (16/17 patients) for 18F-FES uptake versus IHC results.

Comparison of 18F-FES uptake measures (PVSUV, PVFES fluxtot, and PVFES fluxcorr) with qualitative IHC results (ER expression scored as 0–3+). Treated patients are identified by closed circles.
A single patient had an ER-negative core biopsy of the breast and a PVSUV above 1.1 (1.9). The original pathology report from her surgery indicated 3+ immunostaining for ER expression analyzed by IHC and a high degree of heterogeneity. The results suggested that the portion of the tissue that was sampled for the present study was in a section of the tumor with a lower level of ER expression.
Similar plots were seen for PVFES fluxtot, with ER-negative tumors having values of less than 0.01 mL/min/g (Fig. 3B), and for PVFES fluxcorr, with ER-negative tumors having values of less than 0.02 mL/min/g (Fig. 3C); again, the exception was the same patient with a higher SUV.
A patient found to be ER positive by IHC had a PVSUV of 1.1 and low PVFES fluxtot and PVFES fluxcorr values, 0.016 and 0.021 mL/min/g, respectively. Her tumor had a qualitative ER score of 3+ and an Allred score of 7. This patient had stopped hormone replacement medication approximately 1 wk before her 18F-FES scan. Her estradiol level was normal, at 28 pg/mL, at the time of the 18F-FES scan. Although her hormone replacement medication may have competed with 18F-FES uptake, this possibility is considered unlikely given the relatively low level of plasma estradiol at the time of scanning. The difference between 18F-FES PET results and in vitro assay results more likely reflects a difference between immune recognition (IHC) and functional binding, which has been reported for in vitro assays (7,30,31).
18F-FES uptake and semiquantitative Allred scores were compared as shown in Figure 4. The ρ values for 18F-FES uptake versus Allred scores (PVSUV, PVFES fluxtot, and PVFES fluxcorr) were 0.72 (P = 0.001), 0.61 (P = 0.01), and 0.60 (P = 0.01), respectively. For non–PV SUVs versus Allred scores, ρ = 0.65 (P = 0.005).
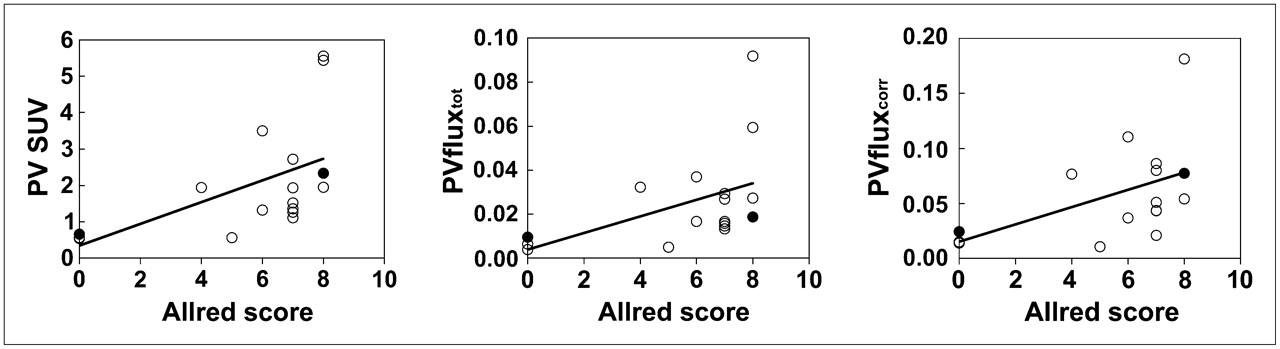
Comparison of 18F-FES uptake measures with Allred scores. Treated patients are identified by closed circles.
All 3 PV 18F-FES uptake measures showed significant correlations with the semiquantitative IHC index (Figs. 5A–5C). As determined by Spearman analysis, ρ = 0.73 (P < 0.001) for PVSUV, ρ = 0.63 (P = 0.007) for PVFES fluxtot, and ρ = 0.57 (P = 0.02) for PVFES fluxcorr. Correlation coefficients were not significantly different for the 3 measures when a linear bivariate fit was used: r = 0.64 for PVSUV, r = 0.63 for PVFES fluxtot, and r = 0.62 for PVFES fluxcorr. P values were 0.005 for PVSUV, 0.007 for PVFES fluxtot, and 0.01 for PVFES fluxcorr. For non–PV SUVs versus the IHC index, r = 0.35 (P = 0.17).

Comparison of 18F-FES uptake measures with IHC index (Photoshop analysis). Treated patients are identified by closed circles.
Excluding both the patient who had been on hormone replacement medication and the patient who had heterogeneous 18F-FES uptake from the analysis resulted in slightly higher correlation coefficients. In the Allred score analysis, the Spearman correlation coefficients increased to 0.79 (P < 0.001), 0.75 (P = 0.001), and 0.72 (P = 0.004) for PVSUV, PVFES fluxtot, and PVFES fluxcorr, respectively. In the IHC index analysis, the coefficients increased to 0.76 (P < 0.001), 0.73 (P = 0.002), and 0.64 (P = 0.01) for PVSUV, PVFES fluxtot, and PVFES fluxcorr, respectively. Excluding these patients from the qualitative ER uptake and 18F-FES uptake analysis increased the Spearman correlation coefficients to 0.76 (P = 0.001), 0.78 P < 0.001), and 0.80 (P < 0.001) for PVSUV, PVFES fluxtot, and PVFES fluxcorr, respectively. The results shown in Figures 1–5⇑⇑⇑⇑ include all patients.
To examine the possible influence of short-term exposure to noninterfering breast cancer therapy, we excluded the 2 patients with short-term exposure to either aromatase inhibitors or chemotherapy and radiation therapy at the time of the 18F-FES PET scan and biopsy. Correlations between 18F-FES uptake and IHC remained in this subset of patients (n = 15): for PVSUV versus qualitative IHC, ρ = 0.60 (P = 0.02); for PVSUV versus Allred scores, ρ = 0.66 (P = 0.007); and for PVSUV versus the IHC index, ρ = 0.68 (P = 0.006).
DISCUSSION
The purpose of the present study was to compare 18F-FES uptake with ER expression assayed in vitro by IHC with both qualitative and semiquantitative measures, complementing earlier studies (11) comparing 18F-FES uptake with radioligand binding.
Three different methods of measuring ER expression by IHC were available on the same tissue slides for comparison with 18F-FES uptake. Initial ER scoring was a qualitative assessment of the slides, and they were given scores of 0–3+ on the basis of the intensity of the nuclear staining. In clinical practice, a score of 1+ or higher is taken to indicate a tumor that may be sensitive to endocrine therapy (8). We also used a commonly known method of semiquantitative evaluation, the Allred method, which includes an 8-point scoring system based on the intensity and percentage of positively stained cells on a slide (7,27). To take advantage of the quantitative nature of PET data with which the IHC results were compared, we applied a semiquantitative computerized analysis method (Photoshop) that we have used before (28). Although this method is not routinely used to assess ER expression in clinical practice, its reproducibility was excellent. The results of similar computerized analyses were previously tested and compared with the results of in vitro radioligand-binding assays for ER expression (32,33), like the method that we used (28). All methods of scoring ER expression by IHC correlated well with each other, as expected.
In 1988 (11), Mintun et al. reported good correlations between 18F-FES uptake and in vitro ER concentrations determined by radioligand binding. In 1995, Dehdashti et al. (34) compared the separation of ER-positive and ER-negative cancers with 18F-FES uptake in tumors and reported an overall agreement of 88%. There has been a shift in clinical practice from using radioligand binding to using IHC for routine ER content analysis of breast cancers (15). Several studies included comparisons of in vitro radioligand-binding assays for ER expression with IHC assays for ER expression (7,16,33,35). These studies showed that the agreement between the 2 methods ranged from 86% to 98%. Our rate of agreement between the 18F-FES uptake and IHC methods fell in this range.
In our earlier study comparing in vitro radioligand-binding assays and the IHC index, we found a linear correlation (r) of 0.70 (28). Other studies including quantitative comparisons of radioligand-binding assays and IHC found similar IHC indices (30,31,36–38). The correlation (ρ) between 18F-FES uptake and the IHC index that we found in the present study, 0.73 (linear correlation [r] of 0.64), fell in the range of values reported in earlier studies comparing in vitro assays.
Our correlations, however, were lower than the correlation reported by Mintun et al. (11), r = 0.96. Several factors could account for the differences in the results. There was a more uniform distribution of ER expression in the in vitro assays in our study than in the study of Mintun et al. (11); this difference could have altered the apparent correlation between the imaging and in vitro results. In addition, in the earlier study, in vivo radioligand binding (18F-FES) was compared with in vitro radioligand binding; however, in the present study, in vivo radioligand binding was compared with the presence of ER epitopes determined by in vitro IHC. We would expect a lower correlation for our present study (18F-FES uptake versus in vitro IHC) than for the study of Mintun et al. (11) (18F-FES uptake versus in vitro radioligand binding), in accordance with studies comparing in vitro radioligand-binding assays and in vitro IHC assays (27,30,31). Given the differences in sampling and quantification for in vivo imaging versus in vitro assays, we would not necessarily expect a perfect correlation in any instance. Importantly, in vivo measurement of ER expression by 18F-FES PET appeared to add predictive capability for the response to endocrine therapy, even in patients whose tumors were shown to express ER in in vitro assays (12–14).
We compared different measures of 18F-FES uptake and ER concentrations, including PVFES fluxtot and PVFES fluxcorr. In the present analysis, in distinction to our earlier, preliminary analysis (18,39), the flux measures did not have a clear advantage over the simple SUV measure of 18F-FES uptake. However, in studies of patients treated with agents that could alter estrogen levels or 18F-FES clearance rates, the flux measures may be important to consider.
We identified a PVSUV threshold of 1.1 for distinguishing tumors determined to be ER positive and ER negative by IHC. Our earlier studies (14) and others (13) suggested that an 18F-FES SUV of 1.5–2.0 (or greater) is predictive of a response to endocrine therapy. The IHC threshold for ER positivity is staining in 5% of nuclei or more. Other researchers, for example, Ogawa et al. (40), indicated that 10% staining may be an acceptable cutoff for predicting a response to endocrine therapy. Taken together, these results suggest that the quantitative threshold for the determination of endocrine responsiveness by 18F-FES PET may be slightly higher than the threshold for correlation with standard IHC criteria for ER positivity.
There are inherent difficulties in comparing in vitro and in vivo parameters, including the size of the tissue sample. ER distribution may be heterogeneous throughout a lesion, and a tissue sample may not be representative of the entire lesion. This was likely the case with one of the outliers in the present study; for this patient, the initial ER status, determined from her surgery, was scored as 3+, but the slides subsequently made for analysis were scored as ER negative.
We are unable to conclusively explain an outlier with low 18F-FES uptake in the group of patients found to have ER-positive tumors by IHC; this finding may simply reflect inherent differences between radioligand-binding assays for ER (18F-FES PET) and immunorecognition (IHC).
The present study has several limitations. Although the sample size (n = 17) is the largest used to date to compare 18F-FES uptake with in vitro IHC analysis of ER expression, the patient population is still small. Additional samples would likely increase the significance of the correlation of quantitative measures of ER expression with 18F-FES uptake.
The patient population was heterogeneous, with both male and female patients, newly diagnosed and recurrent breast cancers, a variety of types of previous therapy, tissue samples from different tumor sites, and 18F-FES studies done at various intervals from the time of tissue sampling. Two patients had short-term exposure to agents with activity against breast cancer but not known to block estradiol binding to ER. This exposure did not appear to affect the correlation of 18F-FES uptake with IHC of the biopsy material; however, this feature was not rigorously tested.
The need for partial-volume correction of 18F-FES uptake in smaller tumors is another limitation of the present study. Although recovery coefficients are necessary to account for the loss of signal attributable to finite spatial resolution, this correction is an approximate one based on an imperfect estimate of tumor size and likely adds variability to the 18F-FES uptake measures.
Despite these potentially confounding factors, the correlation between 18F-FES uptake and ER expression remained significant and at the expected level.
CONCLUSION
18F-FES uptake correlated well with both qualitative and semiquantitative IHC measures of ER expression in biopsy material, suggesting that 18F-FES uptake is a good indicator of regional ER expression in breast cancer when compared with the accepted clinical standard assay for ER expression, IHC. 18F-FES imaging cannot replace the use of in vitro ER measures, but it may be a useful tool for assessing the ER status of a patient's entire tumor burden, including metastatic sites or tumors that are difficult to biopsy. Future studies should examine the influence of hormonal therapy on 18F-FES uptake and the response to therapy.
Acknowledgments
The authors would like to thank Drs. Hannah Linden, Julie Gralow, and Robert Livingston for their help in referring patients to our study. The authors also thank the personnel at the University of Washington Radiology Department and PET Imaging Facility for technical support; the Seattle Cancer Care Alliance Breast Cancer Specialty Clinic for help with patient referrals; the personnel at Phenopath Laboratory (Hadi Yazigi, Marilyn Skelly, and Lynn Goldstein) for help with tissue specimens; and Brenda Kurland and Mark Muzi for helpful comments. This work was supported by NIH grants P01CA42045, R01CA72064, and S10 RR17229.
Footnotes
-
COPYRIGHT © 2008 by the Society of Nuclear Medicine, Inc.
References
- Received for publication September 21, 2007.
- Accepted for publication December 4, 2007.


Jump to section
Related Articles
Cited By...
- Kinetic Analysis and Metabolism of Poly(Adenosine Diphosphate-Ribose) Polymerase-1-Targeted 18F-Fluorthanatrace PET in Breast Cancer
- Summary: Appropriate Use Criteria for Estrogen Receptor-Targeted PET Imaging with 16{alpha}-18F-Fluoro-17{beta}-Fluoroestradiol
- Principles of Tracer Kinetic Analysis in Oncology, Part I: Principles and Overview of Methodology
- Kinetic and Static Analysis of Poly-(Adenosine Diphosphate-Ribose) Polymerase-1-Targeted 18F-Fluorthanatrace PET Images of Ovarian Cancer
- 18F-Fluoroestradiol PET Imaging in a Phase II Trial of Vorinostat to Restore Endocrine Sensitivity in ER+/HER2- Metastatic Breast Cancer
- Breast Cancer: Evaluating Tumor Estrogen Receptor Status with Molecular Imaging to Increase Response to Therapy and Improve Patient Outcomes
- Initial Studies with 11C-Vorozole PET Detect Overexpression of Intratumoral Aromatase in Breast Cancer
- Breast Cancer 18F-ISO-1 Uptake as a Marker of Proliferation Status
- 18F-FES PET/CT Influences the Staging and Management of Patients with Newly Diagnosed Estrogen Receptor-Positive Breast Cancer: A Retrospective Comparative Study with 18F-FDG PET/CT
- 18F-Fluoroestradiol PET Imaging of Activating Estrogen Receptor-{alpha} Mutations in Breast Cancer
- 18F-Fluoroestradiol Tumor Uptake Is Heterogeneous and Influenced by Site of Metastasis in Breast Cancer Patients
- Molecular Imaging in Cancer Drug Development
- Improved Estrogen Receptor Assessment by PET Using the Novel Radiotracer 18F-4FMFES in Estrogen Receptor-Positive Breast Cancer Patients: An Ongoing Phase II Clinical Trial
- 18F-Fluoroestradiol PET/CT Measurement of Estrogen Receptor Suppression during a Phase I Trial of the Novel Estrogen Receptor-Targeted Therapeutic GDC-0810: Using an Imaging Biomarker to Guide Drug Dosage in Subsequent Trials
- A Randomized Feasibility Study of 18F-Fluoroestradiol PET to Predict Pathologic Response to Neoadjuvant Therapy in Estrogen Receptor-Rich Postmenopausal Breast Cancer
- Functional Estrogen Receptor Imaging Before Neoadjuvant Therapy for Primary Breast Cancer
- Estrogen Receptor Binding (18F-FES PET) and Glycolytic Activity (18F-FDG PET) Predict Progression-Free Survival on Endocrine Therapy in Patients with ER+ Breast Cancer
- 18F-Fluoroestradiol PET: Current Status and Potential Future Clinical Applications
- Molecular Imaging of Biomarkers in Breast Cancer
- Translation of New Molecular Imaging Approaches to the Clinical Setting: Bridging the Gap to Implementation
- Imaging Diagnostic and Therapeutic Targets: Steroid Receptors in Breast Cancer
- Temporal Heterogeneity of Estrogen Receptor Expression in Bone-Dominant Breast Cancer: 18F-Fluoroestradiol PET Imaging Shows Return of ER Expression
- Pharmacodynamic Imaging Guides Dosing of a Selective Estrogen Receptor Degrader
- Assessment of Estrogen Receptor Expression in Epithelial Ovarian Cancer Patients Using 16{alpha}-18F-Fluoro-17{beta}-Estradiol PET/CT
- Feasibility and Predictability of Perioperative PET and Estrogen Receptor Ligand in Patients with Invasive Breast Cancer
- 18F-FES and 18F-FDG PET for Differential Diagnosis and Quantitative Evaluation of Mesenchymal Uterine Tumors: Correlation with Immunohistochemical Analysis
- Small-Animal PET of Steroid Hormone Receptors Predicts Tumor Response to Endocrine Therapy Using a Preclinical Model of Breast Cancer
- PET Imaging of Estrogen Receptors as a Diagnostic Tool for Breast Cancer Patients Presenting with a Clinical Dilemma
- Fluoroestradiol Positron Emission Tomography Reveals Differences in Pharmacodynamics of Aromatase Inhibitors, Tamoxifen, and Fulvestrant in Patients with Metastatic Breast Cancer
- Novel insights on imaging sex hormone-dependent tumourigenesis in vivo
- Breast Cancer and Hormonal Stimulation: Is Glycolysis the First Sign of Response?
- Cancer-focused Molecular Imaging
- 18F-FDG PET of Locally Invasive Breast Cancer and Association of Estrogen Receptor Status with Standardized Uptake Value: Microarray and Immunohistochemical Analysis
- Imaging Tumor Phenotype: 1 Plus 1 Is More Than 2
- Molecular Imaging: 18F-FDG PET and a Whole Lot More
- The Role of Radiotracer Imaging in the Diagnosis and Management of Patients with Breast Cancer: Part 2--Response to Therapy, Other Indications, and Future Directions
- Radiopharmaceuticals in Preclinical and Clinical Development for Monitoring of Therapy with PET
- Noninvasive prediction of tumor responses to gemcitabine using positron emission tomography
- Assessment of Human Biodistribution and Dosimetry of 4-Fluoro-11{beta}-Methoxy-16{alpha}-18F-Fluoroestradiol Using Serial Whole-Body PET/CT
- Tumor Receptor Imaging