


Abstract
Development of new oncology drugs has increased since the improved understanding of cancer’s complex biology. The oncology field has become the top therapeutic research area for new drugs. However, only a limited number of drugs entering clinical trials will be approved for use as the standard of care for cancer patients. Molecular imaging is increasingly perceived as a tool to support go/no-go decisions early during drug development. It encompasses a wide range of techniques that include radiolabeling a compound of interest followed by visualization with SPECT or PET. Radiolabeling can be performed using a variety of radionuclides, which are preferably matched to the compound on the basis of size and half-life. Imaging can provide information on drug behavior in vivo, whole-body drug target visualization, and heterogeneity in drug target expression. This review focuses on current applications of molecular imaging in the development of small molecules, antibodies, and antihormonal anticancer drugs.
NOTEWORTHY
In oncology there is by far the highest number of new drugs in development trajectories.
Molecular imaging can give information about whole-body drug target presence, whole-body drug distribution, pharmacokinetic features, and pharmacodynamic effects.
For molecular imaging with SPECT and PET, radionuclides with different half-lives are available, allowing appropriate matching to serum half-life of the drug of interest to be labeled.
In oncology there is by far the highest number of new drugs in development trajectories (1). These include more than 800 medicines and vaccines for cancer, with over 240 immunooncology drugs (2,3). Illustratively, in 2016, 20 drugs targeting programmed death 1 or programmed death ligand 1 were being studied in 803 registered clinical trials with slots for 166,736 patients (4).
Unfortunately, numerous drugs fail to get clinical approval. Only around 12% of the compounds entering the clinical trial phase make it to regulatory submission (5). These often-late failures have made drug discovery extremely expensive. Sums of over $2 billion per single drug approval have been named (5), although recent estimations suggest a median cost of about $648.0 million, with a median revenue after approval of $1,658.4 million (6). Typically, a new drug is explored in 3 phases: namely, phase 1 to determine a safe dose and side effects, phase 2 to measure antitumor effect, and a randomized phase 3 study to define its effect compared with standard treatment.
To improve and streamline cancer drug development, the “3 pillars of survival” (7), and more recently the pharmacological audit trail, were proposed (8). This trail consists of a set of key questions to be asked during discovery and development, covering aspects such as population identification, pharmacokinetics, pharmacodynamics, and combination therapy (8). Molecular imaging can give additional information about, for example, target validation; tumor targeting; whole-body target expression, including the currently more appreciated heterogeneity; whole-body drug distribution; pharmacokinetic features such as central nervous system (CNS) penetration; and pharmacodynamic effects (Fig. 1).
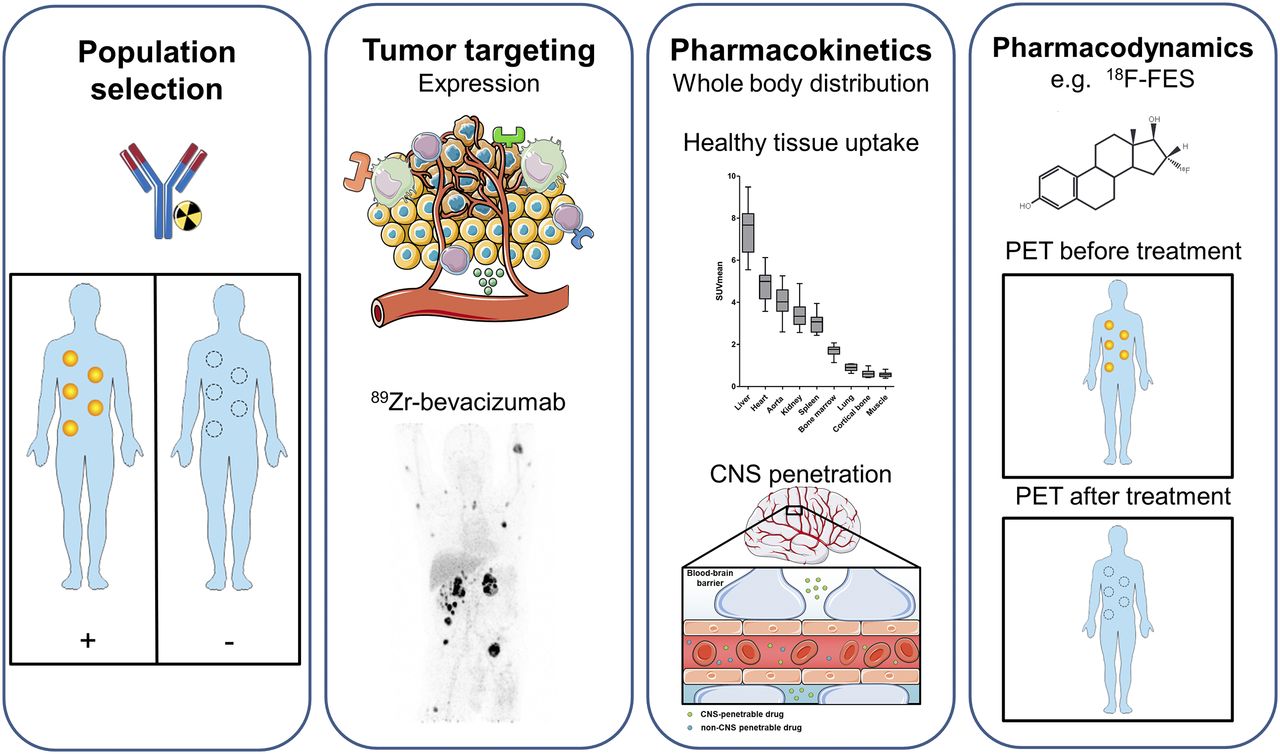
Information that can be extracted using molecular imaging, categorized by population selection, tumor targeting, pharmacokinetics, and pharmacodynamics (7,8). (First panel) Molecular imaging with, for instance, radiolabeled antibodies can potentially identify responders and nonresponders. (Second panel) For tumor targeting, several tumor aspects can be visualized with molecular imaging, such as tumor cell receptors, environmental factors, and immune cells. Example is PET visualization of 89Zr-bevacizumab targeting vascular endothelial growth factor A in tumor microenvironment in patient with metastatic renal cell carcinoma (bottom; adapted from (60)). (Third panel) For pharmacokinetics, molecular imaging can provide information about whole-body distribution, normal-tissue accumulation of, for instance, 89Zr-bevacizumab (top; adapted from (60)), and penetration of CNS (bottom). Data on normal-tissue uptake might explain drug behavior. (Fourth panel) Pharmacodynamic information can be obtained by performing PET before and after treatment. Example is use of 18F-FES for tumor uptake per lesion on antiestrogen therapy, resulting in less uptake. By this pharmacodynamic assessment, therapeutic dose with maximal decrease in tracer uptake can support further clinical studies. This figure was prepared using template on Servier medical art website (https://smart.servier.com/).
Initially, generic PET tracers such as 18F-FDG for glucose metabolism and 18F-labeled 3′-deoxy-3′fluorothymidine for proliferation were used in cancer drug development. After a general introduction on imaging modalities, this review addresses more specific tracers, with emphasis on radiolabeled drugs for small-molecule drugs, monoclonal antibodies (mAbs), and antihormonal anticancer drugs.
SEARCH STRATEGY
We searched the English literature in PubMed, the Dutch trial registry, and the EudraCT and ClinicalTrials.gov databases. The abstracts of annual meetings from 2015 until the present of the American Society of Clinical Oncology, American Association of Cancer Research, European Society of Medical Oncology, and San Antonio Breast Cancer Symposium were additionally screened. The search strategy focused on molecular imaging in the context of target expression, pharmacokinetics, and pharmacodynamics in cancer. Reference lists of articles and citing articles were manually searched for relevance.
GENERAL INTRODUCTION TO IMAGING MODALITIES
Different molecular imaging modalities can be used to support drug development. These include SPECT, PET, MRI, and optical imaging using fluorescence or bioluminescence. SPECT and PET are the most commonly used techniques, of which PET provides better resolution and quantification. For SPECT and PET imaging, different radionuclides are used. Smaller compounds and peptides tend to be labeled with 99mTc for SPECT and 11C, 68Ga, or 18F for PET, with half-lives of 360, 20, 68, and 110 min, respectively. Larger molecules such as mAbs can be efficiently labeled with a wider range of SPECT and PET radionuclides. These include 123I and 111In for SPECT and 64Cu, 124I, 86Y, and 89Zr for PET. Considering the different half-lives of these radionuclides, ranging from 12.7 h for 64Cu to 100.3 h for 124I, a radionuclide can be matched to the large molecule of interest on the basis of serum half-life. 89Zr has a half-life of 78.4 h, which matches the half-life of most full-sized mAbs and residualizes on internalization, making it an attractive radionuclide for mAb imaging. For fluorescent labeling, near-infrared fluorescent dyes such as IRDye800CW are of increasing interest and already clinically applied.
An interesting concept for clinical evaluation of tracers for first-in-human trials is microdosing (9). A microdose is defined as a molecule dose of less than 100 μg, or lower than 1/100 of the pharmacologically active dose. For larger molecules such as proteins, a molar limit of 30 nmol is applied. Given limited drug exposure, less extensive toxicity data are required. These so-called phase 0 trials with few participants can provide preliminary information about drug pharmacokinetics and thus support drug development in early go/no-go decision making. Information from microdose studies can be translated to therapeutic doses only with dose-linear pharmacokinetics. As biologics often display non-linear pharmacokinetics, extrapolation from microdose to therapeutic dose is less reliable. Remarkably few studies using tracer microdosing in drug development have been published, but there may well be underreporting.
MOLECULAR IMAGING USING SMALL-MOLECULE CANCER DRUGS
Within the group of small molecules, kinase inhibitors form a large part. Currently, over 40 kinase inhibitors are approved for cancer treatment, with many more being in early clinical development. Radiolabeling of these small-molecule cancer drugs (<1 kDa) with 11C or 18F is challenging. Ideally, an isotopologue of the small-molecule cancer drug would be used. However, when this is not possible, analogs are used, which can have altered target affinity and pharmacokinetic characteristics. Despite the difficulties in labeling small-molecule cancer drugs, several approved drugs are radiolabeled, including 11C-imatinib, 18F-sunitinib, 11C-sorafenib, 11C-erlotinib, 11C-lorlatinib, and 11C-vandetanib (10). However, clinical evaluation of these tracers is limited. We here highlight the application of radiolabeled drugs targeting epidermal growth factor receptor (EGFR), anaplastic lymphoma kinase (ALK), and poly(adenosine diphosphate ribose) polymerase (PARP).
EGFR Inhibitors
EGFR inhibitors are administered to patients with non–small cell lung cancer (NSCLC) bearing an activating EGFR mutation, which has a prevalence of approximately 10%–15%. There are several approved EGFR inhibitors, including the first-generation inhibitors erlotinib and gefitinib, the second-generation inhibitor afatinib, and the third-generation inhibitor osimertinib. Osimertinib is approved in patients with the most commonly acquired T790M mutation, which is involved in resistance to first- and second-generation EGFR inhibitors.
Discordance can occur between the mutational status of the primary tumor and brain metastases measured by genomic analysis in biopsies (11). Examples include EGFR alterations in brain lesions that were absent in the primary tumor (11). Molecular imaging can potentially provide information on the mutational status of EGFR lesions and thereby facilitate drug development by improving patient selection. 18F-N-(3-chloro-4-fluorophenyl)-7-(2(2-(2-(2-(4-fluorine)ethoxy)ethoxy)-ethoxy)-6-(3-morpholinopropoxy)quinazolin-4-amine (18F-IRS) is a novel radiotracer developed to image the EGFR exon 19 deletion, an EGFR aberration leading to constitutive EGFR activation (12). Preclinically, 18F-IRS showed preferential uptake in tumors with EGFR exon 19 deletion (12). Uptake with a mean SUVmax of 2.4 was also observed in tumor lesions with an exon 19 deletion from 3 NSCLC patients (12). Imaging of the mutational status of NSCLC was also pursued using 18F-ODS2004436, a compound chosen on the basis of EGFR selectivity. Preclinically, 18F-ODS2004436 showed increased uptake in rats with EGFR mutated lung cancer xenografts compared with EGFR wild-type xenografts (13). Clinical evaluation of 18F-ODS2004436 in NSCLC is ongoing. Whether molecular imaging can successfully assess whole-body EGFR mutational status and therefore aid in patient selection has to be studied more extensively.
Molecular imaging using radiolabeled EGFR tyrosine kinase inhibitors (TKIs) has been performed with 11C-erlotinib, 11C-gefitinib, 18F-afatinib, the third-generation inhibitor 11C-osimertinib, 11C-AZD3759, and (development halted) 11C-rociletinib. Finally, 11C-labeled 4-N-(3-bromoanilino)-6,7-dimethoxyquinazoline (11C-PD153035), a PET tracer based on a reversible EGFR TKI, was studied in patients with NSCLC receiving erlotinib treatment. Only 11C-erlotinib, 18F-afatinib, and 11C-PD153035 have been studied in the clinical setting.
Most experience in patients with NSCLC is with 11C-erlotinib. In a study on 10 patients, full kinetic modeling of 11C-erlotinib via continuous arterial sampling demonstrated volume of distribution as the best parameter to represent 11C-erlotinib uptake (14). The study showed that the volume of distribution was higher in the 5 patients with an activating EGFR mutation than in patients with EGFR wild-type tumors. This effect was independent of EGFR expression as measured by immunohistochemistry or of perfusion as assessed by 15O-H2O PET. In a subsequent study, 11C-erlotinib was studied in 10 patients during erlotinib treatment (15). Erlotinib treatment decreased tumor tracer uptake in all patients, whereas perfusion measured with 15O-H2O remained similar. In another study, on 13 patients with NSCLC with unknown EGFR mutational status, baseline 11C-erlotinib uptake was visualized in the tumors of 4 patients (16). Of these 4 patients, 3 showed stable disease on erlotinib treatment. Using another radiolabeled EGFR TKI, 11C-PD-153035, higher tumor uptake on PET was associated with prolonged progression-free and overall survival after erlotinib treatment in a pilot study with 21 NSCLC patients (17). 18F-afatinib is being studied in NSCLC patients in an ongoing trial (Dutch trial register identifier, NTR5203).
Brain penetration of the third-generation EGFR TKI osimertinib was studied using 11C-osimertinib in cynomolgus monkeys (18). CNS penetration of 11C-osimertinib was compared with that of 11C-rociletinib and 11C-gefitinib. At PET microdosing conditions with less than 3 μg of 11C-osimertinib, higher brain exposure was seen than for the other EGFR TKIs. The increased osimertinib brain penetration also resulted in regression of brain lesions in a mouse brain metastasis model. In the same study, preliminary clinical efficacy for osimertinib was shown by noncomplete response–nonprogressive disease in the brain lesions of 2 patients with NSCLC (18). The prominent effects of osimertinib for NSCLC brain metastases have now been proven even in a large phase 3 trial as first-line treatment (19). Molecular imaging was also performed with another third-generation EGFR TKI, AZD3759, which was designed for improved CNS penetration. Clear healthy brain uptake in cynomolgus monkeys (n = 2) was shown by 11C-AZD3759 PET (20). In the phase 1 trial with 20 patients with NSCLC and CNS involvement, an impressive 63% intracranial objective response rate with AZD3759 (12/19 evaluable patients) was observed, indicating sufficient brain penetration of AZD3759 (21).
All in all, EGFR-TKI PET demonstrates its value in pharmacokinetics, in particular CNS penetration. In addition, there is some evidence regarding preferred uptake for EGFR-mutated tumors and discrimination between responders and nonresponders. However, larger studies are needed.
ALK Inhibitors
Several ALK inhibitors have recently been approved by the Food and Drug Administration for the treatment of the 5% of patients with NSCLC who have a genetic aberration involving ALK, such as echinoderm microtubule-associated proteinlike 4 (EML4)–ALK translocation. This translocation can act as an oncogenic driver, thereby promoting cancer cell growth (22). After approval of the first-generation ALK inhibitor crizotinib, the second-generation ALK inhibitors ceritinib, brigatinib, and alectinib became available for patients resistant to crizotinib. However, patients can also acquire resistance to the second-generation ALK inhibitors. Therefore, the third-generation ALK inhibitor lorlatinib was developed, which shows activity against all known acquired ALK mutations (23). The brain is a common metastatic site in NSCLC, and therefore activity against intracerebral lesions is critical for patient survival and quality of life. Alectinib was detected in cerebrospinal fluid (24) and improved patient outcome regarding CNS progression and progression-free survival (25). However, a new mutation will eventually arise on second-generation ALK inhibitor therapy, leading to third-generation ALK inhibitor lorlatinib treatment. Lorlatinib has been specifically developed for improved CNS penetration (26). To assess CNS penetration of lorlatinib noninvasively, 11C and 18F isotopologues of lorlatinib were developed (27). 11C-lorlatinib administered to nonhuman primates showed that CNS uptake of 11C-lorlatinib peaked at 10 min after injection, with the highest uptake being in the cerebellum (27). Tumor imaging in a human EML4-ALK–positive NSCLC xenograft mouse model showed that tumor uptake (2.2%–2.4% injected dose per gram of tissue) could be blocked by adding unlabeled lorlatinib (<0.4% injected dose per gram of tissue) (27). Besides 11C-lorlatinib, 18F-lorlatinib was successfully synthesized, but it has not been studied yet in vivo.
PARP Inhibitors
Recently, PARP inhibitors have entered the clinic with Food and Drug Administration–approved drugs, including olaparib and niraparib. Using molecular imaging, whole-body PARP expression and pharmacodynamic changes on PARP treatment have been assessed in preclinical and clinical settings, as recently reviewed (28). An example includes 18F-fluorthanatrace, which demonstrated specific tumor uptake by blocking tumor uptake by olaparib in preclinical breast cancer models (29). In patients with ovarian cancer, 18F-fluorthanatrace lesion uptake corresponded to DNA damage as assessed in tissue histology by the DNA damage marker γ-H2AX (30). Although 18F-fluorthanatrace has not been studied clinically in the context of PARP inhibition, this novel technology has potential to assess whole-body PARP expression and evaluate pharmacodynamic changes on PARP inhibition in patients who are eligible for PARP treatment. Particularly in the setting of breast cancer, in which the role of PARP inhibitors has not been firmly established, this ability could provide relevant insights. Imaging of PARP expression is being further explored in several ongoing clinical trials.
MOLECULAR IMAGING WITH mAbs
mAbs are directed against a specific target and in general have a long half-life of around 3 wk. They form a group of anticancer drugs that includes more than 24 mAbs that are registered for standard care in curative and noncurative settings and around 200 more that are in clinical development (3). mAbs target antigens on the tumor cell affecting receptor signaling and turnover (e.g., trastuzumab), the vasculature or stroma (e.g., bevacizumab), or characteristics on other cells such as T cells. The immune checkpoint modulators have raised a lot of recent attention given their antitumor effects across numerous tumor types, and mAbs are increasingly being used to deliver a toxic payload in the form of a cytotoxic agent or radioisotope bound to a mAb forming an antibody–drug conjugate (ADC) or radioimmunotherapy, respectively.
Growth Factor Receptors
Sufficient target expression and efficacious dose ranges at the mAb site of action are a prerequisite for the drug to work. Moreover, given the fact that there are often few to no side effects, it is problematic to determine the optimal mAb dose to be administered to patients.
The radiolabeled mAb trastuzumab has been studied extensively. In treatment-naïve patients with human epidermal growth factor receptor 2 (HER2)–positive metastatic breast cancer, the optimal protein dose for 89Zr-trastuzumab PET was 50 mg (31). In these patients, because of the dose-dependent pharmacokinetics of trastuzumab, with a known average terminal half-life of 1.1 d, 10 mg of trastuzumab were excreted immediately, not allowing proper imaging. After multiple therapeutic doses of trastuzumab, its average terminal half-life increases to 28.5 d in a steady state, providing an excellent setting for imaging with 10 mg of trastuzumab (32). From a SPECT study with serial 111In-trastuzumab SPECT imaging before and after 12 wk of treatment with trastuzumab and paclitaxel, we learned that HER2 target saturation is limited (33).
In a study with 89Zr-lumretuzumab targeting human epidermal growth factor receptor 3, increasing doses of lumretuzumab did not lead to a plateau of tumor 89Zr-lumretuzumab uptake, possibly because of highly dynamic receptor expression, reflecting the difficulty in defining the maximum required mAb dose in the clinic (34).
Not only cell membrane targets but also targets in the tumor microenvironment can be visualized, as was shown in multiple studies performed with 89Zr-bevacizumab targeting vascular endothelial growth factor A. A pilot study with pretreatment 89Zr-bevacizumab PET in 7 NSCLC patients showed a high tumor-to-background ratio in primary tumor and metastases, suggesting specific tumor uptake (35). With repeated 89Zr-bevacizumab PET imaging of metastatic renal cell cancer before treatment and after 2 and 6 wk of treatment, there was a decrease in target visualization highly suggestive of reduced access by inhibition of angiogenesis (36). Repeated 89Zr-bevacizumab PET imaging was also performed on 14 patients with advanced neuroendocrine tumors at baseline and during treatment with everolimus, and intra- and interpatient heterogeneity of 89Zr-bevacizumab lesion uptake was shown (37). Everolimus treatment is known to reduce vascular endothelial growth factor A secretion, and indeed, everolimus treatment for 12 wk reduced 89Zr-bevacizumab uptake compared with baseline, illustrating that 89Zr-bevacizumab tracer uptake functioned as a pharmacodynamic marker.
Immunooncology
In the rapidly evolving field of immunooncology there are still major questions, including which patients and tumor types benefit from immune checkpoint inhibitors. Because many studies with new cancer drugs are performed on mouse models with a mouse immune system, the gap between mouse and human has to be bridged. Use of humanized mice with a human immune system is a step forward in translating results to predict drug behavior in humans more reliably; however, this model lacks the presence of human cytokines, human leukocyte antigen proteins, and human organs.
Checkpoint inhibitor can be directed at targets on immune cells but also on tumor cells. Molecular imaging with the 89Zr-labeled programmed death ligand 1 checkpoint inhibitor atezolizumab in metastatic triple-negative breast cancer, NSCLC, and urothelial carcinoma showed heterogeneous 89Zr-atezolizumab tumor uptake and, interestingly, uptake in lymphoid tissues (38).
mAbs can be modified to serve a specific mechanism of action—for example, bispecific antibodies directed against a tumor surface antigen and cluster of differentiation 3ε on T cells. These drugs can be a full-sized mAb or a modified antibody such as 2 linked, single-chain variable fragments resulting in a 55-kDa bispecific T-cell–engaging antibody construct. The results of the biodistribution study with the radiolabeled bispecific T-cell engager 89Zr-AMG211, directed against carcinoembryonic antigen in patients with gastrointestinal adenocarcinomas, are awaited (NCT02760199).
ADCs
ADCs combine high target-specificity with the cytotoxic potential of a chemotherapeutic drug. Currently, 2 ADCs are approved for standard care and more than 50 are in clinical development. In one study, the efficacy of an ADC-targeting carcinoembryonic antigen–related cell adhesion molecule, CEACAM6, and biodistribution of the naked 64Cu-anti-CEACAM6 mAb were assessed in mice with human xenograft pancreatic adenocarcinoma (39). Furthermore, in nonhuman primates, the in vivo distribution showed the highest tracer uptake to be in bone marrow. During treatment with the ADC, all nonhuman primates experienced anemia and thrombocytopenia, suggesting that PET imaging with this mAb predicted the toxicity of its ADC.
There is one clinical imaging study in relation to ADCs. In patients with HER2-positive metastatic breast cancer, a study was performed to assess 89Zr-trastuzumab as a biomarker to identify nonresponders to treatment with the ADC trastuzumab emtansine (40). In 29% of the patients, no 89Zr-trastuzumab uptake in tumor lesions was seen. These patients experienced a shorter time to treatment failure than did those with uptake in tumor lesions. The combination of a negative pretreatment 89Zr-trastuzumab PET result and absence of response on early 18F-FDG PET performed in the week preceding cycle 2 resulted in a negative predictive value of 100% for treatment response according to RECIST 1.1 and therefore could potentially be a powerful tool in predicting which patients will not benefit from trastuzumab emtansine treatment. Also, intrapatient heterogeneity, defined as tracer uptake not in all lesions but in a dominant part or minor part of the total tumor load, was detected in 46% of the patients, providing insight on the extent of this phenomenon.
Blood–Brain Barrier
Of special interest regarding biodistribution is penetration of the drug across the blood–brain barrier into the CNS. A point of discussion is whether mAbs reach brain metastases to the same extent as they reach extracranial metastases, since mAbs, being of heavy weight, cannot pass the blood–brain barrier. A study with 89Zr-bevacizumab and gadolinium-enhanced MRI in 7 children with radiated diffuse intrinsic pontine glioma found heterogeneity in tumor tracer uptake (41). Two tumors showed no tracer uptake. In 4 of 5 tumors, tracer uptake corresponding to contrast-enhanced areas on MRI was seen, as is highly suggestive of leakage in the blood–brain barrier. In another study, with trastuzumab and lumretuzumab, specific tracer uptake in multiple brain metastases was seen (31,34). Although clinical evidence is scarce, first results demonstrate the potential of molecular imaging for studying CNS penetration of mAbs.
ANTIHORMONAL THERAPY AND 18F-FES PET OR 18F-FDHT PET
Antihormonal therapy is commonly used in patients with breast and prostate cancer. Although numerous antihormonal treatments are available, there is a constant search for new drugs. In breast cancer, approximately 75% of the tumors express the estrogen receptor (ER), and patients with such tumors can potentially be treated with antihormonal therapies (42). Tumor ER expression is measured immunohistochemically before such therapy is started. However, heterogeneity can occur between the primary and metastatic sites and between metastases (43). In that case, a single biopsy may not be representative of the ER expression in all lesions. PET-measured 16α-18F-fluoro-17β-estradiol (18F-FES) tumor uptake correlated well with ER expression by the tumor (44). To get whole-body information on ER expression, radiolabeled estradiol uptake as measured with 18F-FES PET is of interest.
Paradoxically, besides the better-known antiestrogen therapy for ER-positive breast cancer, estrogens can also induce tumor regression. It is thought that long-term estrogen deprivation triggers hypersensitivity to estrogens, with an increase in ER expression. To find patients eligible for estrogen therapy, knowledge about ER expression might be helpful. To this purpose, 19 patients with hormone-resistant metastatic breast cancer underwent baseline 18F-FES PET followed by treatment with 2 mg of estradiol 3 times daily, with response assessment in 15 patients (45). An SUVmax threshold of more than 1.5 was considered as positive uptake (46). Baseline 18F-FES PET uptake produced a positive predictive value of 60% and a negative predictive value of 80% for treatment response, suggesting that the 18F-FES PET especially identified patients unlikely to benefit from estradiol therapy—those with low or no 18F-FES tumor uptake.
Apart from insight on whole-body uptake of estradiol by tumor lesions, 18F-FES PET is also used during drug development as a pharmacodynamic marker. This was first evaluated for fulvestrant, a pure ER antagonist and a selective ER degrader. Regretfully, more than 50% of patients with metastatic breast cancer do not benefit from fulvestrant, which might be due in part to administration of an insufficient dose (47). 18F-FES PET was therefore used to study whether the current dose of fulvestrant therapy is sufficient for optimally abolishing estradiol uptake in the tumor (48). Sixteen patients underwent 18F-FES PET at baseline and after 4 wk of treatment consisting of 500 mg of fulvestrant on days 1, 14, and 28. In 6 patients, the predefined relevant 75% reduction in 18F-FES was not reached. The 38% of the patients with incomplete reduction of 18F-FES uptake were more likely to develop progressive disease within 24 wk of therapy.
Others have taken a similar approach for a pharmacodynamic readout. Z-4-hydroxy-N-demethyl-tamoxifen hydrochloride (Z-endoxifen), a selective ER modulator, has been tested in a phase 1 study (49). Z-endoxifen is the most potent tamoxifen metabolite and therefore might be more effective than tamoxifen. Patients received 40–300 mg/d orally for 28 d per cycle. In 8 of 15 patients who underwent imaging with 18F-FES PET at baseline, uptake in tumor lesions (n = 41) was seen (50). In these 8 patients, 18F-FES PET was repeated early after administration of Z-endoxifen (1–5 d). At a per-patient level, the average SUVmax among all lesions at baseline (4.8) decreased by 33.6% after 1–5 d.
GDC-0810 is a novel ER antagonist that binds to the ER and induces conformational changes that lead to receptor degradation (51). 18F-FES PET was used in a phase 1 study to evaluate ER occupancy and guide dose selection (52). Thirty postmenopausal women underwent a baseline scan. The average SUV corrected for background (defined as SUVmax – SUVbackground, derived from surrounding normal tissue) of lesions per patient at baseline ranged from 0.2 to 9.3, with a median of 3.1. GDC-0810 was given in different dosages of 200–800 mg daily orally. Follow-up scanning, performed on 24 patients 4 wk after treatment, demonstrated an impressive reduction in 18F-FES uptake by more than 90%, ranging from 63.6% to 100% at the different doses, with a greater 18F-FES reduction at higher-dose groups. Selection of the 600-mg daily dose for phase 2 studies was based on the decrease in 18F-FES uptake, safety, and pharmacokinetics. Further development has been discontinued.
Elacestrant (RAD1901) is a novel selective ER degrader that binds and targets ER for degradation in a dose-dependent manner. 18F-FES PET was performed on healthy volunteers at baseline and after 6 d of RAD1901 treatment at doses of up to 1,000 mg/d to assess ER engagement. With dosing at 200 and 500 mg/d, a complete attenuation of 18F-FES PET signal was observed in tissues with baseline high uptake, such as the uterus (53). Thereafter, 18F-FES PET imaging as an early indicator of clinical response to RAD1901 treatment in breast cancer patients was explored (54). RAD1901 reduced 18F-FES uptake by 79%–91% on day 14, compared with baseline, in patients given 400 mg/d (54). For all these studies, it is important to realize that reduction in radiolabeled-estradiol uptake does not necessarily mean that this results in antitumor efficacy.
Another example of molecular imaging for pharmacodynamic assessment during hormonal therapy is 18F-16β-fluoro-5α-dihydrotestosterone (18F-FDHT) PET in prostate cancer. 18F-FDHT tumor uptake measured with PET has shown a good correlation with tumor androgen receptor (AR) expression (55). Enzalutamide, an AR antagonist, was selected for clinical development because of several characteristics. AR antagonism was assessed in vitro in a binding assay in which 18F-FDHT and the compound of interest competed for AR binding (56). Enzalutamide and another anti-AR compound, RD162, showed 5- to 8-fold greater affinity than bicalutamide in this competition assay. Enzalutamide also showed activity in prostate cancer models with overexpressed AR and bicalutamide resistance (56). In 140 patients, a 30–600 mg/d dosage of enzalutamide was administrated orally (57). 18F-FDHT PET on 22 patients showed less tumor uptake at dosages of 60 mg/d and above, with an apparent maximal effect seen at 150 mg/d. The phase 3 AFFIRM study, with 160 mg of enzalutamide per day, showed improved overall survival compared with placebo in castration-resistant prostate cancer after chemotherapy (58), and enzalutamide is currently an approved drug for prostate cancer treatment.
OPTICAL IMAGING IN DRUG DEVELOPMENT
Optical imaging also has a real potential to support drug development. Because of high sensitivity with submillimeter resolution, fluorescent tracers can be studied at a microscopic level. However, given the low penetration depth of whole-body imaging, it is not feasible, and only accessible lesions can be studied. Optical imaging has already been performed with fluorescently labeled mAbs such as bevacizumab in the intraoperative setting (59). Although the primary aim was to detect tumor lesions intraoperatively, use of the ex vivo specimens also allowed the study of intratumoral drug distribution. The intratumoral drug distribution showed specific tumor uptake. These approaches stress the potential role of optical imaging in drug development.
CONCLUSION AND FUTURE DIRECTIONS
With the arrival of novel treatment strategies for cancer, cancer drug development is rapidly expanding and requires enormous resources. Only a small number of the drugs under development obtain approval, with enormous financial costs for those that fail to be approved. Molecular imaging studies provide in vivo insight on drug target expression, pharmacokinetics, and pharmacodynamics. Although these studies are expensive and require time and expertise, valuable information on drug development can be extracted. However, molecular imaging should be complemented by other techniques when relevant, such as pharmacokinetic analysis, as well as radiomics (analysis extracted from PET, CT, or MR images) or analysis of tumor biopsies, circulating tumor DNA, or circulating tumor cells by genomics, transcriptomics, or proteomics. This toolbox of techniques has gained interest in cancer drug development and allows biomarker exploration, patient selection, and insight on mechanism of action.
DISCLOSURE
Elisabeth G.E. de Vries has a consultation/advisory role with Pfizer. Mathilde Jalving has an advisory role with Merck. Research funding was provided by Amgen, Abbott, Genentech/Roche, Chugai, Servier, Novartis, Synthon, AstraZeneca, Merck, Pfizer, SMS-Oncology, and Radius Health, all made available to the institution. Elisabeth G.E. de Vries received grant RUG 2016-10034 from the Dutch Cancer Society and the ERC advanced grant OnQview. No other potential conflict of interest relevant to this article was reported.
Footnotes
↵* Contributed equally to this work.
Published online Jan. 25, 2018.
- © 2018 by the Society of Nuclear Medicine and Molecular Imaging.
REFERENCES
- Received for publication November 6, 2017.
- Accepted for publication January 16, 2018.


Jump to section
Related Articles
Cited By...
- Fluorescently labelled vedolizumab to visualise drug distribution and mucosal target cells in inflammatory bowel disease
- Using fluorescently labeled vedolizumab to visualize local drug distribution during colonoscopy and identify mucosal target cells in patients with inflammatory bowel disease
- in vivo quantitative FRET small animal imaging: intensity versus lifetime-based FRET
- in vivo quantitative FRET small animal imaging: intensity versus lifetime-based FRET
- 89Zr-DFO-Durvalumab PET/CT Before Durvalumab Treatment in Patients with Recurrent or Metastatic Head and Neck Cancer
- Imaging Androgen Receptors in Breast Cancer with 18F-Fluoro-5{alpha}-Dihydrotestosterone PET: A Pilot Study
- In vitro and in vivo NIR Fluorescence Lifetime Imaging with a time-gated SPAD camera
- First-in-Human Study of the Biodistribution and Pharmacokinetics of 89Zr-CX-072, a Novel Immunopet Tracer Based on an Anti-PD-L1 Probody
- Preclinical PET imaging with the novel human antibody 89Zr-DFO-REGN3504 sensitively detects PD-L1 expression in tumors and normal tissues
- Molecular Imaging: a Novel Tool To Visualize Pathogenesis of Infections In Situ
- The Future of Nuclear Medicine as an Independent Specialty
- Nuclear Medicine and Wall Street: An Evolving Relationship