


Abstract
The aim of this study was to investigate the relationship between the tumor uptake of 16α-18F-fluoro-17β-estradiol (18F-FES) and 18F-FDG using PET and expressions of sex hormone receptors, such as estrogen receptor (ER), as well as glucose transporter 1 (GLUT-1) and Ki-67 analyzed by the immunohistochemistry method in mesenchymal uterine tumors. Methods: Forty-seven patients with mesenchymal uterine tumors were studied with 18F-FES and 18F-FDG PET. Postoperative pathologic diagnosis revealed 33 uterine leiomyomas and 14 uterine sarcomas. Tissue samples were assayed for expression of ERα, ERβ, progesterone receptor (PR), PR-B, GLUT-1, and Ki-67 by an immunohistochemistry method. Standardized uptake values (SUVs) for 18F-FES and 18F-FDG were compared with the semiquantitative immunoreactive score (0–12) and quantitative labeling index (LI) for Ki-67 in immunohistochemistry. Results: 18F-FES uptake was significantly lower (P < 0.001) and the 18F-FDG uptake and SUV ratio of 18F-FDG to 18F-FES (18F-FDG/18F-FES ratio) (P < 0.005 and P < 0.001, respectively) were significantly higher in uterine sarcomas than in leiomyomas. Immunohistochemistry analysis showed significantly higher expressions of ERα, PR, and PR-B in uterine leiomyomas than in sarcomas. The Ki-67 LI was significantly greater in uterine sarcomas than in leiomyomas. Correlation analysis for all tumors showed positive correlations between 18F-FES SUV and immunohistochemistry scores of ERα, PR (P < 0.001), and PR-B (P < 0.005) as well as between 18F-FDG SUV and GLUT-1 and Ki-67 (P < 0.001). However, the 18F-FDG/18F-FES ratio showed significantly negative correlations with ERα, PR (P < 0.001), and PR-B (P < 0.005) and a positive correlation with Ki-67 LI (P < 0.001). In uterine sarcomas, ERα and 18F-FES SUV showed a positive correlation (P < 0.001) in a low SUV range, and the 18F-FDG/18F-FES ratio showed positive correlations with ERβ and GLUT-1 expression (P < 0.005). Conclusion: 18F-FES and 18F-FDG PET showed correlations between tracer uptake and expressions of sex hormone receptors, GLUT-1, and Ki-67 in mesenchymal uterine tumors. The 18F-FDG/18F-FES ratio was correlated with Ki-67, GLUT-1, and ERβ in uterine sarcoma. Functional PET imaging and PET parameters would be useful noninvasive biomarkers for the assessment of tumor hormone receptor expression, glucose metabolism, and proliferation and for differential diagnosis of uterine leiomyoma and sarcoma.
- positron emission tomography (PET)
- 18F-fluoroestradiol (18F-FES)
- 18F-fluoro-deoxyglucose (18F-FDG)
- immunohistochemistry
- sex hormone receptors
- 18F-FDG/18F-FES ratio
Uterine sarcoma is a rare tumor that accounts for approximately 1% of female genital tract malignancies and 3%–7% of malignant uterine tumors (1). Uterine leiomyoma, clinically affecting 25%–30% of reproductive-age women, is one of the most common tumors of the female genital tract (2,3). Because the prognosis of patients with uterine sarcoma is poor, with an overall 5-y survival of 8%–12% for advanced stages in various studies (1), the differential diagnosis of uterine sarcoma from leiomyoma is important for effective treatment, especially in the early phase of the disease. The ability to distinguish between leiomyoma and sarcoma is improved using clinical imaging methods, such as MR imaging and PET. The combined assessment of MR imaging and 18F-FDG PET is more accurate than MR imaging alone to distinguish types of uterine smooth muscle tumors (4). However, it is still difficult to differentiate uterine sarcoma from leiomyoma when leiomyoma shows high 18F-FDG uptake and degenerative changes on MR images (5). Recently, PET with 16α-18F-fluoro-17β-estradiol (18F-FES) became available for assessing regional estrogen receptor (ER) expression in vivo noninvasively. This new method has successfully differentiated aggressiveness of endometrial tumors as well as benign and malignant lesions (6). The diagnostic accuracy of this method, which used both 18F-FES and 18F-FDG PET and a functional parameter of the standardized uptake value (SUV) ratio of 18F-FDG to 18F-FES (18F-FDG/18F-FES ratio), was superior to MR imaging.
Most uterine tumors, including leiomyomas, are hormone-dependent, and the estrogen level is an important factor for those tumors. The expressions of ER and progesterone receptors (PRs) were found to be significantly greater in uterine leiomyoma than in uterine sarcoma (7)—a finding consistent with our previous preliminary 18F-FES PET study that reported significantly greater 18F-FES accumulation in leiomyoma than in sarcoma (8). On the other hand, recent studies reported that ER and PR expressions were associated with prognosis and the clinical response to hormonal treatment in patients with uterine sarcoma (9,10). Thus, in vivo assessment of ER expression will be important for the management of uterine sarcoma and the differential diagnosis of leiomyoma and sarcoma.
18F-FES uptake correlated well with immunohistochemistry measures of ER expression in breast cancer (11). In a study of uterine endometrial carcinoma, uptake correlated better with the expression of the ERα subtype than ERβ (12). In the latter investigation, 18F-FES accumulation was significantly correlated with PR-B expression as well, possibly providing important information for the prognosis and selection of therapies in the management of mesenchymal uterine tumors (9). However, the relationship between 18F-FES accumulation and the expression of hormone receptors in uterine leiomyomas and sarcoma has not been studied. The purpose of the present study was to investigate the relationship between parameters of functional PET images and expression of sex hormone receptors in mesenchymal uterine tumors. Indices of tumor proliferation such as Ki-67 and glucose transporter-1 (GLUT-1) were also evaluated in immunohistochemical analysis. The results will help clinical differential diagnosis between uterine leiomyoma and sarcoma and selection of treatment methods for mesenchymal uterine tumors.
MATERIALS AND METHODS
Patients
Forty-seven patients (mean age ± SD, 51.8 ± 12.7 y; age range, 34–83 y) with a clinical diagnosis of mesenchymal uterine tumors were enrolled in the study between May 2004 and August 2011. Patients were included in this study when a nonbenign mesenchymal uterine tumor was suggested according to the results of a pelvic examination by 2 experienced gynecologic physicians. The following were imaging findings: either the characteristic mosaic pattern on ultrasonic power Doppler images, suggesting a nonbenign smooth muscle tumor, or heterogeneous intensities with high signals on MR T1- and T2-weighed images.
All patients underwent whole-body PET scans with 18F-FES and 18F-FDG before surgery. The 2 PET scans were obtained within 1 wk, and the patients underwent the surgical operation within 1 mo after the PET scans. Definitive diagnosis was determined using postoperative pathohistology analysis. Final diagnoses were 33 leiomyomas and 14 sarcomas. All tissue specimens were evaluated by subsequent immunohistochemical analysis. The study protocol was approved by the institutional review board of the University of Fukui Hospital, and informed consent was obtained from all patients before PET scanning.
PET Procedure
The method of 18F-FES synthesis was previously reported (13). In brief, 3-O-methoxymethyl-16β,17β-O-epiestriol cyclic sulfone was fluorinated, and then 2-step hydrolysis and neutralization were performed using a TRACERlab MXFDG (GE Healthcare). After the final purification, the specific activity was 100–200 GBq/μmol, and radiochemical purity was greater than 99%. The radiochemical yield was 16.6% ± 3.0% (at the end of synthesis). The PET scans were obtained using a whole-body tomography scanner (Advance; GE Healthcare), which permits simultaneous acquisition of 35 image slices in a 2-dimensional acquisition mode with an interslice spacing of 4.25 mm. Performance tests showed the intrinsic resolution of the scanner to be 4.0–5.3 mm in the axial direction and 4.6–5.7 mm in the transaxial direction.
For each 18F-FES and 18F-FDG PET study, approximately 185 MBq of the tracer were administered via the antecubital vein. Patients fasted at least 4 h before each study. Fifty minutes after the tracer injection, the patient was positioned supine on the PET scanner and a 16-min emission scan was obtained, with 3-min scans at the pelvic region (2 bed positions) and 2-min scans in each remaining region (5 bed positions) to completely cover the head to inguinal areas. Postinjection transmission scans with 2 min at the pelvis and 1 min in other areas were acquired after the emission scans using a 68Ge/68Ga rod source for attenuation correction. The PET data were reconstructed by the iterative reconstruction method (14 subsets and 2 iterations). The reconstructed images were then converted to a semiquantitative image corrected by the injection dose and patient’s body weight (SUV) using the following formula for data analysis: [tissue radioactivity concentration]/[(injection dose)/(body weight)].
Image Analysis
All patients underwent MR imaging before the 2 PET examinations for diagnosis and to obtain anatomic information about the pelvic organs. T1- and T2-weighed images in the axial, sagittal, and coronal planes were acquired with a 1.5-T superconducting MR imaging system (Signa; GE Healthcare). The repetition times for T1- and T2-weighted images were 533 and 4,700 ms, respectively, and echo times for T1- and T2-weighted images were 8 and 90 ms, respectively.
Multiple circular regions of interest (ROIs) with a fixed size of 8 mm (diameter) were drawn on the lesions to obtain the regional mean SUV in the ROIs (Fig. 1). Individual MR images were referenced to place ROIs in the appropriate region after PET, and MR images were coregistered using software (Body Guide; Advance Biologic Corp.). ROIs were placed on the MR image sections after coregistration, and the ROIs were applied to the resliced 18F-FDG and 18F-FES PET images in the same location because the 3 images were in the same space coordinates. Two or 3 sagittal or coronal planes of 6-mm thickness were used to obtain SUVs at the center of the lesion. If the lesion included necrosis at the center, ROIs were placed so as to exclude it on the MR image. SUVs for each patient were averaged for all ROI values to obtain the means of 18F-FDG and 18F-FES SUV of the tumor. The 18F-FDG/18F-FES ratio for each lesion was also calculated (4,6,12).

Coregistration of MR (A; contrast-enhanced T1-weighted), 18F-FDG (B), and 18F-FES PET (C) images of representative patient with leiomyoma. MR and PET images were coregistered before ROIs were placed (fusion image is on left of A), and multiple circular ROIs were drawn on MR image. These ROIs were transferred at same location on PET images.
Immunohistochemistry
Paraffin sections (2.5 μm thick) were used, and a standard immunohistochemistry technique (avidin–biotin–peroxidase) was performed as described in our previous study (12), to visualize the immunostaining intensity and distribution of specific receptors. Sections were dewaxed in xylene for 15 × 3 min, dehydrated in an alcohol row, and subjected to antigen retrieval in a pressure cooker for 15 min in 10 mM sodium citrate buffer (pH 6.0). After being cooled, they were washed 3 times in phosphate-buffered saline (PBS; pH 7.2). Endogenous peroxidase activity was blocked by immersion in 3% hydrogen peroxide for 5 min. Nonspecific binding of the primary antibodies was blocked by incubating the sections with diluted normal serum for 10 min at room temperature. The primary antibodies and dilutions used are listed in Table 1. Sections were incubated overnight with primary antibodies diluted in PBS (for Ki-67 and GLUT-1, sections were incubated for an hour with the primary body). After being washed with PBS, sections were incubated with diluted biotinylated goat antimouse immunoglobulins used as a secondary antibody for 10 min. After incubation with the avidin–biotin–peroxidase complex for another 10 min and a repeated washing step with PBS, the reaction products were visualized using 3,3′-diaminobenzidine in chromogen solution. Sections were then counterstained with Mayer’s acidic hematoxylin and washed in a multiple alcohol row (70%–100%). After xylene treatment, they were covered. Sections of human colon and breast cancer were used as positive controls, and negative controls were obtained by omission of the primary antibody.
Primary Antibodies and Dilutions Used for Immunohistochemical Analysis
The intensity and distribution for specific receptors were semiquantitatively assessed using an immunoreactive score (IRS), as previously described (12), according to the intensity and distribution of the specific immunohistochemistry staining reaction in the nucleus (in the membranes for GLUT-1). The immunoreactive score (range, 0–12) was calculated by the following equation: IRS = ΣSI × PP, where SI is the optical stain intensity graded as 0 = no, 1 = weak, 2 = moderate, and 3 = strong staining, and PP is the degree of positively stained cells defined as 0 = no staining, 1 ≤ 10%, 2 = 11%–50%, 3 = 51%–80%, and 4 ≥ 81%. Expression of Ki-67 was quantified by the Ki-67 labeling index (LI), and the results were described as the number of Ki-67–positive cells per 1,000. Immunohistochemistry staining was scored by 3 independent observers.
Statistical Analysis
18F-FES SUV, 18F-FDG SUV, and the 18F-FDG/18F-FES ratio were compared between leiomyoma and sarcoma using the Student t test. The immunohistochemistry scores of ERα, ERβ, PR, PR-B, GLUT-1, and Ki-67 LI were compared between leiomyoma and sarcoma using the Mann–Whitney U test. The correlation between each PET parameter and the immunohistochemistry score was examined using Spearman correlation coefficients by rank test. The correlation between each PET parameter and Ki-67 LI was also evaluated by a Pearson correlation coefficient test. A probability value less than 0.05 was considered to indicate a significant difference. Statistical analysis was performed using a software package (SPSS for windows, version 17.0; SPSS Inc.).
RESULTS
The patient population and characteristics are listed in Table 2. Although the age range was similar, the means of patients’ age were significantly different between the 2 groups (P < 0.05). The tumor sizes were slightly greater in leiomyoma than in sarcoma, though they were not significantly different. The quantitative values of 18F-FDG and 18F-FES PET for uterine leiomyoma and sarcoma are shown in Table 3. The 18F-FES SUV of sarcoma was significantly lower than that of leiomyoma (P < 0.001), whereas 18F-FDG SUV (P < 0.005) and the 18F-FDG/18F-FES ratio (P < 0.001) were significantly greater in sarcoma.
Characteristics of Patients
SUVs of 18F-FES and 18F-FDG PET
The results of immunohistochemistry scores between uterine leiomyoma and sarcoma are shown in Table 4. There were significantly higher expressions of ERα (P < 0.005), PR (P < 0.001), and PR-B (P < 0.005) in uterine leiomyoma than in sarcoma. Expression of Ki-67 was significantly lower in uterine leiomyoma than in sarcoma (P < 0.001). ERβ and GLUT-1 expression showed no difference between the tumor groups.
Receptor Expression of Uterine Leiomyomas and Sarcomas
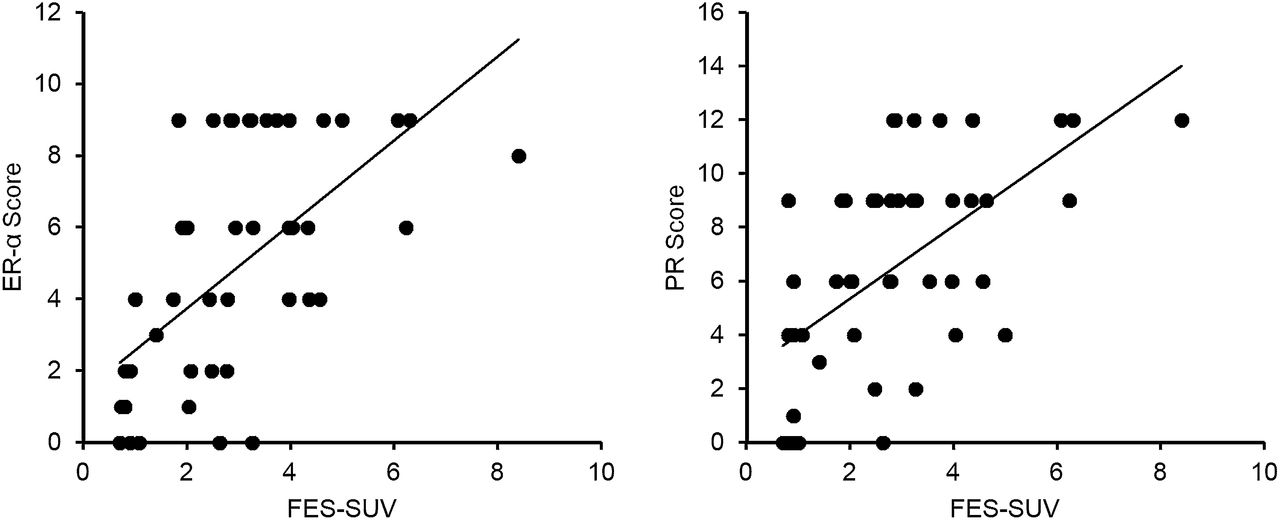
18F-FES SUV was compared with expressions of receptors, GLUT-1, and Ki-67 by semiquantitative immunohistochemistry scores and quantitative LI. Figure 2 shows representative correlations. In all mesenchymal tumors, ERα (Fig. 2, left, P < 0.001), PR (Fig. 2, right, P < 0.001), and PR-B (P < 0.005) showed significantly positive correlations and Ki-67 (P < 0.001) showed a significantly negative correlation with 18F-FES SUV, although ERβ and GLUT-1 did not show correlations with 18F-FES SUV (P = 0.866 and 0.976, respectively). In uterine leiomyoma, ERα (P < 0.01), PR (P < 0.05), and GLUT-1 (P < 0.05) showed significantly positive correlations with 18F-FES SUV; however, ERβ, PR-B, and Ki-67 did not show correlations with 18F-FES SUV (P > 0.1). In uterine sarcoma, only ERα (P < 0.005) showed a significantly positive correlation.

Comparison of 18F-FES uptake measures with immunohistochemistry scores. 18F-FES SUVs showed significantly positive correlation with immunohistochemistry scores of ERα (left) (P < 0.001) and PR (right) (P < 0.001) (rank correlation coefficients ρ = 0.65 and 0.60, respectively) in total tumors. Other significant correlations between 18F-FES uptake and immunohistochemistry scores are provided in additional supplemental material (available online only at http://jnm.snmjournals.org).
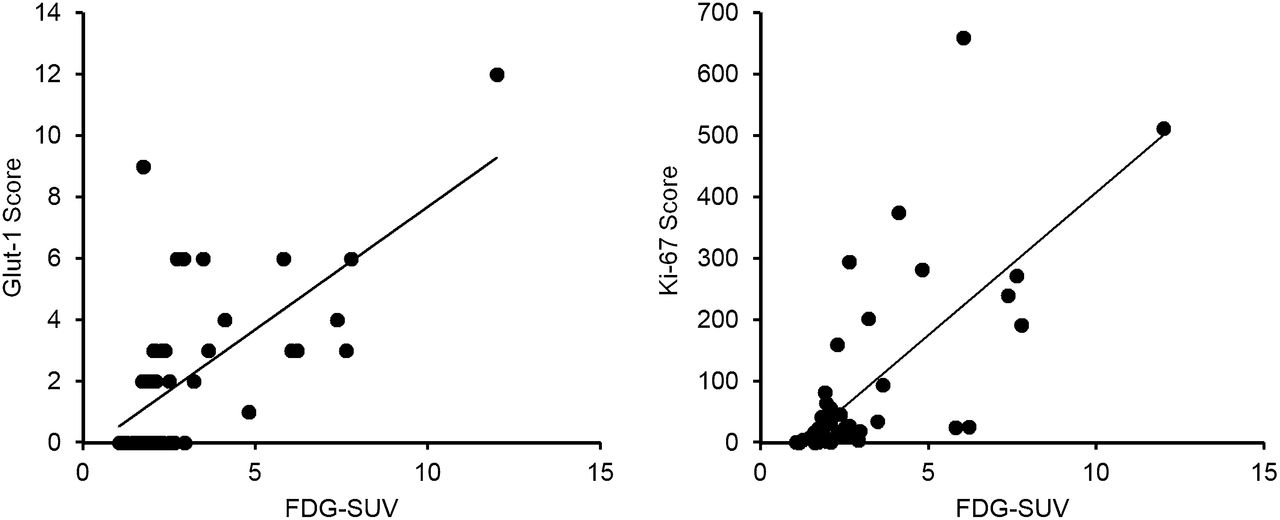
Figure 3 shows representative correlations between 18F-FDG SUV and immunohistochemistry results in mesenchymal tumors. In all tumors, 18F-FDG SUV showed significantly positive correlations with expressions of GLUT-1 (Fig. 3, left, P < 0.001) and Ki-67 (Fig. 3, right, P < 0.001), although ERα, ERβ, PR, and PR-B did not correlate significantly (P > 0.05). In uterine leiomyoma, only GLUT-1 showed a positive correlation (P < 0.05). Uterine sarcoma showed significantly positive correlations between 18F-FDG SUV and expressions of ERβ (P < 0.005) and GLUT-1 (P < 0.001); however, other immunohistochemistry scores did not show correlations with 18F-FDG uptake.

Comparison of 18F-FDG uptake measures with immunohistochemistry scores and LI. 18F-FDG SUVs showed significantly positive correlation with immunohistochemistry scores of GLUT-1 (left) (ρ = 0.59, P < 0.001) and LI of Ki-67 (right) (r = 0.71, P < 0.001) in total mesenchymal tumors. Other significant correlations between 18F-FES uptake and immunohistochemistry scores are provided in additional supplemental material.
The representative relationship between the 18F-FDG/18F-FES ratio and immunohistochemistry scores are presented in Figure 4. In all mesenchymal tumors, the 18F-FDG/18F-FES ratio showed significantly negative correlations with ERα (Fig. 4 left, P < 0.001), PR (P < 0.001), and PR-B (P < 0.005) and a positive correlation with Ki-67 LI (Fig. 4, right, P < 0.001). ERβ and GLUT-1 did not show any significant correlations (P > 0.1). In uterine leiomyoma, the 18F-FDG/18F-FES ratio showed a significantly negative correlation with ERα only (P < 0.005), and other immunohistochemistry scores showed no correlations. In uterine sarcoma, the 18F-FDG/18F-FES ratio showed significantly positive correlations with ERβ (P < 0.005), GLUT-1 (P < 0.001), and Ki-67 (P < 0.05) expression.
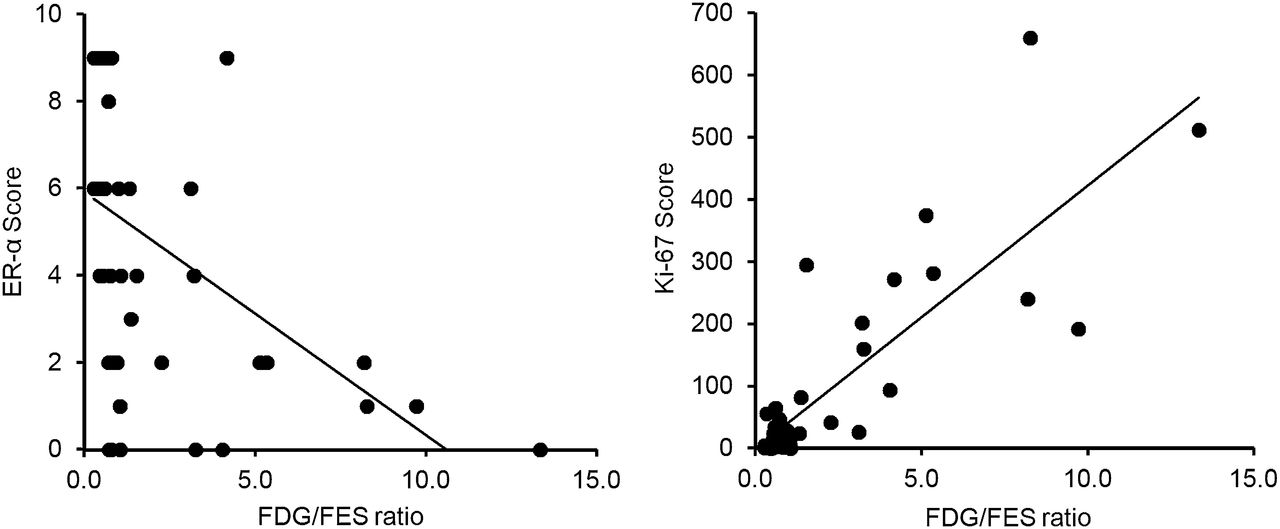
Comparison of 18F-FDG/18F-FES ratio with immunohistochemistry scores and LI. 18F-FDG/18F-FES ratio showed significantly negative correlation with immunohistochemistry scores of ERα (left) (ρ = −0.67, P < 0.001) in total mesenchymal tumors, but ratio showed positive correlation with Ki-67 (right) expression (r = 0.83, P < 0.001). Other significant correlations between 18F-FES uptake and immunohistochemistry scores are provided in additional supplemental material.
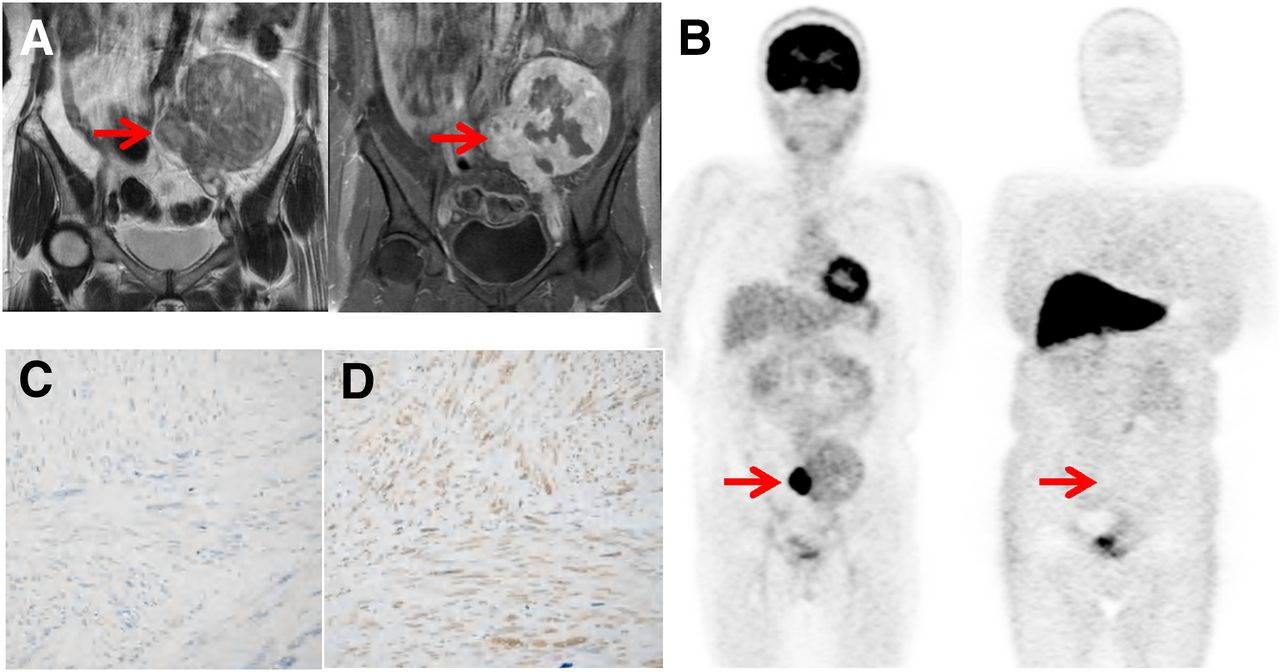
Representative cases are given in Figures 5 and 6. Figure 5 shows a case with leiomyosarcoma on the right side of the uterus. PET images showed high 18F-FDG (SUV, 12) and low 18F-FES (SUV, 0.9) uptake, providing a high 18F-FDG/18F-FES ratio (13.3). Immunohistochemical findings of this case were low expression of ERα (Fig. 5C) and PR-B and high expression of ERβ (Fig. 5D), GLUT-1, and Ki-67. The other case of uterine leiomyoma (Fig. 6) showed moderate homogeneous 18F-FDG accumulation and high heterogeneous 18F-FES accumulation on PET images. Immunohistochemistry scores showed high expression of ERα (Fig. 6C), PR, and PR-B and low expression of ERβ (Fig. 6D), GLUT-1, and Ki-67.

Representative case of uterine leiomyosarcoma (56-y-old patient). T2-weighted (left) and contrast-enhanced T1-weighted (right) MR images (A) and 18F-FDG (left) and 18F-FES (right) PET images (B) (arrows) are shown. 18F-FDG SUV, 18F-FES SUV, and 18F-FDG/18F-FES ratio were 12.0, 0.9, and 13.3, respectively. Immunohistochemistry staining images are shown for ERα (C) and ERβ (D), and immunohistochemical scores were 0 and 9, respectively. Low uptake of 18F-FES significantly corresponded with low expression of ERα. Other immunohistochemistry staining images are provided in additional supplemental material.

Representative case of uterine leiomyoma (49-y-old patient). T2-weighted (left) and contrast-enhanced T1-weighted (right) MR images and 18F-FDG (left) and 18F-FES (right) PET images (arrows). 18F-FDG SUV, 18F-FES SUV, and 18F-FDG/18F-FES ratio were 1.9, 6.2, and 0.3, respectively. Immunohistochemistry staining images are shown for ERα (C) and ERβ (D), and scores were 6 and 4, respectively. High uptake of 18F-FES corresponded with high expression of ERα. Other immunohistochemistry staining images are provided in additional supplemental material.
DISCUSSION
The present study showed that the expression of ERα in uterine sarcoma was significantly lower than that in leiomyoma; however, there were no significant differences in expression of ERβ between the tumors. These findings were identical with previous reports using immunohistochemistry analysis in this aspect (14,15), although contradictory results of ER expressions in leiomyoma and the myometrium were reported by different investigators (16,17). On the other hand, the immunohistochemistry scores for energy metabolism and cell proliferation were greater in sarcoma than in leiomyoma. The indices of functional PET images such as SUVs and the 18F-FDG/18F-FES ratio reflected these expressions of sex hormone receptors and tumor activity. From our findings of ER expression, it is suggested that the major difference in ER between benign and malignant mesenchymal uterine tumors was expression of subtypes, which may be an important identification index for differential diagnosis between leiomyoma and sarcoma. The results of our study provide a reasonable explanation for the previous controversial reports.
The ERs are known as nuclear sex hormone receptors, which have 2 subtypes of ERα and ERβ; ERα is the predominant receptor in uterine tissue. 18F-FES PET can measure the in vivo ERα expression of uterine tumors noninvasively (12). The expression of ERα is significantly more enhanced in uterine leiomyoma than in the adjacent myometrium and in uterine sarcoma (9,14,16). Estrogen priming is essential for incidence of leiomyoma, and several studies have addressed the influences of ERs on the new growth or transformation of leiomyoma (15,18). Furthermore, studies showed good agreement between immunohistochemistry assays and radioligand binding assays (86%–98%) (11) as well as between in vivo 18F-FES accumulation on PET and in vitro radioligand assays (88%) (19). However, it was not clear which subtype of ER exerts the biologic effect on the tumors. It was also reported that the absolute binding affinity of 18F-FES was 6.3-fold greater for ERα than for ERβ, and thus 18F-FES uptake mainly reflects the expression of ERα, which reliably differentiates tumors with ERα expression from those with less ERα expression in vivo (20,21). In the present study, significant agreement was found between 18F-FES uptake and the ERα immunohistochemistry score (ρ = 0.48 and 0.78 in leiomyoma and sarcoma, respectively), although the mean of 18F-FES SUV in sarcoma was significantly lower than that in leiomyoma. The latter result reflected the significantly lower expression of ERα in uterine sarcoma than in leiomyoma. The results of lower ERα expression in malignancy and a good correlation between ERα immunohistochemistry score and tumor 18F-FES SUV were similar to those of our previous study with endometrial tumors (12). Huang et al. reported that the expression of ERβ, rather than ERα, is elevated in uterine sarcoma (22). These findings support the importance of 18F-FES PET coupled with 18F-FDG PET in differential diagnosis of mesenchymal uterine tumors.
Accurate diagnosis of benign and malignant mesenchymal uterine tumors is important for clinical patient management. Because of the overlapping features between uterine sarcoma and leiomyoma, the differential diagnosis is difficult using common imaging technology such as ultrasonography or MR imaging (23). 18F-FES PET has been successfully used to detect ER-positive lesions, such as uterine tumors and breast cancer (4,11,24), in clinical trials, and our previous studies showed that functional imaging of ER expression using 18F-FES PET improved the accuracy of diagnosis significantly, especially when coupled with tumor glucose metabolism using 18F-FDG PET (4,6,8,12). The 18F-FDG/18F-FES ratio was found to be a good indicator for differential diagnosis in uterine tumors, and a higher 18F-FDG/18F-FES ratio indicated a malignant lesion.
In the present study, the 18F-FDG/18F-FES ratio showed significantly negative correlations with ERα, PR, and PR-B expression and a positive correlation with Ki-67 LI in total mesenchymal uterine tumors (Fig. 4). It also showed significantly positive correlations with ERβ and GLUT-1 expression in sarcoma and a significantly negative correlation with ERα in leiomyoma. In malignant tumors, hypoxia may induce downregulation of ERα via a proteasome-dependent pathway, and the reduction in ERα expression was associated with overexpression of GLUT-1, which could facilitate proliferation of tumor cells and increase Ki-67 expression (25). The 18F-FDG/18F-FES ratio, reflecting glucose metabolism relative to ERα density, showed a better correlation with the Ki-67 index in uterine sarcoma (r = 0.63, P < 0.05) than did 18F-FDG or 18F-FES SUV alone. As an index coupling ER expression and glucose metabolism, the 18F-FDG/18F-FES ratio may be a good indicator expressing the relationship between the status of sex hormone receptors and cell proliferation in uterine tumors, especially in differentiating uterine sarcoma from leiomyoma. 3′-deoxy-3′-18F-fluorothymidine PET has been used recently to differentiate benign and malignant uterine tumors (26). Because accumulation of 3′-deoxy-3′-18F-fluorothymidine may reflect tumor proliferation, which might be represented by Ki-67 LI score in immunohistochemistry, the significant correlation of 18F-FDG/18F-FES ratio with Ki-67 LI is consistent with their results and our previous studies (4,6,12).
PR and PR-B expressions in uterine leiomyoma were found to be significantly greater than those in sarcoma in the current series; this result was supported by a previous report (7). Correlation analysis in this study indicated that there was good agreement between ERα and PR and ERα and PR-B in mesenchymal uterine tumors (ρ = 0.74 and 0.53, respectively; graphs are not shown). The 18F-FDG/18F-FES ratio was also well correlated with PR and PR-B expression, similar to our previous findings in endometrial carcinoma (12). Although 18F-FES uptake may directly reflect the functional ERα expression, it may be used to deduce PR and PR-B expression indirectly. ERα, PR, and PR-B expression may be related to prognostic ability in uterine sarcoma because it is reported that patients with uterine sarcoma with positive ERα and PR expression had a significantly longer disease-free time or overall median survival time than patients with negative ERα and PR expression (7,10). Furthermore, it was reported that the induction of PR was an ERα-mediated event, and suppression of epithelial PR was mediated by ERβ (27). Thus, 18F-FES SUV is expected to be a new noninvasive prognostic biomarker for uterine sarcomas because it can delineate ERα expression directly and PR expression indirectly, although the accumulation of 18F-FES in the lesion may be low.
18F-FDG is now widely used to evaluate regional glucose metabolism in a variety of tumors, and high correlations were found between 18F-FDG uptake and GLUT-1 expression in most malignant tumors (28–30). In our study, 18F-FDG SUV showed a significant correlation with GLUT-1 expression in all tumors (ρ = 0.59, P < 0.001; Fig. 3, left). The correlation in uterine sarcoma was stronger than that in leiomyoma (ρ = 0.87 vs. 0.43), although there was no significant difference in GLUT-1 expression between the 2 groups. On the other hand, in 6 of 33 leiomyoma patients who had high 18F-FDG uptake (SUV > 2.5), only 3 patients had high scores and 2 had negative scores in GLUT-1 expression. Although the expression of GLUT-1 may be a major cause for the high 18F-FDG uptake in uterine tumors, other factors are also related such as expression of hexokinase II (31), tumor cell proliferation, hormonal dependency, microvessel density, and the presence of inflammatory cells (5). 18F-FDG uptake includes many complicated factors, and it would be difficult to make a differential diagnosis in mesenchymal uterine tumors using 18F-FDG SUV alone.
Although a relatively large number of patients with uterine sarcoma were involved in this study, the histopathologic types were heterogeneous, including leiomyosarcoma, carcinosarcoma, endometrial stromal sarcomas, and undifferentiated endometrial sarcoma (Table 2). This heterogeneity of uterine sarcomas may be regarded as a limitation of the current study.
CONCLUSION
In mesenchymal uterine tumors, functional PET parameters reflected the receptor expression and other physiologic parameters; 18F-FES uptake correlated well with ERα and PR expressions and 18F-FDG uptake correlated well with GLUT-1 expression and Ki-67 LI in all mesenchymal tumors. The 18F-FDG/18F-FES ratio was correlated with GLUT-1, Ki-67 LI, and ERβ in uterine sarcoma, and it showed a better correlation with Ki-67 than 18F-FDG SUV. Functional PET imaging would be useful in differential diagnosis of mesenchymal uterine tumors from a pathophysiologic perspective.
DISCLOSURE
The costs of publication of this article were defrayed in part by the payment of page charges. Therefore, and solely to indicate this fact, this article is hereby marked “advertisement” in accordance with 18 USC section 1734. This study was partly funded by the grants-in-aid for Scientific Research from the Japan Society for the Promotion of Science (21390342 and 24249065) and the Japan Advances Molecular Imaging Program (J-AMP). No other potential conflict of interest relevant to this article was reported.
Acknowledgments
We thank Yuko Horiuchi and doctors in the Department of Gynecology, Faculty of Medical Sciences, and the staff of the Biological Imaging Research Center, University of Fukui, for technical and clinical support.
Footnotes
Published online Mar. 7, 2013.
- © 2013 by the Society of Nuclear Medicine and Molecular Imaging, Inc.
REFERENCES
- Received for publication September 4, 2012.
- Accepted for publication October 25, 2012.


Jump to section
Related Articles
Cited By...
- 18F-4FMFES and 18F-FDG PET/CT in Estrogen Receptor-Positive Endometrial Carcinomas: Preliminary Report
- ER Imaging for Estrogen-Related Tumors Is Bothersome but Useful
- 18F-Fluoroestradiol PET: Current Status and Potential Future Clinical Applications
- Cancer metabolic reprogramming: importance, main features, and potentials for precise targeted anti-cancer therapies
- Application of FDG-PET in Cervical Cancer and Endometrial Cancer: Utility and Future Prospects