


Abstract
The recently released Biograph mMR is the first commercially available integrated whole-body PET/MR scanner. There are considerable advantages to integrating both modalities in a single scanner that enables truly simultaneous acquisition. However, there are also concerns about the possible degradation of both PET and MR performance in an integrated system. This paper evaluates the performance of the Biograph mMR during independent and simultaneous acquisition of PET and morphologic MR data. Methods: The NEMA NU 2-2007 protocol was followed for studying the PET performance. The following measurements were performed: spatial resolution; scatter fraction, count losses, and randoms; sensitivity; accuracy of the correction for count losses and randoms; and image quality. The quality control manual of the American College of Radiology was followed for studying the MR performance. The following measurements were performed: geometric accuracy, spatial resolution, low-contrast detectability, signal-to-noise ratio, static field (B0) homogeneity, radiofrequency field (B1) homogeneity, and radiofrequency noise. Results: An average spatial resolution of 4.3 mm in full width at half maximum was measured at 1 cm offset from the center of the field of view. The system sensitivity was 15.0 kcps/MBq along the center of the scanner. The scatter fraction was 37.9%, and the peak noise-equivalent count rate was 184 kcps at 23.1 kBq/mL. The maximum absolute value of the relative count rate error due to dead-time losses and randoms was 5.5%. The average residual error in scatter and attenuation correction was 12.1%. All MR parameters were within the tolerances defined by the American College of Radiology. B0 inhomogeneities below 1 ppm were measured in a 120-mm radius. B1 homogeneity and signal-to-noise ratio were equivalent to those of a standard MR scanner. No radiofrequency interference was detected. Conclusion: These results compare favorably with other state-of-the-art PET/CT and PET/MR scanners, indicating that the integration of the PET detectors in the MR scanner and their operation within the magnetic field do not have a perceptible impact on the overall performance. The MR subsystem performs essentially like a standalone system. However, further work is necessary to evaluate the more advanced MR applications, such as functional imaging and spectroscopy.
The potential of multimodal imaging for improved noninvasive tissue characterization has been recognized in clinical and preclinical applications (1). This potential is reflected in the extensive research effort dedicated to software coregistration in the 1990s and the immediate success of combined PET/CT scanners after their introduction in the early 2000s (2).
Combining the high soft-tissue contrast of MR and molecular signals from PET may provide further multimodal assessment, reaching beyond the anatomic correlation by introducing functional MR as well. There are considerable advantages to integrating these modalities in a single scanner (3). The possibility of truly simultaneous operation allows the acquisition of several MR sequences during the PET scan, without increasing the examination time. Additionally, the radiation exposure is reduced if CT is not necessary.
The combination of MR and PET scanners is highly challenging. The high static magnetic field, quickly changing gradient fields, and radiofrequency signals from the MR scanner prevent the normal operation of photomultiplier tubes and may induce interference in the front-end electronics of PET detectors. Furthermore, the presence of the PET detector causes inhomogeneities in the magnetic field, eddy currents, and electromagnetic interference, potentially degrading MR image quality. These issues lead to a trade-off in the design of shielding elements to isolate both scanners.
Several approaches have been reported to overcome these problems: using 2 separate scanners sharing the same patient bed (4), integrating the PET scintillators in the MR scanner and guiding the scintillation light to a shielded enclosure outside the fringe field (5–8), using a custom magnet architecture (5), using field-cycled MR image acquisition to create intervals in which PET acquisition is possible (6), and redesigning the PET front-end using photodetectors, which are insensitive to the magnetic field. The feasibility of using avalanche photodiodes (APDs) for PET detectors up to a high field strength has been demonstrated by our group (7). Systems based on APD detectors coupled with lutetium oxyorthosilicate crystals for simultaneous PET/MR have been developed for preclinical research (8). Also, following the concept of a PET insert in an MR scanner, a preclinical device has recently been presented, based on Geiger APDs (9).
Two of these approaches have led to commercially available clinical scanners: the Philips Ingenuity TF, based on 2 separate scanners sharing a rotating bed (10), and the Siemens Biograph mMR, which uses APD–lutetium oxyorthosilicate PET detectors integrated between the MR body coil and the gradient coils. The main advantage of using separate scanners is to keep mutual interference to a minimum, thereby reducing the need for PET detector redesign. The main advantage of the integrated approach is the possibility of truly simultaneous isocentric acquisition.
The goal of this study was to determine the performance characteristics of the Biograph mMR system, focusing on the use of morphologic MR measurements simultaneous to PET acquisitions. Two widely accepted measurement protocols were used: the NU 2-2007 protocol of the National Electrical Manufacturers Association (NEMA) (11) for the PET subsystem and the quality control manual of the American College of Radiology (ACR) (12) for the MR subsystem. The performance degradation due to the integrated architecture can be quantified by comparing these measurements with those reported for other state-of-the-art scanners.
MATERIALS AND METHODS
A set of performance measurements was obtained on a newly installed Siemens mMR PET/MR scanner. The mMR comprises a 3-T niobium–titanium superconductor magnet (length, 163 cm; bore, 60 cm), an actively shielded whole-body gradient coil system (length, 159 cm; amplitude, 45 mT/m; and slew rate, 200 T/m/s), and a radiofrequency body coil (peak power, 35 kW; and transmitter bandwidth, 800 kHz). The MR system is capable of acquiring a field of view (FOV) of 0.5–50 cm, with a 2-dimensional slice thickness from 0.1 to 200 mm, 3-dimensional (3D) slab thickness from 5 to 500 mm, maximum matrix size of 1,024 elements, and maximum resolution of 9 μm.
A PET detector assembly is installed between the gradient and radiofrequency coils: 8 rings of 56 detector blocks, 8 × 8 lutetium oxyorthosilicate crystals (4 × 4 × 20 mm) per block, coupled to an array of 3 × 3 APDs (water-cooled), totalling 4,032 channels. The energy resolution (measured with 68Ge in air) was 14.5%, and the energy window was 430–610 keV. The time resolution was 2.93 ns, and the coincidence window was 5.86 ns (values provided by the manufacturer). The system does not have time-of-flight capability. A diagram of the placement of the PET detectors within the MR scanner can be seen in Supplemental Figure 1 (supplemental materials are available online only at http://jnm.snmjournals.org). The PET system has a transaxial FOV of 59.4 cm and an axial FOV of 25.8 cm and can acquire static multibed and list-mode data in 3D mode, with delayed window random estimation.
The acquisition workflow allows for defining protocols of PET acquisition while simultaneously running standard MR clinical pulse sequences. In clinical protocols, a small fraction (∼15 s) of the total PET acquisition time is always dedicated to a 2-point Dixon MR sequence (13), which is used as the basis for attenuation correction. The attenuation values are obtained by segmenting the Dixon images into 4 compartments: air, lung, fat, and soft tissue. These data are also used to perform 3D scatter correction by single-scatter simulation (14). Two reconstruction modes are available: filtered backprojection and 3D ordinary Poisson ordered-subset expectation maximization. The 3D reconstruction procedure takes approximately 1 min per bed position on the reconstruction server provided with the system.
The PET subsystem was evaluated following the NU 2-2007 protocol of NEMA (11). Before any measurements, a detector setup was performed, including APD gain equalization, crystal region map generation, and crystal energy peak adjustments, followed by time alignment and normalization scan.
The MR subsystem was evaluated following the quality control manual of the ACR (12). In addition, radiofrequency field homogeneity and radiofrequency interference measurements were performed.
These measurements were repeated under identical conditions in a Siemens Magnetom Verio. The Verio has essentially the same specifications as the mMR, except for a larger (70 cm) bore.
PET Spatial Resolution
A glass capillary (inside diameter, 1.1 mm; wall thickness, 0.2 mm; and length, 75 mm) was filled with 18F solution. The axial extent of the activity within the capillary was limited to 1 mm by an absorbing resin. The total activity in the capillary was 9.6 MBq.
The capillary was positioned parallel to the scanner axis using a frame, provided by the manufacturer, fixed to the calibration phantom holder situated at the head of the patient bed. The position of the source was adjusted by means of short sinogram acquisitions. Data were successively acquired at transaxial locations (0.1), (10.0), and (0.10) cm. These measurements were each taken at 2 axial positions: center of the FOV and one-quarter off-center (65 mm). The bed stayed outside the FOV during these measurements.
Each configuration was scanned until 2 × 10⁶ counts were acquired. All images were acquired within 20 min of the initial activity measurement. All scans were reconstructed using Fourier rebinning and filtered backprojection with a ramp filter. The image matrix was 344 × 344 × 127 voxels of 1.04 × 1.04 × 2.03 mm. The full width at half maximum and full width at tenth maximum of the source response function were computed by linear interpolation in the axial, radial, and tangential directions.
To evaluate the impact of simultaneous MR image acquisition, each measurement was repeated while performing a volumetric interpolated breath-hold examination (VIBE) (repetition time [TR], 20 ms; echo time [TE], 1.17 ms; and flip angle, 10°).
PET Scatter Fraction, Count Losses, and Randoms
A 700-mm portion of a polyethylene tube (inside diameter, 3 mm; outside diameter, 4.8 mm) was filled with 1.3 GBq of 18F-FDG solution. The tube was then inserted in a 6.5-mm hole drilled parallel to the axis of a solid polyethylene cylinder (diameter, 202 mm; length, 695 mm). The cylinder was supported by a pair of polystyrene holders to keep it centered in the FOV.
This setup was then scanned for 450 min, in 10-min frames, starting when the activity reached 675 MBq. Uncorrected prompt and random sinograms were generated (344 bins; bin size, 2.0445 mm; 252 views; axial compression, 1; and maximum ring difference, 60) and rebinned using single-slice rebinning. The randoms estimation in the mMR was obtained using the delayed coincidence window method and smoothing.
The sinograms were then processed following the NEMA protocol to calculate for each slice the system scatter fraction as well as the true, random, scatter, noise-equivalent, and total count rates.
Additionally, a 5-min list-mode acquisition in the absence of any activity was performed to evaluate the dark count rates.
PET Sensitivity
A 700-mm portion of a polyethylene tube (2.4 mL) was filled with 4.8 MBq of 18F-FDG solution. The tube was inserted in a concentric arrangement of 5 aluminum sleeves (length, 700 mm; inside and outside diameters, 3.9 and 6.4, 7.0 and 9.5, 10.2 and 12.7, 13.4 and 15.9, and 16.6 and 19.1 mm, respectively). The whole setup was fixed, parallel to the scanner axis, using a pair of polystyrene holders fitted to the bed rails. The bed stayed outside the FOV during these measurements.
A set of 5-min acquisitions was automatically performed, starting 16 min after the initial measurement of the activity. One acquisition was performed with the activity centered in the FOV and a second with the source placed 10 cm off-axis. This was repeated 5 times, each time removing 1 of the aluminum sleeves.
Each of the previous measurements was immediately repeated while running a VIBE sequence (TR, 20 ms; TE, 1.17 ms; and flip angle, 10°).
For each acquisition, an uncorrected sinogram was created and rebinned using single-slice rebinning. Estimated random coincidences were subtracted. The total number of acquired counts, corrected for isotope decay, was recorded for each slice of the sinogram and then summed. The five count rates for each source position were fit with an exponential model to extrapolate to the count rate in the absence of attenuation. The system sensitivity is defined as the count rate without attenuation divided by the activity in the tube. The axial sensitivity profile of the system was generated using the data collected for the smallest sleeve at the 0-cm radial offset.
PET Accuracy
PET accuracy was measured using the data acquired in the “Scatter Fraction, Count Losses, and Randoms” section. Each dataset was rebinned using Fourier rebinning, and 2-dimensional reconstruction was performed using filtered backprojection. Randoms subtraction, decay correction, arc correction, scatter correction, and attenuation correction with a calculated map were applied.
After reconstruction, a centered, 180-mm circular region of interest (ROI) was defined on each transaxial slice of each acquisition, and the true count rate in the region was calculated. The true count rate in the absence of randoms and dead-time losses was estimated by averaging the 3 lowest-activity acquisitions. From these values, the relative count rate error was computed for each slice of each acquisition.
PET Image Quality
For the PET image quality measurement, a body phantom (interior length, 175 mm; interior width, 293 mm; and interior height, 224 mm) was used. A cylindric insert (outside diameter, 50 mm; length, 175 mm) filled with low-density foam was fixed along the center of the body phantom. Six spheres (internal diameters, 10, 13, 17, 22, 28, and 37 mm) were placed in the body phantom, aligned in a transaxial plane 68 mm from the phantom endplate and distributed around the phantom axis at a distance of 5.72 cm. The 2 largest spheres were filled with water and the others with an aqueous solution of 18F-FDG (17 kBq/mL). The body phantom was then filled with 42 MBq of 18F-FDG solution to provide a background uptake of 4.27 kBq/mL and placed centered in the scanner. The solid cylinder used in the “Scatter Fraction, Count Losses, and Randoms” section was fitted with a line source filled with 81 MBq of 18F-FDG solution and placed along the patient bed, abutted to the body phantom. All activity values have been provided with respect to the start of the measurement.
The phantom was scanned for 10 min. The axial extent covered by the acquisition was 258 mm. The acquired sinogram was reconstructed using the 3D ordinary Poisson ordered-subset expectation maximization algorithm (4 iterations, 21 subsets), 172 × 172 × 127 voxels, 4.2 × 4.2 × 2.0 mm/voxel, normalization, dead-time correction, decay correction, 3D scatter correction, randoms smoothing, and 4-mm axial and transaxial postreconstruction gaussian smoothing. This acquisition was repeated 3 times, adjusting the scan time to account for decay.
Because the current implementation of the MR-based attenuation map is specifically designed for patients, the attenuation maps obtained for the image quality phantom were not usable (inadequate relaxation time and resonance effects). Instead, a calculated attenuation map was manually registered to the acquired data and used for reconstruction (water attenuation, 0.096 cm−1; lung insert attenuation, 0.034 cm−1).
On each of the acquired images, the percentage contrast and the percentage background variability were calculated for each sphere following the NEMA protocol. This processing was repeated with different numbers of reconstruction iterations (1–5 iterations) to evaluate the convergence properties of the reconstruction algorithm. Additionally, the residual error in the scatter and attenuation corrections was calculated for each slice.
The image quality measurement was repeated while running a VIBE sequence (VIBE: TR, 20 ms; TE, 1.17 ms; and flip angle, 10°).
PET System Stability
Stability of response with fluctuations in temperature is a concern with APD-based systems (15). During the daily quality control procedure using a homogeneous cylindric 68Ge phantom, a quantification factor is automatically computed to determine the ratio between the activity in the scanner and the detected counts. The calibration factor and decay-corrected true counts were monitored for a period of 2 mo.
MR Image Quality
For these measurements, the ACR MR accreditation phantom was used (12). It is a sealed cylinder of acrylic plastic, filled with a solution of 10 mM NiCl2 and 75 mM NaCl. The interior of the phantom is 148 mm in length, with a diameter of 190 mm, and contains a set of plastic structures that can be used for a variety of performance measurements. The phantom was inserted in the head coil and centered in the FOV.
A localizer sequence (1 slice; sagittal spin echo; TR, 200 ms; TE, 20 ms; slice thickness, 20 mm; FOV, 25 cm; 256 × 256 matrix; and scan time 56 s) was acquired and used to position a T1-weighted spin-echo sequence (11 slices; TR, 500 ms; TE, 20 ms; FOV, 25 cm; slice thickness, 5 mm; slice gap, 5 mm; and 256 × 256 matrix). The accuracy of slice positioning was evaluated by measuring the length difference of 2 crossed 45° wedge structures.
The geometric accuracy was evaluated by measuring the phantom's length on the sagittal localizer image and its diameter on the T1 sequence (x and y diameters).
For the high-contrast spatial resolution evaluation, the number of element rows and columns that could be individually discerned in a resolution insert was determined. The insert is a plastic structure containing 3 pairs of 4 × 4 arrays of water-filled holes. The spacing between the holes is 1.1, 1.0 and 0.9 mm, respectively.
Slice thickness accuracy was determined by comparing the distances between 2 signal ramps. The slice position accuracy was evaluated by measuring the length difference between the wedge structures used to position the slices.
The uniformity of the image intensities was measured in a uniform section of the phantom, by comparing the average intensities of two 1-cm2 ROIs placed in the highest- and lowest-intensity regions.
Percentage signal ghosting was estimated in the same slice, by means of four 10-cm2 ROIs placed next to the phantom. The average intensity of the ROIs in the frequency encode direction was subtracted from the average in the phase encode direction and then normalized by the average intensity in the phantom.
Low-contrast detectability was evaluated on low-contrast disk structures. The number of complete disk spokes was registered for each axial slice.
MR Magnetic Field Homogeneity
With this measurement, the uniformity of the static field (B0) was evaluated over a spheric volume of 24-cm diameter centered in the FOV. Of the 2 possible methods listed in the ACR quality control manual, the phase difference map method was selected.
The Siemens spheric nonconducting phantom D240 (outer diameter, 240 mm, filled with 7,300 mL of Marcol oil) was used for these measurements and placed inside the body loader using the provided phantom holder.
Two consecutive single-slice gradient-recalled echo sequences were acquired, with TEs of 17 and 20 ms, respectively. The phase maps of the images were recorded. This procedure was executed 3 times, acquiring 3 orthogonal planes centered in the phantom.
Each pair of phase images was unwrapped and subtracted to obtain a phase difference image. Phase images were, in turn, converted to B0 field differences with respect to the center of the FOV, as described in the ACR quality control manual.
MR Radiofrequency Field Homogeneity
To estimate the uniformity of the B1 (radiofrequency) field, the uniformity of the flip angle induced on a homogeneous phantom is measured. The measurement setup is the same described in the “MR Magnetic Field Homogeneity” section.
The novel non-equilibrium B1 mapping method (16) makes use of a recently observed linear relation between the frequency of oscillations in the transient phase of unbalanced steady-state free precession sequences and the actual flip angle (17). For sufficient repetitive deviation from steady state in the dynamic 3D acquisitions (matrix, 64 × 52 × 4; isotropic resolution, 5 mm), software triggering (period, 500 ms) was applied to alternate trains of steady-state free precession blocks (57 Cine phases) with idle periods. Steady-state free precession parameters were: flip angle, 24°, and TR/TE = 3.46/1.71. Data were exported for offline frequency analysis, performed with a singular value decomposition technique.
MR Radiofrequency Interference
To determine whether the PET detector electronics interferes with the acquired MR signals, radiofrequency noise measurements were performed with the PET detector powered off, the detector powered on, and with the detector on and an active 68Ge calibration phantom in the scanner. To ensure a proper loading of the coils, the 24-cm spheric phantom and phantom loader were placed in the FOV. The germanium phantom was placed axially adjacent to this setup.
The radiofrequency noise sequence sets the MR scanner in receive-only mode, scanning a 500-kHz range around the scanner's center frequency (123.2 MHz) in steps of 39.1 Hz per pixel. The measurement of each frequency step was repeated 256 times. These measurements were then averaged to yield the power spectrum of the received noise.
The signal-to-noise ratio from gradient echo (TR, 100 ms; TE, 10 ms; slice thickness, 5 mm; and bandwidth, 260 Hz/Px) and spin echo (TR, 600 ms; TE, 12 ms; slice thickness, 5 mm; and bandwidth, 130 Hz/px) sequences was evaluated. Images from the same patient, scanned on the mMR and on the Verio, were analyzed using the difference method described in the work by Firbank et al. (18).
In Vivo Studies
Two in vivo studies have been included to illustrate the performance of the mMR with clinical images.
The first case is an 18F-fluoride study, indicated to localize possible bone metastases of prostate cancer. The same patient was scanned with a Biograph TrueV PET/CT (41 min after injection) and with the mMR (158 min after injection). The injected activity was 331 MBq. Eight bed positions were acquired (3 min per bed position in both cases). The data were reconstructed using Fourier rebinning plus ordered-subset expectation maximization (4 iterations, 8 subsets) in the Biograph and 3D ordered-subset expectation maximization (3 iterations, 21 subsets) in the mMR.
The second case was a 3D T2-weighted TIRM (turbo spin-echo sequence with fat saturation through inversion recovery) of a healthy volunteer. The acquisition parameters were as follows: TE, 34 ms; TR, 3,000 ms; inversion time, 220 ms; echo train length, 73; slice thickness, 4 mm, and pixel spacing, 1.19 mm. The patient was scanned with identical parameters in the Verio and the mMR.
RESULTS
PET Spatial Resolution
The axial, radial, and tangential resolutions for each radius, averaged for both axial positions, can be found in Table 1.
Axial, Radial, and Tangential Resolutions
PET Scatter Fraction, Count Losses, and Randoms
The measured true, scatter, random, noise-equivalent, and total event rates are plotted in Figure 1 as a function of the average effective activity concentration (i.e., the average activity for a given acquisition, divided by the volume of the phantom, as described in the NEMA protocol).

Event rates (A), noise-equivalent count rate (B), and scatter fraction (C) as function of average effective activity concentration.
The peak true count rate had a value of 692 kcps and was reached for an activity concentration of 23.1 kBq/mL. The peak noise-equivalent count rate was reached for the same activity concentration and had a value of 184 kcps.
The scatter fraction is plotted in Figure 1C as a function of the average effective activity concentration. The scatter fraction value at peak noise-equivalent count rate was 37.9%.
The dark count rate had a prompts average of 820 cps and an SD of 26 cps.
PET Sensitivity
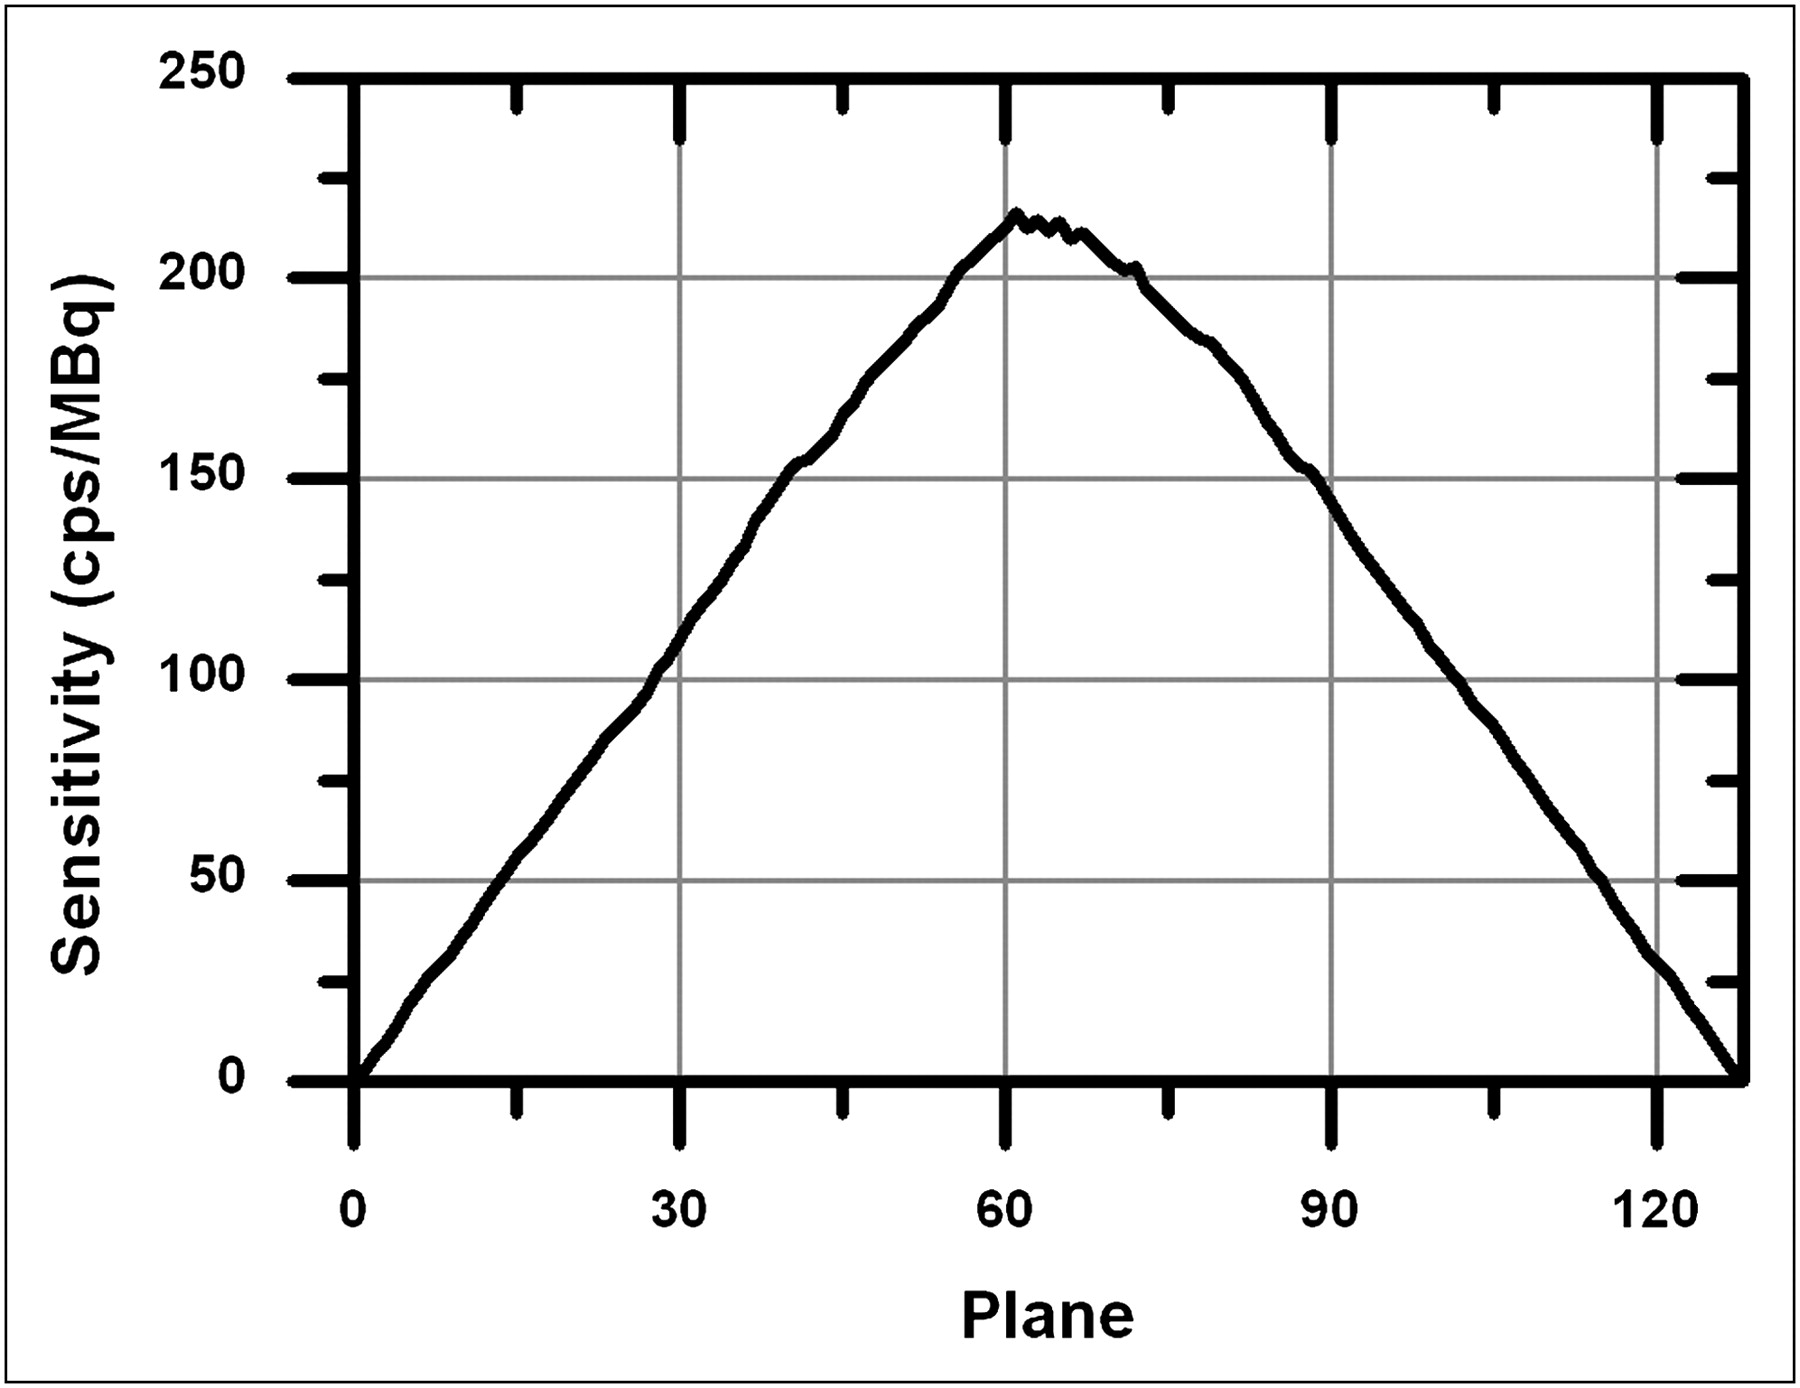
The axial sensitivity profile for an axial offset of 0 cm is plotted in Figure 2.

Axial sensitivity profile for radial offset of 0 cm.
The measured system sensitivity was 15.0 kcps/MBq along the center of the scanner and 13.8 kcps/MBq at a radial offset of 10 cm. With a running MR sequence, the sensitivity values were 15.0 kcps/MBq and 13.8 kcps/MBq, respectively. These results correspond to a system sensitivity of 1.5% both in the absence of MR and with the MR running.
PET Accuracy
Figure 3 shows the maximum and minimum values of the relative count rate error among the slices of each acquisition plotted versus the average effective activity concentration. The first and last 2 planes of the reconstructed volume have been excluded because of their significantly lower sensitivity. If these slices are included, the maximum values of the relative count rate error remain unchanged, but the minimum values can reach −12%.
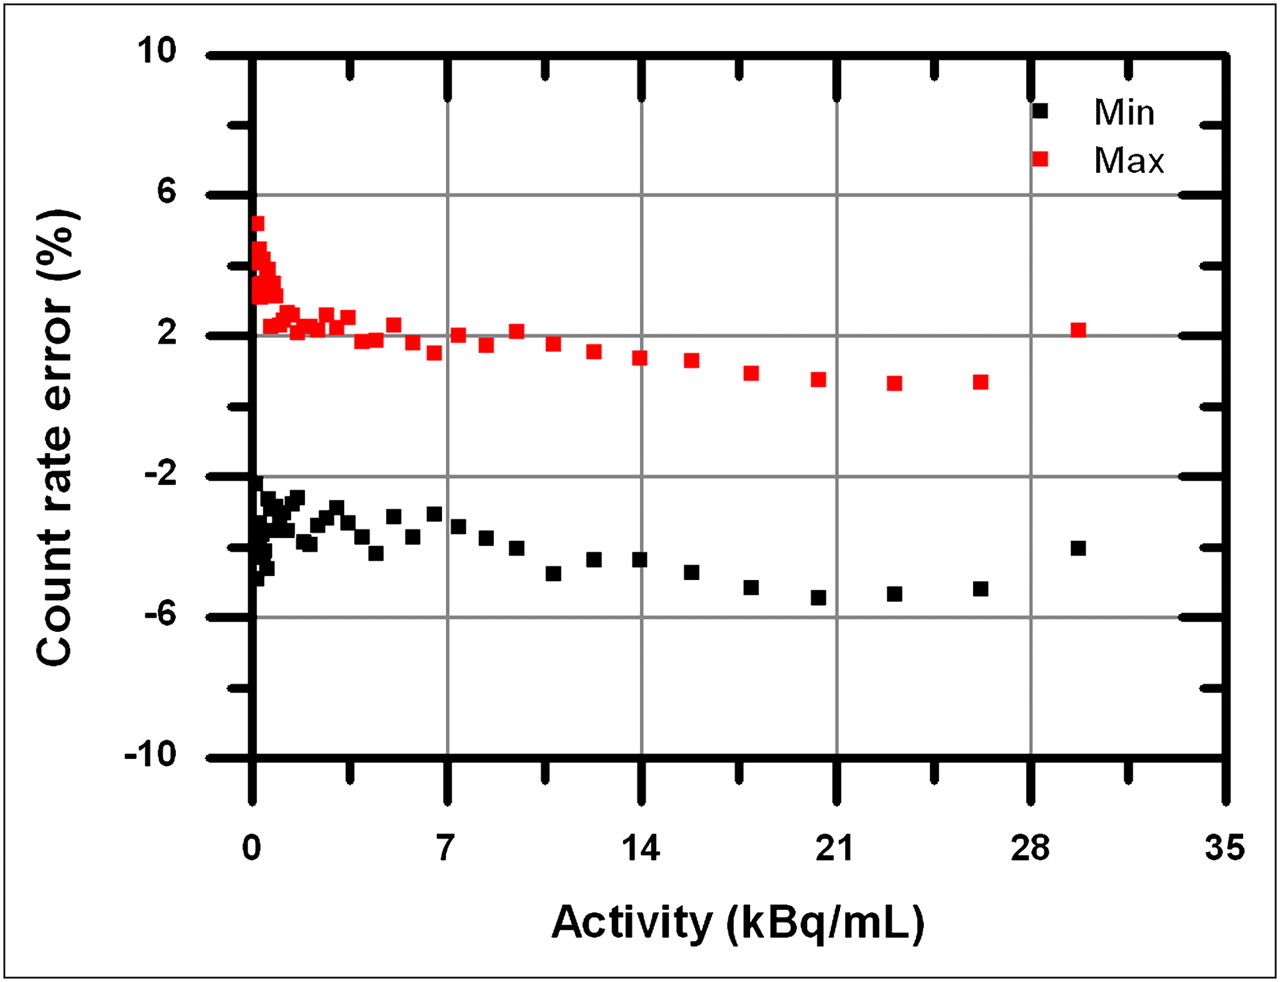
Maximum and minimum values of relative count rate error as function of average effective activity concentration.
The maximum absolute value of the relative count rate error at activities below that yielding the peak noise-equivalent count rate (23.1 kBq/mL, according to the “PET Scatter Fraction, Count Losses, and Randoms” section in the Results) was 5.5%.
PET Image Quality
Table 2 shows the percentage contrast and background variability of each sphere. The average residual error in the lung insert due to scatter and attenuation was 12.1% ± 0.3%.
Percentage Contrast and Percentage Background Variability of Spheres
Transverse and coronal images of the reconstructed images are shown in Figure 4. No artifacts due to the simultaneous MR were found.
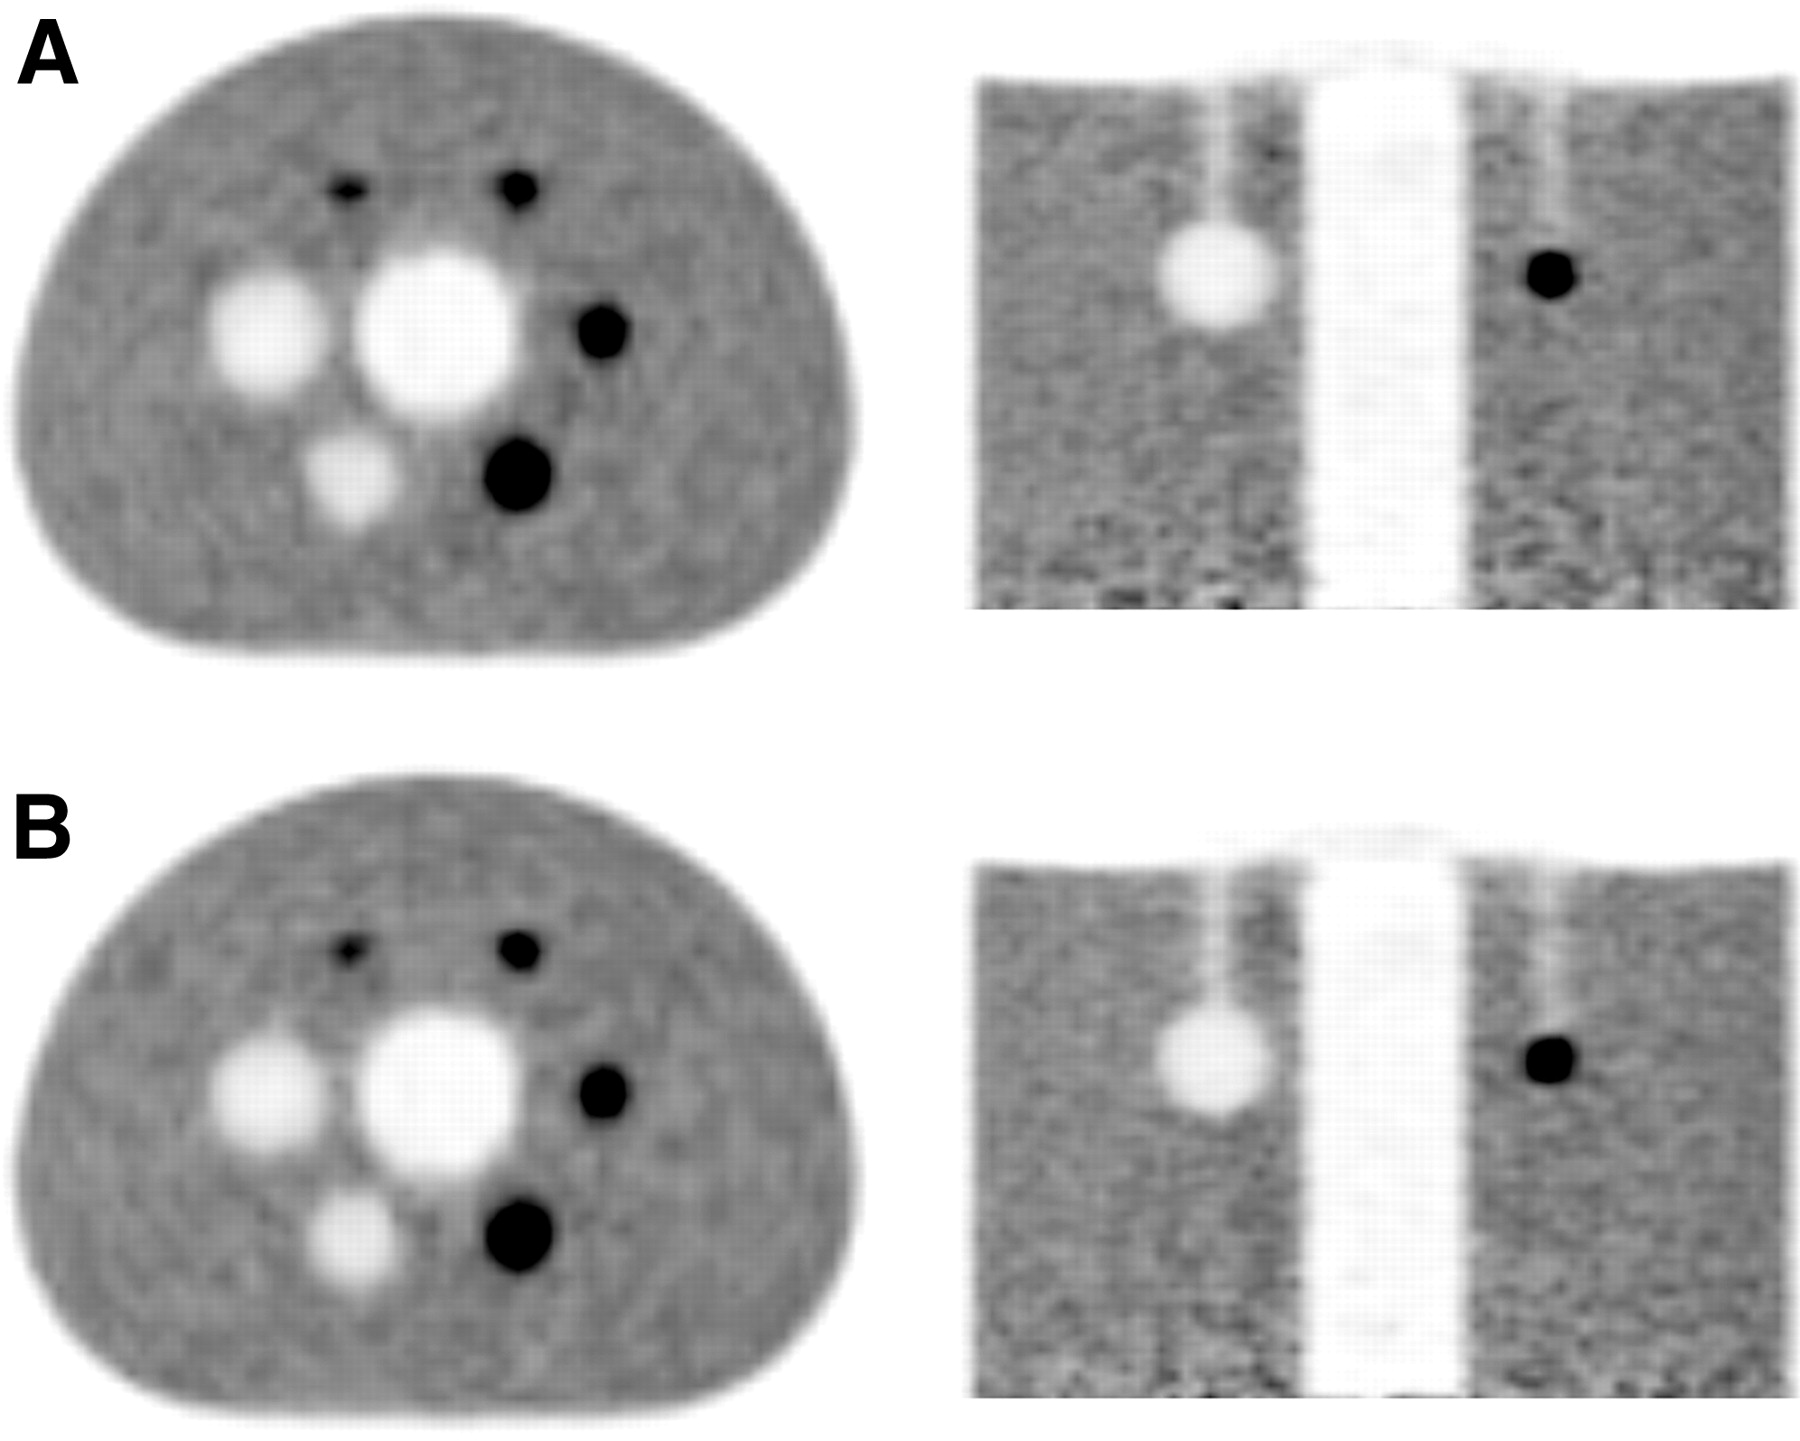
(A) Axial and coronal views of reconstructed image quality phantom. (B) Corresponding views of measurement with simultaneous MR image acquisition.
The impact of the number of reconstruction iterations on the contrast and background variability of the reconstructed hot spheres is shown in Supplemental Figure 2.
PET System Stability
No time-dependent drift could be noticed in the calibration factor (Supplemental Fig. 3). The SD of the calibration factor was 0.4%.
MR Image Quality
The results of the image quality tests are summarized in Table 3. The mMR and the Verio passed all tests.
Results Obtained Following MR Image Quality Tests Described in ACR Quality Control Manual
MR Magnetic Field Homogeneity
Figure 5 shows the maximum static field inhomogeneities in a centered sphere, as a function of sphere radius. The results obtained with both the Verio and the mMR are included.
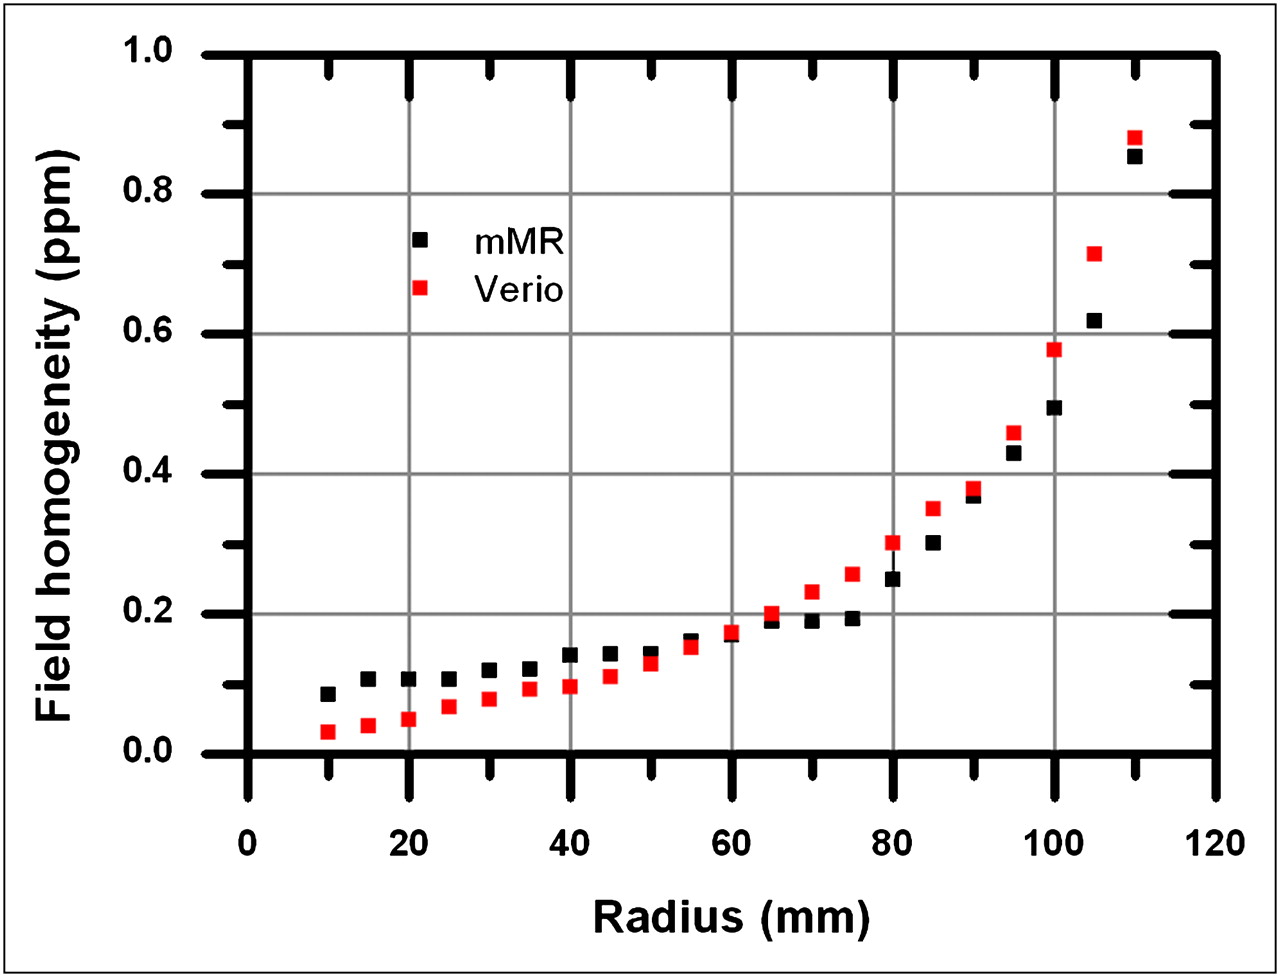
Maximum static field inhomogeneity (in parts per million) in centered sphere, as function of sphere radius.
Notice how the sharp increase of inhomogeneity shown by both curves for the largest radii is likely to be caused by local effects at the phantom edges, rather than by an intrinsic inhomogeneity of the static field.
MR Radiofrequency Field Homogeneity
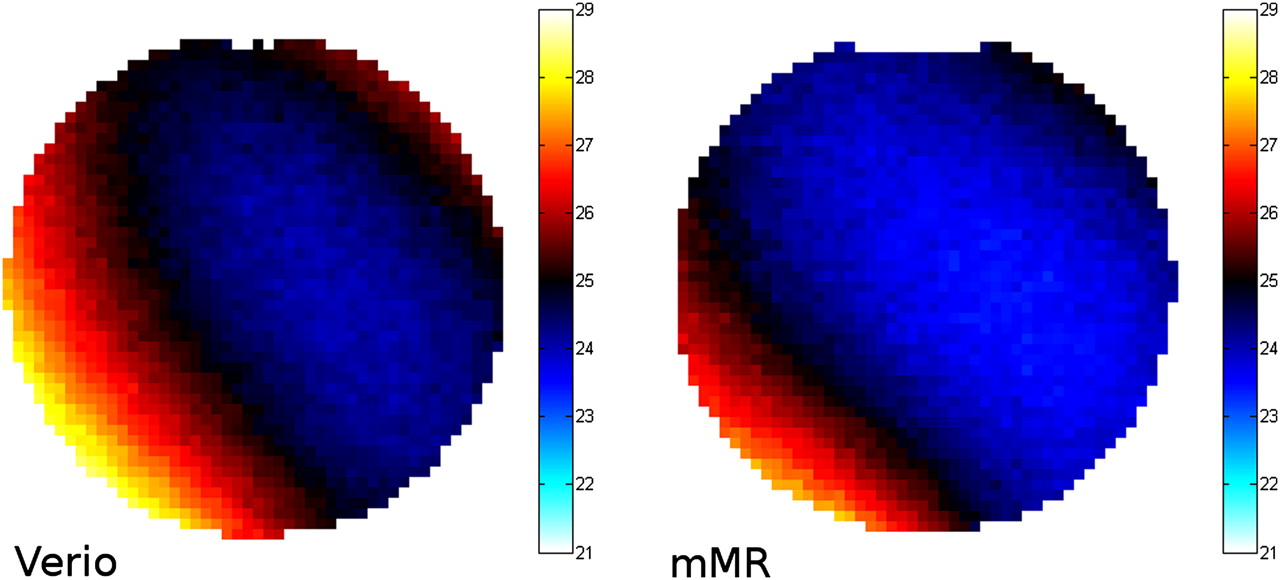
Figure 6 shows the measured flip angles in an axial slice through the center of the phantom, for the Verio and mMR. The deviations from the target flip angle (24°) reflect the inhomogeneities of the radiofrequency excitation field. The observed differences are negligible and may be caused by the reduced bore diameter of the mMR.

Flip angle maps of axial slice through center of phantom, reflecting inhomogeneities of B1 field of Verio and mMR.
MR Radiofrequency Interference
The radiofrequency noise spectra measured on the mMR are shown in Supplemental Figure 4. No interference could be noticed in the noise spectra.
The signal-to-noise ratios for the mMR and the Verio were 50.5 and 53.1, respectively, for the case of gradient-echo sequences and 43.9 and 34.6, respectively, for spin-echo sequences.
In Vivo Studies
The qualitative performance of the mMR compared with state-of-the art scanners can be appreciated in Figure 7. The unfused PET images can be found in Supplemental Figure 5.

mMR PET/MR (A) and Biograph PET/CT (B) fused views of whole-body 18F-fluoride scan of same patient. mMR (C) and Verio (D) T2-weighted coronal views of healthy volunteer.
DISCUSSION
No significant impact due to the integrated architecture of the mMR on the performance of either the PET or the MR subsystems was detected with these measurements. Although the MR system offers a wide range of imaging sequences, we focused on morphologic MR in the context of whole-body oncologic studies. The performance values obtained in this study compare favorably with PET/CT scanners (19,20). Table 4 summarizes these findings, taking as a reference the Siemens mCT (21), the state-of-the-art PET/CT scanner most closely resembling the mMR.
Comparison of Siemens mMR with Siemens mCT
Concerning the PET subsystem, the measured spatial resolution is typical for scanners with this system geometry and crystal dimensions. The positron range reduction effect of the magnetic field is not significant for 18F at 3 T (22) and would not be perceived unless the point sources were embedded in a dense material. This situation may be different for other isotopes with larger positron ranges, such as 82Rb or 15O, for which the static field may improve the resolution.
The longer axial FOV and reduced detector ring diameter lead to higher count rates and an increased sensitivity, both in stand-alone operation and with simultaneous MR image acquisition. This also means that the scanner reaches its saturation and dead-time points with lower activities. Work is under way to recalculate the optimal activity doses for each clinical protocol.
An increase in random and scattered counts was expected, because of the higher sensitivity (reduced ring diameter and increased axial FOV) and larger coincidence timing window (poorer time resolution of APDs with respect to classic photomultipliers). However, this increase seems to have been compensated by the narrower energy-window settings, which, in combination with comparable energy resolution, lead to a noise-equivalent count rate better than most PET/CT systems and a good scatter fraction.
The image quality and accuracy tests yielded results within the expected range for state-of-the-art scanners. Both procedures had to be performed using calculated attenuation maps, because the method to obtain MR-based attenuation maps (a 4-compartment tissue classification based on a Dixon sequence) is optimized for human imaging and not well suited for phantom studies. The system includes a 2-compartment mode, but this is a solution for only phantoms in which the Dixon sequence yields appropriate images, such as the solid germanium phantom used for the daily quality control. In the case of the NEMA image–quality phantom, dielectric resonance artifacts prevented the use of this method. Future developments will need to include more flexible methods of using various MR sequences or predefined maps for attenuation correction.
In summary, the overall performance of the PET subsystem is competitive with state-of-the-art photomultiplier tube–based systems, showing for what is to our knowledge the first time the great potential of semiconductor-based detectors in clinical whole-body PET. Further work is under way to evaluate those aspects not covered by the NEMA protocol, such as the impact of attenuation map truncation.
Concerning the MR subsystem, no significant inhomogeneities have been detected in either the static or the radiofrequency fields. The operation of the PET detector inside the MR bore and the transmission of data to the external processing units introduce no visible interference in the MR operating band. The ACR quality control measurements show a performance practically identical to that of the Verio.
Further work is required to test the performance of the scanner in a larger area of the FOV. Of particular interest will be the study of inhomogeneities and distortion toward the edges of the FOV and their possible impact on the calculation of MR-based attenuation maps.
CONCLUSION
The performance of the Siemens mMR whole-body PET/MR scanner has been evaluated following the NEMA NU 2-2007 protocol and ACR quality control manual. The results compare favorably with state-of-the-art PET/CT scanners. This study indicates the successful integration of new detector technology in PET/MR for whole-body imaging. However, further work is necessary to evaluate the more advanced MR applications, such as functional imaging and spectroscopy.
DISCLOSURE STATEMENT
The costs of publication of this article were defrayed in part by the payment of page charges. Therefore, and solely to indicate this fact, this article is hereby marked “advertisement” in accordance with 18 USC section 1734.
Acknowledgments
We thank Drs. Frederic Schoenahl and Isabel Dregely for their support during this study. The PET/MR system used for this study was funded through the Deutsche Forschungsgemeinschaft (DFG) Grossgeräteinitiative 2010. This research was supported by the Graduate School of Information Science in Health (GSISH) and the TUM Graduate School. This study was supported in part by SFB824. No other potential conflict of interest relevant to this article was reported.
Footnotes
↵* Contributed equally to this work.
Published online Nov. 11, 2011.
- © 2011 by Society of Nuclear Medicine
REFERENCES
- Received for publication May 4, 2011.
- Accepted for publication October 4, 2011.


Jump to section
Related Articles
Cited By...
- Nigrostriatal dopaminergic integrity in relation to prefrontal cortex activity and gait performance during dual-task walking in older adults
- Effect of Acute Hypoxia Exposure on the Availability of A1 Adenosine Receptors and Perfusion in the Human Brain
- Concurrent mapping of Electrical, Chemical, and Functional Neuroactivity
- Impact of 18F-FDG PET/MRI on Therapeutic Management of Women with Newly Diagnosed Breast Cancer: Results from a Prospective Double-Center Trial
- Connecting the Dots: Approaching a Standardized Nomenclature for Molecular Connectivity Combining Data and Literature
- Thalamic blood flow and EEG frequency band power during hyperventilation in idiopathic generalized epilepsy
- High-temporal resolution functional PET/MRI reveals coupling between human metabolic and hemodynamic brain response
- A genetic variation in the adenosine A2A receptor gene contributes to variability in oscillatory alpha power in wake and sleep EEG and A1 adenosine receptor availability in the human brain
- caliPER: A software for blood-free parametric Patlak mapping using PET/MRI input function
- Performance Evaluation of the uEXPLORER Total-Body PET/CT Scanner Based on NEMA NU 2-2018 with Additional Tests to Characterize PET Scanners with a Long Axial Field of View
- Investigating Low-Dose Image Quality in Whole-Body Pediatric 18F-FDG Scans Using Time-of-Flight PET/MRI
- A Stepping-Stone to Fully Integrated Whole-Body PET/MRI (perspective on "Performance Measurements of the Siemens mMR Integrated Whole-Body PET/MR Scanner" J Nucl Med. 2011;52:1914-1922)
- Brain amyloid {beta}, cerebral small vessel disease, and cognition: A memory clinic study
- Performance Evaluation of the Vereos PET/CT System According to the NEMA NU2-2012 Standard
- Synthesis of Patient-Specific Transmission Data for PET Attenuation Correction for PET/MRI Neuroimaging Using a Convolutional Neural Network
- Development of a Dedicated Rebinner with Rigid Motion Correction for the mMR PET/MR Scanner, and Validation in a Large Cohort of 11C-PIB Scans
- Performance of a PET Insert for High-Resolution Small-Animal PET/MRI at 7 Tesla
- PET Imaging Stability Measurements During Simultaneous Pulsing of Aggressive MR Sequences on the SIGNA PET/MR System
- Simulation of Tracer Dose Reduction in 18F-FDG PET/MRI: Effects on Oncologic Reading, Image Quality, and Artifacts
- PET/MRI for Oncologic Brain Imaging: A Comparison of Standard MR-Based Attenuation Corrections with a Model-Based Approach for the Siemens mMR PET/MR System
- Studies of a Next-Generation Silicon-Photomultiplier-Based Time-of-Flight PET/CT System
- 4-Dimensional MRI and Attenuation Map Generation in PET/MRI with 4-Dimensional PET-Derived Deformation Matrices: Study of Feasibility for Lung Cancer Applications
- Imaging the Cytokine Receptor CXCR4 in Atherosclerotic Plaques with the Radiotracer 68Ga-Pentixafor for PET
- Feasibility of Multiparametric Imaging with PET/MR in Head and Neck Squamous Cell Carcinoma
- Variations in PET/MRI Operations: Results from an International Survey Among 39 Active Sites
- PET/MRI of Hypoxic Atherosclerosis Using 64Cu-ATSM in a Rabbit Model
- Bombesin-Targeted PET of Prostate Cancer
- Decoding Intratumoral Heterogeneity of Breast Cancer by Multiparametric In Vivo Imaging: A Translational Study
- Simultaneous Multiparametric PET/MRI with Silicon Photomultiplier PET and Ultra-High-Field MRI for Small-Animal Imaging
- Impact of MR-Based Attenuation Correction on Neurologic PET Studies
- Effect of Attenuation Correction on Regional Quantification Between PET/MR and PET/CT: A Multicenter Study Using a 3-Dimensional Brain Phantom
- 18F-FDG PET/CT and PET/MRI Perform Equally Well in Cancer: Evidence from Studies on More Than 2,300 Patients
- Impact of Point-Spread Function Modeling on PET Image Quality in Integrated PET/MR Hybrid Imaging
- Fast Patch-Based Pseudo-CT Synthesis from T1-Weighted MR Images for PET/MR Attenuation Correction in Brain Studies
- Beyond 18F-FDG: Characterization of PET/CT and PET/MR Scanners for a Comprehensive Set of Positron Emitters of Growing Application--18F, 11C, 89Zr, 124I, 68Ga, and 90Y
- Whole-Body PET/MR Imaging: Quantitative Evaluation of a Novel Model-Based MR Attenuation Correction Method Including Bone
- Shine-Through in PET/MR Imaging: Effects of the Magnetic Field on Positron Range and Subsequent Image Artifacts
- MR-Based Attenuation Correction Using Ultrashort-Echo-Time Pulse Sequences in Dementia Patients
- Evaluation of Gynecologic Cancer with MR Imaging, 18F-FDG PET/CT, and PET/MR Imaging
- Evaluation of 18F-Fluoride PET/MR and PET/CT in Patients with Foot Pain of Unclear Cause
- Techniques, Benefits, and Challenges of PET-MR
- Integrated 18F-FDG PET/MR Imaging in the Assessment of Cardiac Masses: A Pilot Study
- Combined PET/MR: A Technology Becomes Mature
- Motion Correction Strategies for Integrated PET/MR
- Hybrid PET/MR Imaging: An Algorithm to Reduce Metal Artifacts from Dental Implants in Dixon-Based Attenuation Map Generation Using a Multiacquisition Variable-Resonance Image Combination Sequence
- An SPM8-Based Approach for Attenuation Correction Combining Segmentation and Nonrigid Template Formation: Application to Simultaneous PET/MR Brain Imaging
- Segmentation-Based MR Attenuation Correction Including Bones Also Affects Quantitation in Brain Studies: An Initial Result of 18F-FP-CIT PET/MR for Patients with Parkinsonism
- Radiotracer Dose Reduction in Integrated PET/MR: Implications from National Electrical Manufacturers Association Phantom Studies
- Combined PET/MRI Improves Diagnostic Accuracy in Patients with Prostate Cancer: A Prospective Diagnostic Trial
- Systematic Comparison of the Performance of Integrated Whole-Body PET/MR Imaging to Conventional PET/CT for 18F-FDG Brain Imaging in Patients Examined for Suspected Dementia
- Preclinical and Translational PET/MR Imaging
- Principles of PET/MR Imaging
- PET/MR Imaging in the Detection and Characterization of Pulmonary Lesions: Technical and Diagnostic Evaluation in Comparison to PET/CT
- Performance of Whole-Body Integrated 18F-FDG PET/MR in Comparison to PET/CT for Evaluation of Malignant Bone Lesions
- Improvement of Attenuation Correction in Time-of-Flight PET/MR Imaging with a Positron-Emitting Source
- Clinical and research applications of simultaneous positron emission tomography and MRI
- Implementation and Performance Evaluation of Simultaneous PET/MR Whole-Body Imaging with Continuous Table Motion
- MR-Based Attenuation Correction Methods for Improved PET Quantification in Lesions Within Bone and Susceptibility Artifact Regions
- Systematic Evaluation of Phantom Fluids for Simultaneous PET/MR Hybrid Imaging
- PET and MR Imaging: The Odd Couple or a Match Made in Heaven?
- Respiratory Motion Correction in Oncologic PET Using T1-Weighted MR Imaging on a Simultaneous Whole-Body PET/MR System
- Hybrid PET/MR Imaging of the Heart: Potential, Initial Experiences, and Future Prospects
- Comparison of Segmentation-Based Attenuation Correction Methods for PET/MRI: Evaluation of Bone and Liver Standardized Uptake Value with Oncologic PET/CT Data
- First Clinical Experience with Integrated Whole-Body PET/MR: Comparison to PET/CT in Patients with Oncologic Diagnoses