


Abstract
A spatial bias in brain PET/MR exists compared with PET/CT, because of MR-based attenuation correction. We performed an evaluation among 4 institutions, 3 PET/MR systems, and 4 PET/CT systems using an anthropomorphic brain phantom, hypothesizing that the spatial bias would be minimized with CT-based attenuation correction (CTAC). Methods: The evaluation protocol was similar to the quantification of changes in neurologic PET studies. Regional analysis was conducted on 8 anatomic volumes of interest (VOIs) in gray matter on count-normalized, resolution-matched, coregistered data. On PET/MR systems, CTAC was applied as the reference method for attenuation correction. Results: With CTAC, visual and quantitative differences between PET/MR and PET/CT systems were minimized. Intersystem variation between institutions was +3.42% to −3.29% in all VOIs for PET/CT and +2.15% to −4.50% in all VOIs for PET/MR. PET/MR systems differed by +2.34% to −2.21%, +2.04% to −2.08%, and −1.77% to −5.37% when compared with a PET/CT system at each institution, and these differences were not significant (P ≥ 0.05). Conclusion: Visual and quantitative differences between PET/MR and PET/CT systems can be minimized by an accurate and standardized method of attenuation correction. If a method similar to CTAC can be implemented for brain PET/MRI, there is no reason why PET/MR should not perform as well as PET/CT.
The introduction of clinical PET/MR represents a milestone in neurologic imaging in which the complementary features of MR and PET offer novel developments (1,2). For PET, accurate image quantification is essential when determining receptor binding and treatment response and when measuring SUVs (3).
However, quantitative accuracy remains inconsistent between PET/MR and PET/CT systems, with MR-based attenuation correction (MRAC) suspected of being the main source of bias (3–5). MRAC remains a challenge, as MR images do not correspond to electron density and cannot be directly translated to μ-values (6,7). Currently, conversion to μ-values is performed via image segmentation (6–8).
Although MRAC is feasible for whole-body imaging, large and spatially varying biases exist in brain PET/MR because of exclusion of bone in MRAC and incorrect segmentation of air cavities (3–5). These biases cannot be minimized merely by image postprocessing and must be compensated accordingly (9). An accurate, standardized attenuation correction method is needed to remove the differences.
Currently, CT-based attenuation correction (CTAC) is an established standard (8) and is often considered the gold standard. Measured Hounsfield units (HUs) are converted to μ-values by simple bilinear scaling (10–12). Therefore, a multicenter evaluation between PET/MR and PET/CT systems with CTAC and an anthropomorphic phantom would be highly desirable for determining image quantification in a controlled manner.
Previous PET/MR investigations have been conducted with National Electrical Manufacturers Association whole-body or Hoffman phantoms, which do not model attenuation realistically and have not specifically addressed brain PET/MR (5,13,14). However, an anatomic brain phantom that has recently been developed models gray matter uptake and has a realistic head contour, including air spaces and the attenuation effect of bone (15,16). In this study, PET/MR and PET/CT systems were compared using this anatomic brain phantom and CTAC. The objective was to determine, in a multicenter setting, whether attenuation correction is the largest factor affecting regional quantification between PET/MR and PET/CT systems when other factors have been minimized.
MATERIALS AND METHODS
Study Design
The evaluation involved 4 institutions, 4 PET/CT systems, and 3 PET/MR systems from major vendors: a Discovery 690 PET/CT system (GE Healthcare) and an Ingenuity TF PET/MR system (Philips Healthcare) at Turku PET Centre; an mCT PET/CT system (Siemens Healthcare) and an mMR PET/MR system (Siemens Healthcare) at Rigshospitalet, Copenhagen; a Discovery 690 PET/CT system and a Signa PET/MR system (GE Healthcare) at the PET Centre of University Hospital Zurich; and a Gemini TF64 PET/CT system (Philips Healthcare) at Hokkaido University Hospital, Sapporo. The performance characteristics of the systems have been previously described (1,2,17–20).
Phantom Characteristics
The phantom was created from an MRI acquisition of a healthy volunteer using 3-dimensional (3D) printing (16). The phantom has a realistic head contour with compartments for radioisotope and bone (Supplemental Fig. 1; supplemental materials are available at http://jnmt.snmjournals.org) (16). Essentially, nonpathologic 18F-FDG uptake in gray matter and the attenuation of the human skull are modeled by a maximum of 2% variation between phantoms (16). The main material is a transparent photo-curable polymer with a μ-value of 0.101 cm−1 at 511 keV (16). The skull compartment is fillable with a solution of K2HPO4 salts and water, where using 100 g of K2HPO4 in 67 g of water achieves a μ-value of 0.1514 cm−1, close to that of cranial bone (0.1453 cm−1 at 511 keV) (21).
PET Acquisition
Measurements at Turku, Copenhagen, and Zurich were performed with the same phantom, whereas a different phantom was used at Sapporo. The skull compartment was filled with K2HPO4 solution from the same batch at Turku and Zurich. Separate batches were prepared at Sapporo and Copenhagen. The gray matter compartment was filled with 18F-FDG at each site. The measurements are listed in Table 1 in the order in which the scans were performed. Activity ranged from 82 MBq (Ingenuity TF) to 23 MBq (mCT) at the start of scanning. Measurements were performed in list mode, with a 15- to 20-min duration for high image quality. Anatomic reference images were acquired with a separate CT scan.
Acquisition and Reconstruction Details
MRAC and CTAC
Attenuation correction was performed with CTAC and MRAC. For PET/CT, standard low-dose CTAC data were collected and converted to μ-values (10–12). A tube voltage of 120 keV was used at each institution. For PET/MR, the following sequences with corresponding tissue classes were acquired: 3D T1-weighted fast field echo (air, soft tissue), 4-compartment Dixon (fat, soft tissue, air), 3-compartment ultrashort echo time (bone, soft tissue, air), and LAVA-Flex (GE Healthcare) (fat, soft tissue, air), referred to as MRAC.
Concerning μ-values, 3D T1-weighted fast field echo assigns 0.096 cm−1 for soft tissue, ignoring air. Four-compartment Dixon assigns 0.100 cm−1 for soft tissue and 0.085 cm−1 for fat and includes air. Ultrashort echo time assigns 0.100 cm−1 for soft tissue and 0.151 cm−1 for bone and includes air. LAVA-Flex is similar to Dixon, except the μ-values are assigned as a weighted average.
PET Reconstruction
Reconstruction parameters are listed in Table 1. The static high-iteration dataset from the measurement duration was iteratively reconstructed, to minimize the reconstruction-specific bias between systems. A high number of iterations was used for reaching reconstruction convergence and minimizing partial-volume effects (22). For the Zurich Discovery 690, only a low number of iterations were used, whereas for the Signa a low and high number of iterations was used for on- and off-site comparisons, respectively. For matching reconstruction parameters between systems, time-of-flight and resolution modeling were not applied. For the Ingenuity TF and the Gemini TF64, the binary large-object parameters were as follows: α = 6.3716, r = 2.8, increment = 2.0375, and λ = 0.035. Both systems lacked an option for postprocessing filter selection. For the mCT and the mMR, a 2-mm gaussian postprocessing filter was the minimal option.
CTAC for PET/MR
For PET/MR, PET data were reconstructed first with MRAC and then with CTAC from a PET/CT scanner at the institution. The pipelines for CTAC processing are described below.
For the Ingenuity TF, the head holder in CTAC was segmented out and the phantom was coregistered and resliced to anatomic MRAC. HUs were converted into μ-values by bilinear transformation (11). Finally, CTAC was smoothed to PET resolution (23). MATLAB, version 2011b (MathWorks Inc.), and SPM8 (Wellcome Trust Centre for Neuroimaging, University College London) were used in image processing.
For the mMR, CTAC was processed as previously described (4). The head holder and bed were segmented out and the CTAC was registered to PET/MR images using rigid registration. HUs were converted by bilinear scaling implemented in the mCT PET/CT system (12). For the Signa, the μ-map from the Zurich Discovery 690 was used. In principle, the μ-map generated internally by the PET/CT data was registered to the MR μ-map and inserted into the reconstruction algorithm using in-house programs in MATLAB. Thus, no conversion to μ-values was needed.
Image Processing and Analysis
PET images were coregistered and resliced to a reference volume using rigid registration on SPM8. The reference volume was 140 × 140 × 140 with 1.22-mm isotropic resolution. Gaussian postfiltering was applied for negating the remaining differences due to scanner resolution and image noise, using an 8-mm filter as recommended (9).
Volumes of interest (VOIs) were defined in Carimas, version 2.7 (Turku PET Centre). First, 2-dimensional regional contours were delineated manually using a reference CT scan coregistered and resliced to the reference volume. Second, 3D anatomic VOIs were created by combining regional contours slice-by-slice using automatic segmentation.
VOIs were divided into a deep-brain region and 7 cortical regions. The cortical VOIs were (in order of volume) orbitofrontal, temporal, cingulate, parietooccipital, medial frontal, cerebellar, and lateral frontal (Fig. 1). The deep-brain VOI, basal ganglia, was defined as a combination of the caudate nucleus, putamen, and thalamus. The cortical VOIs ranged in size from 97 to 8 cm3, and the basal ganglia VOI was 17 cm3.

Visualization of VOI (red) fused on digital reference smoothed to PET resolution. AU = arbitrary units.
Count-Based Normalization in SPM8
For relative comparison of image quantification between systems, PET data were count-normalized to remove the bias due to differences in global counts between systems. For this purpose, a simple proportionality model is presented, which has been previously introduced (24) and mathematically validated (25). In the model (Eq. 1), each observed count  at any pixel i for any phantom scan j can be described by constant of proportionality
  for pixel i, where
  indicates global counts for the scan and
  is the error term:
 Eq. 1Generally, Equation 1 can be written as a linear equation (Eq. 2), where an observed count
  at any pixel i can be written as a sum of effects, both independent
  and dependent
  , of global counts
  .
. Eq. 2Thus, the contribution of global counts
  in a phantom scan j should be minimized for relative comparison of the spatial differences between scans. In clinical assessment, a global mean or a reference region is used (5,26). We used the sum of total counts
  in each individual phantom scan j to minimize the effect of global count differences. Thereafter, spatial differences were compared visually and quantitatively.
Visual Evaluation
In visual comparison, anatomic MR and μ-maps were compared with CTAC. PET images were compared with a digital reference image of the phantom, created by segmenting the gray matter volume from a high-resolution MR image (15,16). The digital reference served as a gold standard for visual evaluation, allowing a nearly ideal radioactivity distribution (15,16). Digital reference images were processed identically to PET images in SPM8.
Quantitative Evaluation of CTAC
In quantitative evaluation, CTAC images were coregistered and resliced to the reference volume. Thereafter, HUs were extracted using anatomic VOIs from the PET evaluation. We report the mean HU of each VOI and PET/CT system at each institution. Additionally, the maximum, median, mean, and SD of the μ-values in the phantom were measured by automatic segmentation, ignoring air, and by manual VOI delineation with a single VOI, including air. The extracted HUs were converted to μ-values by bilinear transformation (11).
Quantitative Evaluation of PET
Count-normalized and postprocessed PET images were compared using VOI analysis. For each VOI, we evaluated the relative difference  between a target system
  and the reference system
  , expressed generally as follows:
 Eq. 3For PET/CT,
  was compared with 3 systems,
  , located outside the institution. From this, the relative mean difference between
  and
and  was calculated as
  , defined in Equation 4. For example, a PET/CT system at institution 1 was compared with PET/CT systems at institutions 2, 3, and 4 as follows:
 Eq. 4For PET/MR, a target system
  was compared with a PET/CT system
  at the institution and with
  . For onsite comparison, the relative difference
  between
  and
and  was calculated as follows:
 Eq. 5Then, similarly to Equation 4,
  was compared with
  . From this, the relative mean difference
  between
  and
and  was calculated as follows:
 Eq. 6We report Equations 4 and 6 for each PET/CT and PET/MR system as a function of VOI. Additionally, we report Equation 5 for PET/MR as a function of the system and VOI. In Equation 5, the Signa and the Zurich Discovery 690 were compared using low-iteration images to match reconstruction convergence for on-site comparison.
Finally, VOIs were graphed in a box-and-whisker plot as a function of the system and VOI to determine the spread of count-normalized data. A Student paired t test with a significance threshold of P < 0.05 was used to determine statistically significant differences between VOIs across all systems and between systems across all VOIs.
RESULTS
Visual Evaluation of μ-Maps
Figure 2 shows anatomic MR and CT images (Fig. 2A), as well as MR-based μ-maps and digital reference images (Fig. 2B), at the level of the basal ganglia. PET/MR systems showed the liquid compartments of the skull and gray matter but not the solid polymer structures (Fig. 2A). Thus, the polymer was classified as air in all MR-based μ-maps. Phantom structures were accurately replicated only in CT.

(A) MR and CT images of phantom. (B) MR-based μ-maps and digital reference. CT images show all phantom structures, whereas polymer structure is invisible on MR and is classified as air on MR-based μ-maps. UTE = ultrashort echo time.
Visual Evaluation of PET
Figure 3 shows digital reference and PET/CT images (Fig. 3A), PET/MR images with MRAC (Fig. 3B), and PET/MR images with CTAC (Fig. 3C). PET/CT and the digital reference agreed well (Fig. 3A). MRAC images had large areas of underestimation due to segmentation errors (Fig. 3B). The Ingenuity TF was closest to the digital reference because only the phantom scalp was neglected. All PET/MR images with CTAC agreed well with PET/CT and the digital reference (Fig. 3C).
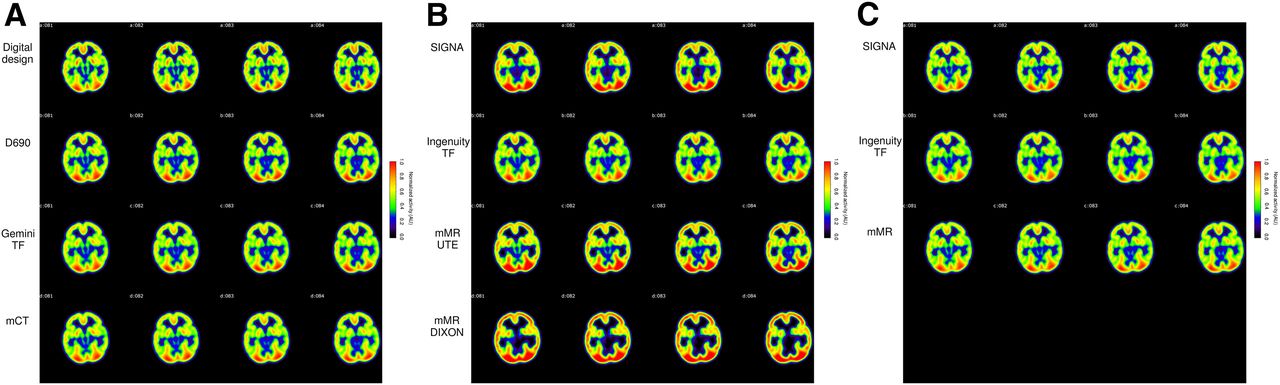
(A) Digital reference and PET/CT images. (B) PET/MR images with MRAC. (C) PET/MR images with CTAC. PET/CT and digital reference agree well. Effect of classifying polymer as air in MRAC can clearly be seen, whereas using CTAC for PET/MR brings PET/MR to agreement with PET/CT and digital reference. UTE = ultrashort echo time.
Quantitative Evaluation of CTAC
Figure 4 shows HUs measured from CTAC at each institution as a function of VOI. Table 2 contains the μ-values. In general, HUs and μ-values varied only slightly. In particular, the mediofrontal cortex, lateral frontal cortex, cerebellum, and parietooccipital cortex were consistent institutionwise (Fig. 4). Differences were seen only in the Copenhagen and Sapporo measurements.
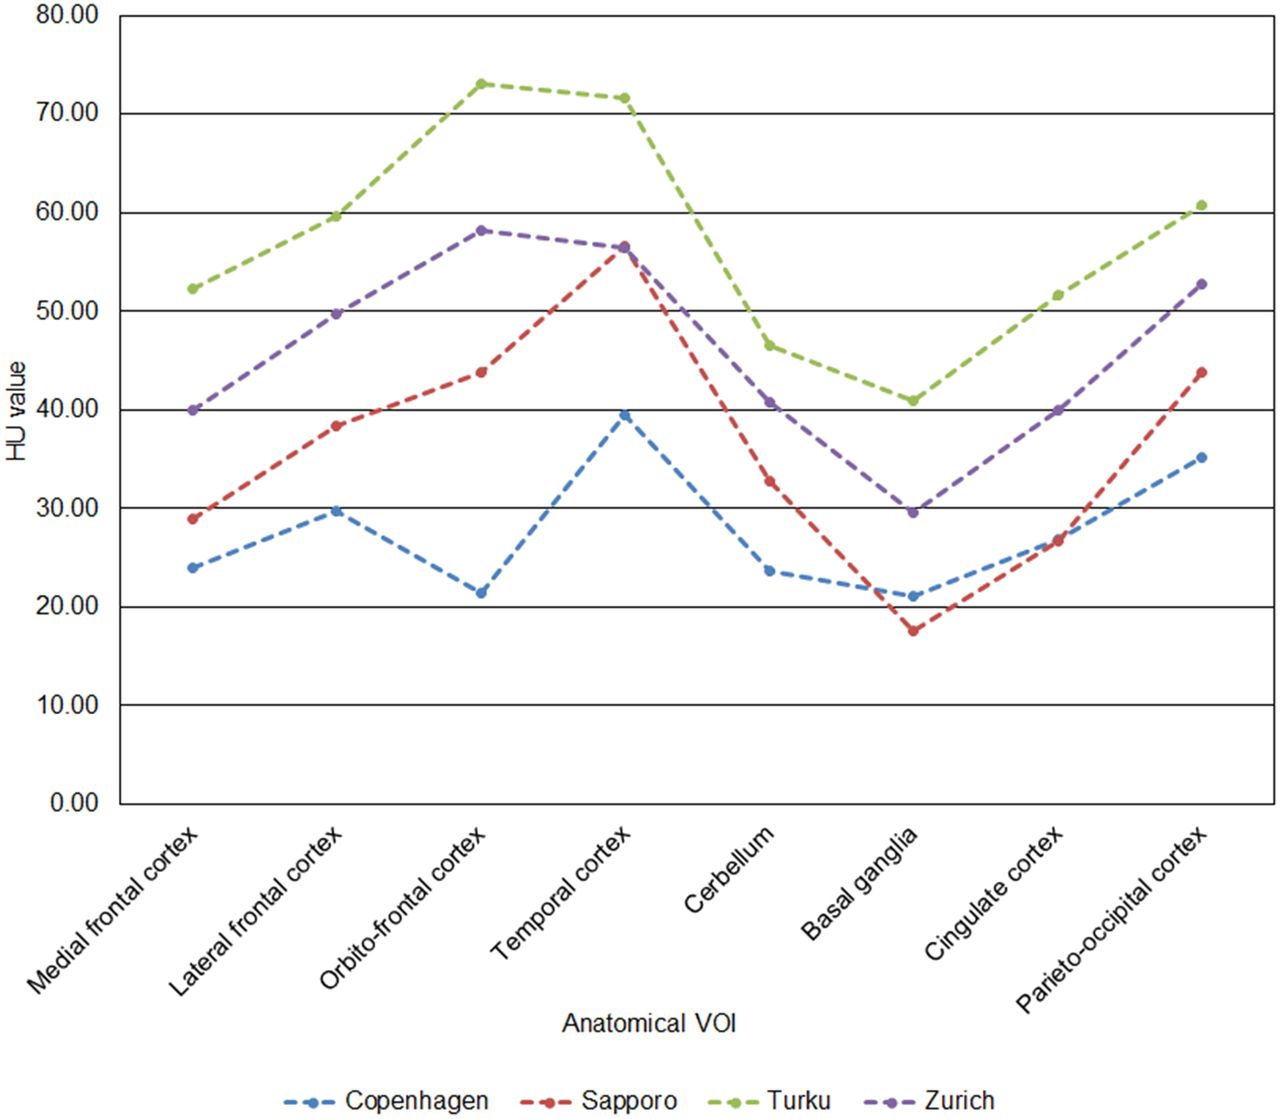
HUs as function of anatomic VOI at each institution. HUs show little variation, especially between Copenhagen, Turku, and Zurich, where same phantom was used.
Measured μ-Values
At Copenhagen, the HU in the orbitofrontal cortex was lower (21.50) than at the other institutions (43.80, 73.11, and 58.29). At Sapporo, minor variations were seen in the temporal cortex (56.54), being the second highest, and in the basal ganglia (17.64) and cingulate cortex (26.73), being the lowest. Regarding μ-values, the Sapporo phantom had the highest maximum (0.162 cm−1), mean (0.112 cm−1, 0.0934 cm−1), and SD (0.018 cm−1) (Table 2).
Quantitative Evaluation of PET
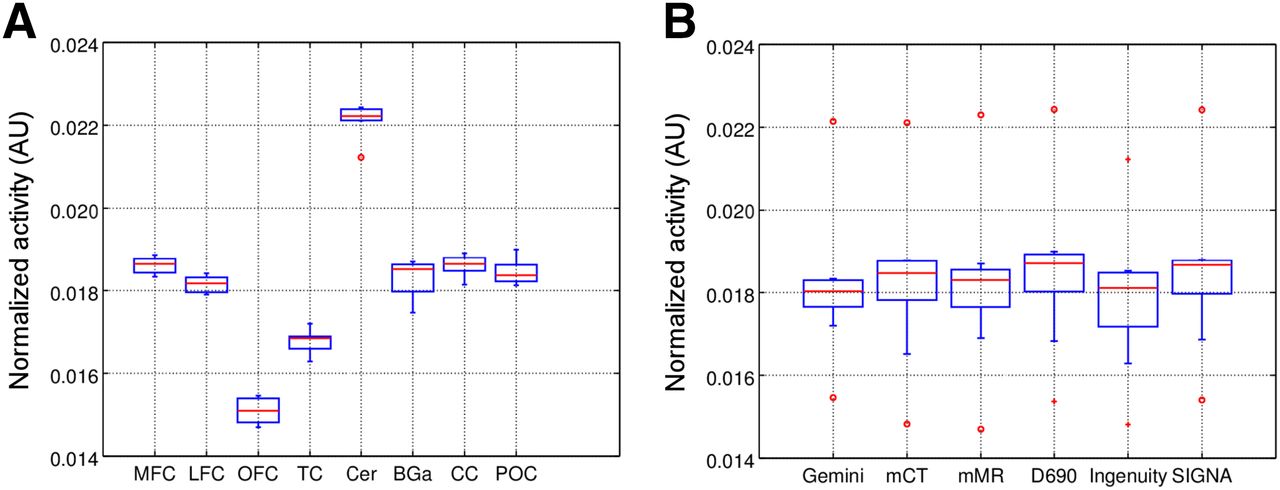
The results from Equations 4–6 are summarized in Figures 5–7. Figure 5 shows the results from Equations 4 and 6 as a function of VOI. Figure 6 shows the results from Equation 5 as a function of VOI (Fig. 6A) and system (Fig. 6B). Figure 7 shows a box-and-whisker plot of VOIs as a function of system (Fig. 7A) and VOI (Fig. 7B).

Regional comparison of PET/CT and PET/MR systems (Eqs. 4 and 6). Mediofrontal cortex, lateral frontal cortex, cingulate cortex, and parietooccipital cortex agree well between systems. Ingenuity TF shows negative bias, whereas Gemini TF64 shows the largest variation between regions. MFC = medial frontal cortex; LFC = lateral frontal cortex; OFC = orbitofrontal cortex; TC = temporal cortex; Cer = cerebellum; BGa = basal ganglia; CC = cingulate cortex; POC = parietooccipital cortex.

Relative differences in PET/MR systems within institution by system (A) and by region (B) (Eq. 5). PET/MR systems agree well with PET/CT systems. Ingenuity TF shows the largest difference. MFC = medial frontal cortex; LFC = lateral frontal cortex; OFC = orbitofrontal cortex; TC = temporal cortex; Cer = cerebellum; BGa = basal ganglia; CC = cingulate cortex; POC = parietooccipital cortex.

VOIs in box-and-whisker plot systemwise (A) and regionally (B). Excellent agreement is seen systemwise. Red bars denote median values, defining upper and lower quartiles. Whiskers indicate difference in quartiles by 1.5 times the interquartile range. Circles and crosses indicate outliers in each dataset. AU = arbitrary units; MFC = medial frontal cortex; LFC = lateral frontal cortex; OFC = orbitofrontal cortex; TC = temporal cortex; Cer = cerebellum; BGa = basal ganglia; CC = cingulate cortex; POC = parietooccipital cortex.
All PET/MR and PET/CT systems agreed well systemwise and regionwise, with differences being less than 5% across all VOIs (Fig. 5). The Signa and the Turku Discovery 690 showed positive bias (0% to 3%), whereas the Ingenuity TF showed negative bias (−1% to −4%). In the mMR and the mCT, bias varied from −3% to 2%, whereas the Gemini TF64 varied the most (−3% to 3%). The largest differences were in the orbitofrontal cortex for the mCT (−3.13%) and the mMR (−3.29%), in the parietooccipital cortex (3.42%) for the Turku Discovery 690, in the basal ganglia (2.07%) for the Signa, in the cerebellum (−4.50%) for the Ingenuity TF, and in the temporal cortex (3.07%) for the Gemini TF64.
Within institutions, all PET/MR systems agreed well with PET/CT (Fig. 6). For the mMR and the Signa, bias was less than 3%, and for the Ingenuity TF, bias was less than 6%. The Ingenuity TF had the largest underestimations, which occurred in the cerebellum (−5.37%), basal ganglia (−5.83%), and parietooccipital cortex (−4.60%).
Systemwise, PET/CT and PET/MR systems agreed well, with no significant differences (Fig. 7A) being found on Student t testing (P > 0.05) (Supplemental Table 1). Regionwise, the orbitofrontal cortex (P ≤ 0.01), temporal cortex (P ≤ 0.01), and cerebellum (P ≤ 0.01) differed significantly from other regions (Fig. 7B). Finally, the lateral frontal cortex differed significantly only from the mediofrontal cortex (P ≤ 0.05) and cingulate cortex (P ≤ 0.05).
DISCUSSION
In this study, an anatomic brain phantom with realistic head contour and skull attenuation was used to evaluate the effect of attenuation correction on visual and quantitative differences between PET/MR and PET/CT. To the best of our knowledge, this was the first such investigation, and it was conducted in a multicenter setting covering 4 institutions and 7 systems.
Regional differences between PET/MR and PET/CT systems were minimized with CTAC. Although small differences remained, these were not significant and existed both for PET/MR and for PET/CT. Thus, other than differences in the applied attenuation correction, there should be no reason for a PET/MR system to perform differently from a PET/CT system.
Visual Evaluation of μ-Maps and PET Images
Phantom materials were identified as a limitation on the quality of MR-based μ-maps, as none of the MR sequences could be applied optimally. The polymer remained invisible because of short T2/T2* relaxation, resulting in the classification of solid structures as air (Fig. 2B). Only the liquids inside the phantom could be visualized (Fig. 2A). The Ingenuity TF μ-map had the best quality, despite the fact that the polymer scalp remained invisible. Phantom materials have been considered challenging for PET/MR (13,14). Therefore, comparison of MR-based μ-maps is not likely to be clinically relevant.
Consistent with the μ-maps, MRAC-reconstructed data contained artifacts (Fig. 3B), except in the case of the Ingenuity TF, which had an artifact-free μ-map. CTAC-reconstructed data had excellent agreement with PET/CT and the digital reference (Figs. 3A and 3C), consistent with clinical reports (3–5). Therefore, only transmission-based methods can be considered reliable for generating phantom μ-maps on PET/MR. However, several promising MRAC-methods exist for generating patient μ-maps. Clinical atlas-based MRAC could be one possible approach, as a recent study suggests (27), with the reported bias being similar in magnitude to that in our study.
Quantitative Evaluation of CTAC
HUs followed a similar trend between institutions. The largest difference—at Copenhagen—was found in the orbitofrontal cortex because of a 2.066-mL air bubble (Fig. 4). The Sapporo measurement differed slightly in the temporal cortex, basal ganglia, and cingulate cortex (Fig. 4). However, in the HU range of −1,200 (air) to 1,500 (bone), these variations were small.
Measured μ-values agreed well (Table 2) and were close to those expected for the polymer and skull (16,21). The Sapporo measurement had the highest maximum and mean μ-values (Table 2). The use of a different phantom and batch of skull solution at Sapporo was the likely cause of variations in CTAC.
Quantitative Evaluation of PET
PET/MR and PET/CT systems agreed well in all comparisons. No clearly definable, large bias was detected (Fig. 5). In general, residual bias was small (±4%), statistically insignificant, and of similar magnitude to that in clinical populations when an independent CT scan was used for PET/MR reconstruction, similarly to our phantom study (3–5). This regional bias might be further reduced by time-of-flight imaging, especially when ignoring bone attenuation (14).
PET/MR and PET/CT systems within an institution differed from +2% to −6% (Fig. 6A). The Ingenuity TF had the largest difference (−2% to −6%), whereas for the mMR and the Signa the difference was ±2% (Fig. 6B). The range of bias was the same for all PET/MR systems, ±4%. Uncertainties in system cross-calibration may also contribute to residual bias. Considering the phantom, 3% variation was reported for PET/CT (15,16).
All PET/CT and PET/MR systems performed similarly (Fig. 7A). Regionally, the orbitofrontal cortex, temporal cortex, and cerebellum had the largest variations, and these were statistically significant (Fig. 7B). However, because of resolution nonuniformity in the field of view, small spatial differences will remain even after postprocessing (9).
Finally, from a clinical perspective, using a registered patient CT scan for MRAC should reduce the bias in PET/MR images to a level seen in PET/CT. However, a phantom offers nearly ideal registration accuracy because of rigid anatomy. The registration accuracy of CTAC or a pseudo-CT scan will affect quantitative accuracy in clinical studies, as has been hypothesized (27). However, no investigations of the effects of registration accuracy have yet been performed.
Limitations and Remaining Error Sources
This study focused on evaluating relative differences between systems. Evaluation of absolute activity recovery between systems was not feasible, since cross-calibration was not performed. Because intersystem performance was harmonized to achieve uniformity, the advantage of time-of-flight and other technical features could not be investigated. Implementing optimized reconstruction protocols and novel MRAC may improve the quantitative performance without the need for CTAC (14,27). Scatter correction was not studied, as CTAC was used and the systems conformed to the National Electrical Manufacturers Association 2007 standard, assuming similar performance between measurements. Dead time, randoms, normalization, and calibration were not evaluated, each of which also has an effect. Technical factors such as phantom orientation, filling, VOI definition, remaining resolution differences after filtering, image registration, and interpolation will introduce variability, in addition to PET/MR-specific factors such as MR coils (9,28). However, residual biases were generally small. Ultimately, these factors should be studied closely in the future to further evaluate and eventually harmonize the performance between systems.
CONCLUSION
Visual and quantitative consistency among PET/MR and PET/CT systems can be achieved by using a standardized, accurate method for attenuation correction. If attenuation correction in PET/MR can be conducted with CTAC or a similar method, there is no reason why PET/MR should not perform as well as PET/CT in clinical brain imaging.
DISCLOSURE
The costs of publication of this article were defrayed in part by the payment of page charges. Therefore, and solely to indicate this fact, this article is hereby marked “advertisement” in accordance with 18 USC section 1734. This study was conducted within the Finnish Center of Excellence in Molecular Imaging in Cardiovascular and Metabolic Research by a strategic Japanese–Finnish research cooperation, “Application of Medical ICT Devices,” supported both by the Academy of Finland (269977), University of Turku, Turku University Hospital, and by Åbo Akademi University. This work was also supported by the Doctoral Programme of Clinical Investigation, University of Turku. Gaspar Delso is an employee of GE Healthcare. No other potential conflict of interest relevant to this article was reported.
Acknowledgments
We thank Dr. Eero Rissanen for assistance in defining the anatomic VOIs.
Footnotes
Published online Jan. 28, 2016.
- © 2016 by the Society of Nuclear Medicine and Molecular Imaging, Inc.
REFERENCES
- Received for publication September 2, 2015.
- Accepted for publication January 4, 2016.


