


Abstract
Attenuation correction (AC) with an ultrashort echo time (UTE) sequence has recently been used in combination with segmentation for cortical bone identification for brain PET/MR studies. The purpose of this study was to evaluate the quantification of 18F-fluoropropyl-carbomethoxyiodophenylnortropane (18F-FP-CIT) binding in brain PET/MR, particularly focusing on effects of UTE-based AC including bone segmentation. Methods: Sixteen patients with initially suspected parkinsonism were prospectively enrolled. An emission scan was acquired 110 min after 18F-FP-CIT injection on a dedicated PET/MR scanner, immediately followed by another emission scan using a PET/CT scanner 120 min after the injection. A UTE-based attenuation map was used to classify the voxels into 3 tissues: bone, soft tissue, and air. All PET images were spatially normalized, and a specific-to-nonspecific dopamine transporter (DAT) binding ratio (BR) was calculated using statistical probabilistic anatomic mapping. The level of agreement was assessed with intraclass correlation coefficients (ICCs). Voxelwise comparison between PET images acquired from PET/MR and PET/CT was performed. We compared non–attenuation-corrected images to analyze UTE-based AC effects on DAT quantification. Results: BR in the putamen obtained from PET/MR and PET/CT showed low interequipment variability, whereas BR in the caudate nucleus showed significant variability (ICC = 0.967 and 0.682 for putamen and caudate nucleus, respectively). BR in the caudate nucleus was significantly underestimated by PET/MR, compared with PET/CT (mean difference of BR = 0.66, P < 0.0001). Voxelwise analysis revealed that PET/MR showed significantly low BR in the periventricular regions, which was caused by a misclassification of the ventricle as air on the attenuation map. We also compared non-AC images, revealing low interequipment variability even in the caudate nucleus (ICC = 0.937 and 0.832 for putamen and caudate nucleus, respectively). Conclusion: Our data demonstrate spatial bias of the DAT BR on 18F-FP-CIT PET/MR. Voxelwise analysis and comparison to non-AC images identified the misclassification of ventricle as air to be the cause of bias. To obtain reliable quantification for brain PET/MR studies including 18F-FP-CIT PET, alternative and more reliable segmentation strategies are required.
CT images from hybrid devices such as a PET/CT scanner have been used for γ-ray attenuation correction (AC) and anatomic localization (1,2). However, CT images have limitations in PET quantification in the brain structures due to the lack of soft-tissue differentiation. In brain PET imaging, 18F-fluoropropyl-carbomethoxyiodophenylnortropane (18F-FP-CIT) has been widely used for evaluation of Parkinsonian syndrome as dopaminergic system imaging (3,4). For quantification of dopamine transporter (DAT) density, manually drawn regions of interest or software-based coregistered additional MR images have been used to overcome the issues regarding striatal segmentation (5–7). However, previously used coregistration methods could be inaccurate, particularly in the case of DAT images because of the possibility of misregistration between the 2 different images (8,9).
Currently, hybrid PET/MR systems are being used in clinical studies. Simultaneous acquisition of PET and MR images can solve the above issues regarding brain structure definition and coregistration. Before making use of simultaneously acquired MR for anatomically accurate PET quantification, routinely acquired brain PET/MR should be proved to be equivalent to previous PET/CT scanners.
In PET/MR systems, one of the difficulties to be adopted in clinical routine is MR-based AC (10). Various techniques have been suggested to derive an attenuation map (11). Commercial PET/MR systems today use segmentation-based AC based on an attenuation map derived from MR images. They separate MR images into 3 tissue segments (soft tissue, lung, and air) (12) or 4 tissue segments (water, fat, lung, and air) (13). However, bone segmentation using MR is not routinely performed in commercial PET/MR systems because it is hard to distinguish bone with standard pulse sequences (10), even though ignoring bone for AC significantly affects PET activity quantification (14–16).
Recently, a new method has been introduced to distinguish bone using an ultrashort echo time (UTE) sequence (17,18). When a UTE sequence is used, cortical bone structures can be distinguished by short relaxation time. UTE sequences have been applied to segmentation-based AC including bone to reduce the bone attenuation–related bias. However, previous studies revealed that UTE-based AC had errors in determining a boundary between soft tissue and air (18,19). Thus, bone segmentation in PET/MR systems remains an important issue, and several protocols and algorithms have been developed.
For quantitative analysis, static PET images can be used when 18F-FP-CIT reaches equilibrium binding in the brain, because a simple ratio of regional counts is proportional to binding potential (20,21). However, it remains unclear whether quantitative 18F-FP-CIT binding potential acquired from PET/MR is concordant with that from PET/CT because of the differences in AC methods and hardware. As we previously discussed, to maximize advantages of simultaneously acquired MR in PET/MR scanners, an agreement between PET/MR and PET/CT in quantification should be first tested.
The purpose of our study was to assess the quantification of 18F-FP-CIT binding using PET/MR, compared with PET/CT. We applied UTE-based segmentation to obtain attenuation maps to minimize the effects of neglecting bone. Interequipment agreement between PET/MR and PET/CT was assessed on prospectively enrolled patient data, and we analyzed quantification bias of 18F-FP-CIT PET/MR with regard to UTE-based AC.
MATERIALS AND METHODS
Patients
Sixteen patients (8 men, 8 women; mean age, 61.3 y; age range, 39–77 y) with initially suspected Parkinson disease were prospectively enrolled. This study was approved by the Institutional Review Board of our institute. All study participants signed an informed consent form.
The following were inclusion criteria: subjects were older than 20 y and were clinically suspected of having parkinsonism due to tremor, rigidity, or hypokinesia.
PET/CT and PET/MR Acquisition
Patients underwent PET/CT and PET/MR after an injection of 185 MBq (5 mCi) of 18F-FP-CIT. Emission scans were acquired 110 min after injection using a PET/MR scanner (Biograph mMR; Siemens Healthcare) for 10 min. Another emission scan was acquired using a PET/CT scanner (Biograph mCT; Siemens Healthcare), immediately after the first emission scan, followed by a CT scan for AC (mean start time difference between PET/MR and PET/CT, 14.3 min; range, 11.2–19.7 min).
PET images from the PET/CT and PET/MR were reconstructed using an iterative algorithm (ordered-subset expectation maximization). The reconstructed protocols were 24 subsets/5 iterations and 21 subsets/5 iterations on the PET/CT and PET/MR scanners, respectively, because numbers of 24 subsets were not available on our PET/MR system. The matrix size of all PET images was 256 × 256, and a 4-mm gaussian postreconstruction filter was applied.
MR imaging on our PET/MR system included a UTE sequence, performed with a repetition time of 11.9, echo time 1 (TE1) of 0.07, and echo time 2 (TE2) of 2.46 ms; flip angle of 10°; and 192 × 192 matrix size. The slice thickness was 1.6 mm, and field of view was 300 × 300 mm. AC maps were generated on the software incorporated into our PET/MR system using a segmentation-based approach. In brief, an R2 map, the inverse of the T2 relaxation time, was used for distinguishing cortical bone and soft tissue. R2 was calculated by 2 different echo times. where I1 and I2 are the signal intensity at TE1 and TE2. To classify soft tissue and air density, a region-growing method was used. A mask of patients was derived to find the outer contour of patients using MR images with TE1. All voxels were classified into 3 tissues, including cortical bone, soft tissue, and air (18). The AC maps were generated by Biograph mMR software (version VB18P; Siemens) following the manufacturer’s instructions. The maps used the predefined attenuation coefficient of each tissue (0.151 cm−1 for cortical bone, 0.100 cm−1 for soft tissue, and 0 cm−1 for air). Precomputed AC maps of local radiofrequency coils were used to minimize the hardware-related bias. Compared with the hardware components used for PET/CT acquisition, earplugs were additionally applied for PET/MR scans; however, they were not taken into account for further AC.
PET Image Analysis
We first performed visual analysis of 18F-FP-CIT PET images. Two nuclear medicine physicians visually assessed DAT density in the striatum by consensus. We classified 18F-FP-CIT PET scans into 2 groups: patients with or without nigrostriatal degeneration. PET scans acquired by PET/CT and PET/MR scanners were independently assessed and compared.
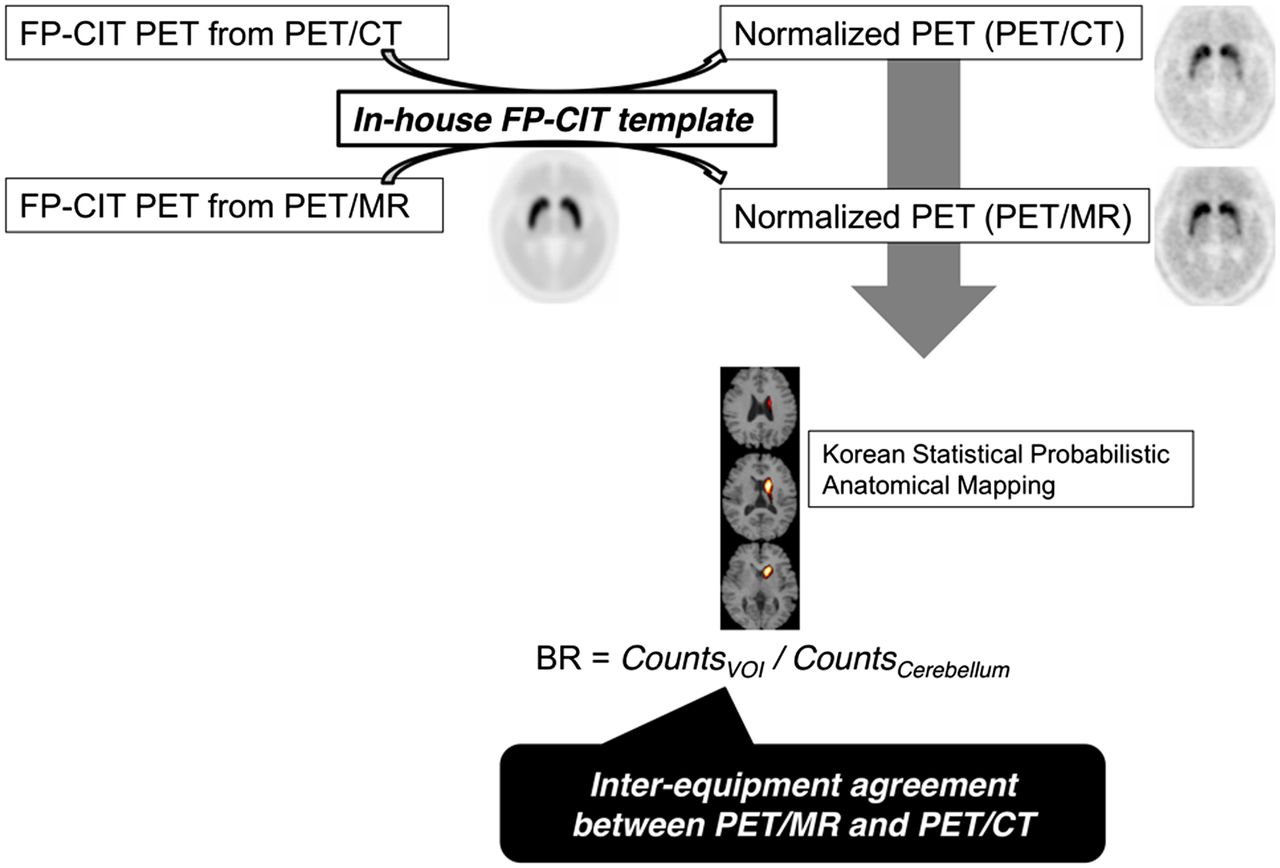
All the PET images were spatially normalized into an in-house 18F-FP-CIT PET template (5,22). PET counts in the putamen, caudate nucleus, and cerebellum were calculated using statistical probabilistic anatomic mapping (23). We calculated the specific-to-nonspecific binding ratio (BR), defined as BR = (Cspecific – Cnonspecific)/Cnonspecific. PET counts of cerebellum were used as nonspecific counts, and BR of putamen (BRputamen) and BR of caudate nucleus (BRcaudate) were calculated. We independently calculated the BR of bilateral striatum for each patient. The BR obtained from PET/CT and PET/MR was directly compared, and the level of agreement was assessed with intraclass correlation coefficients (ICCs). BR obtained from PET images before AC (non-AC PET) was calculated from PET/CT and PET/MR. Neither patients’ attenuation factors nor hardware components were included for PET image reconstruction. BR calculated by the non-AC PET images was an inaccurate value for clinical purpose because quantification of 18F-FP-CIT binding in deep gray matters is affected by attenuation. The purpose of BR obtained from non-AC images was to evaluate whether the difference between PET/CT and PET/MR was related to AC. The method for the image comparison analyses is summarized in Figure 1.

Schematic workflow for image processing and quantification. PET scans acquired from PET/MR and PET/CT were spatially normalized to Korean Statistical Probabilistic Anatomic Mapping template. BR was calculated using statistical probabilistic maps of putamen and caudate nucleus. Interequipment agreement between PET/MR and PET/CT was calculated. VOI = volume of interest.
To evaluate spatial bias in PET/MR, a voxelwise analysis was also performed. Spatially normalized PET images from PET/CT and PET/MR were smoothed by a gaussian filter of 12 mm in full width at half maximum. PET counts in voxels were scaled into BR, and a paired t test was performed on a voxel basis between PET images from PET/CT and PET/MR. Image processing was performed using statistical parametric mapping (SPM5; University College of London). Uncorrected P values of less than 0.001 were set as the significance threshold, and an extent threshold of 100 contiguous voxels was applied. In addition, the difference between PET images from PET/CT and PET/MR was calculated on a voxel basis.
Statistics
Continuous variables are expressed as mean ± SD. ICCs and their 95% confidence intervals (CIs) were calculated to test the interequipment variability—that is, PET images from PET/CT and PET/MR (1-way random-effects model with absolute agreement). An ICC of 1 means perfect agreement, and an ICC greater than 0.8 is generally considered as excellent reliability (24). Bland–Altman plots were drawn to find interequipment variability. Statistical analyses were performed with MedCalc software (MedCalc 12).
RESULTS
Patients’ Characteristics and Visual Assessment
Detailed information on all patients is shown in Table 1. According to the clinical features and physical examinations, the initial diagnosis of 14 patients was Parkinson disease and that of the other 2 patients was tremor not fulfilling the clinical diagnostic criteria for Parkinson disease. Twelve of the 14 patients with suspected Parkinson disease showed reduced DAT density on visual assessment. Two of them showed normal DAT density on visual assessment. The 2 patients with suspected non-Parkinsonian syndrome showed normal DAT density. The visual assessments of 18F-FP-CIT PET/MR and PET/CT were performed, and patients were classified into the 2 groups: patients with decreased and preserved DAT density. The visual classification based on PET/CT was in agreement with that based on PET/MR.
Demographic Data of All Patients
Quantification of BR: Comparison of PET/CT and PET/MR
BRputamen calculated from PET/CT and PET/MR showed excellent interequipment agreement, whereas BRcaudate showed comparable interequipment variability (ICC, 0.967; 95% CI, 0.841–0.989, and ICC, 0.682; 95% CI, −0.185–0.908 for putamen and caudate nucleus, respectively). The mean difference was 0.23 ± 0.28 for BRputamen and 0.66 ± 0.33 for BRcaudate. Figure 2 shows BR for all bilateral striata calculated from PET/CT and PET/MR. We constructed Bland–Altman plots to visually check the reliability between PET/CT and PET/MR (Figs. 2C and 2D). BRputamen and BRcaudate showed narrow CIs; however, BRcaudate on PET/MR was consistently lower than that on PET/CT.
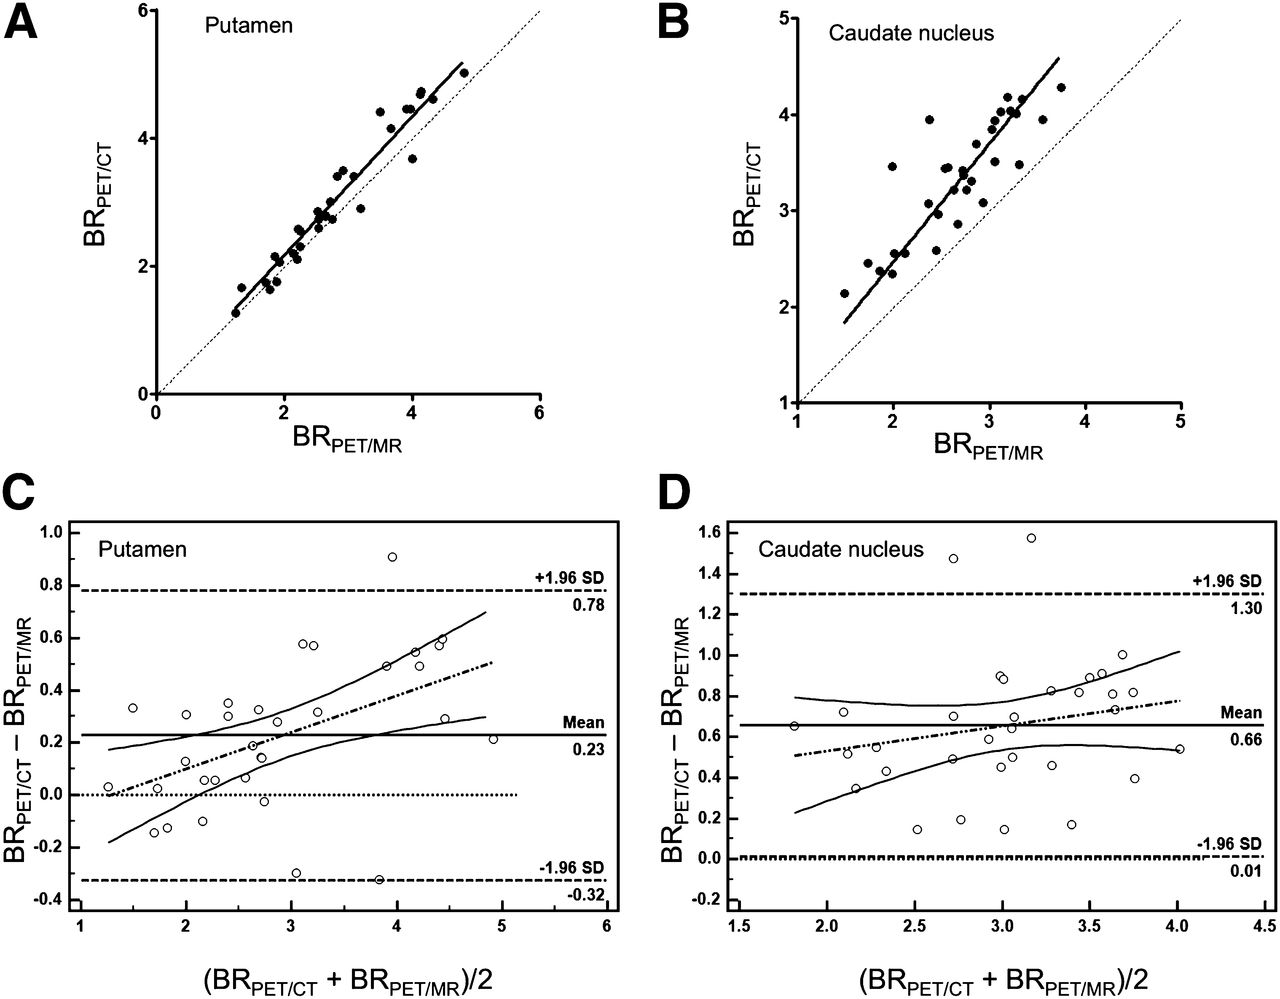
(A) DAT BR of PET/MR and PET/CT. BR of putamen calculated from PET/MR and PET/CT showed excellent interequipment agreement. ICC of BR was 0.967 (95% CI, 0.841–0.989). (B) BR of caudate nucleus calculated from PET/MR was underestimated, compared with PET/CT. ICC of BR was 0.682 (95% CI, −0.185–0.908). Bland–Altman plots show interequipment agreement in putamen (C) and caudate nucleus (D). Bland–Altman plot of caudate nucleus shows comparable variability between BR calculated from PET/MR and PET/CT, compared with putamen, which showed considerable mean difference of BR (0.23 ± 0.28 for putamen and 0.66 ± 0.33 for caudate nucleus).
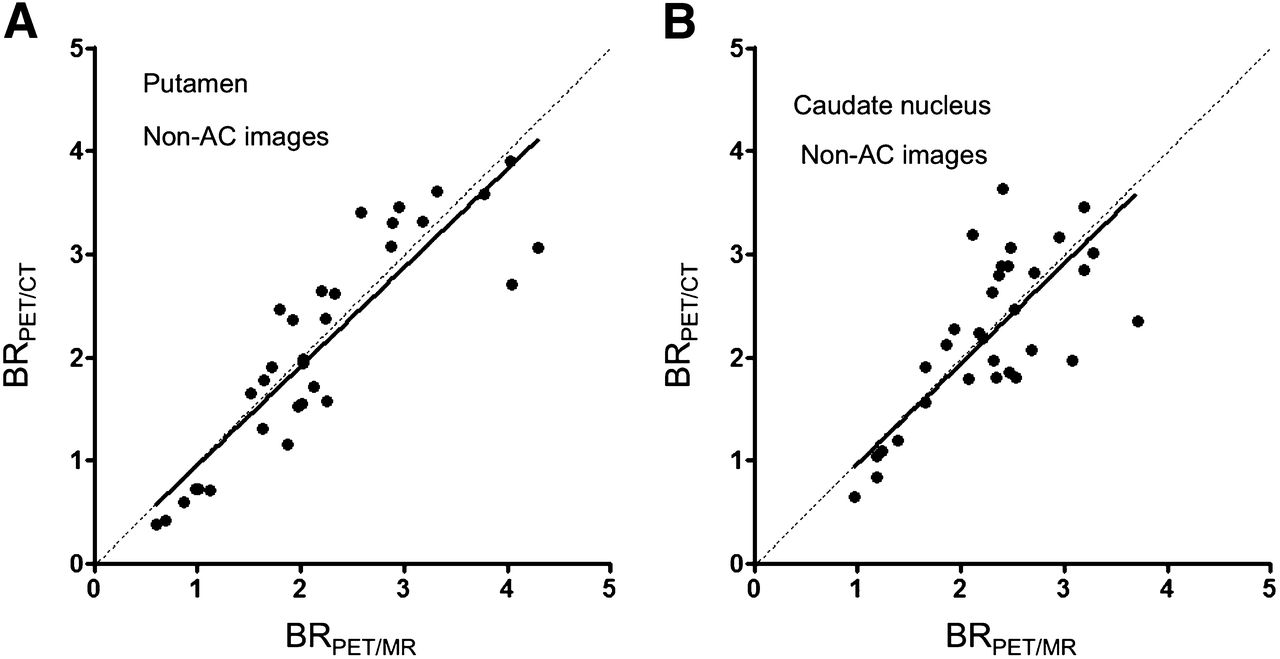
We compared non-AC images from PET/CT and PET/MR to check whether UTE-based AC affected DAT BR quantification. Figure 3 shows BR for all bilateral striata calculated from non-AC images. BRcaudate and BRputamen showed excellent interequipment reliability when non-AC images were used (ICC, 0.937; 95% CI, 0.873–0.969, and ICC, 0.832; 95% CI, 0.655–0.918 for putamen and caudate nucleus, respectively).

BR of PET/MR and PET/CT calculated from non-AC images. BR of putamen (A) and caudate nucleus (B) shows excellent interequipment agreement when non-AC images are applied (ICC, 0.937; 95% CI, 0.873–0.969, and ICC, 0.832; 95% CI, 0.655–0.918 for putamen and caudate nucleus, respectively).
Voxelwise Analysis and Comparison of Attenuation Maps
To find the regions affected by UTE-based AC, voxelwise analysis was performed. A paired t test between PET images revealed that DAT BR in PET/MR was significantly lower in the periventricular area (Fig. 4). When UTE-based attenuation maps were used, significant portions of lateral ventricles were misclassified as air, causing underestimated BR in the periventricular area (Fig. 5). The misclassification of ventricles was consistently found in all the patients. The voxelwise difference map revealed underestimation in the periventricular area involving the caudate nucleus and lateral ventricles (Fig. 5D).

Voxelwise comparison between PET/MR and PET/CT. Image shows underestimated voxels in PET/MR using UTE sequence–based AC, compared with PET/CT (uncorrected P < 0.001 as a threshold with an extent threshold of 100 contagious voxels).
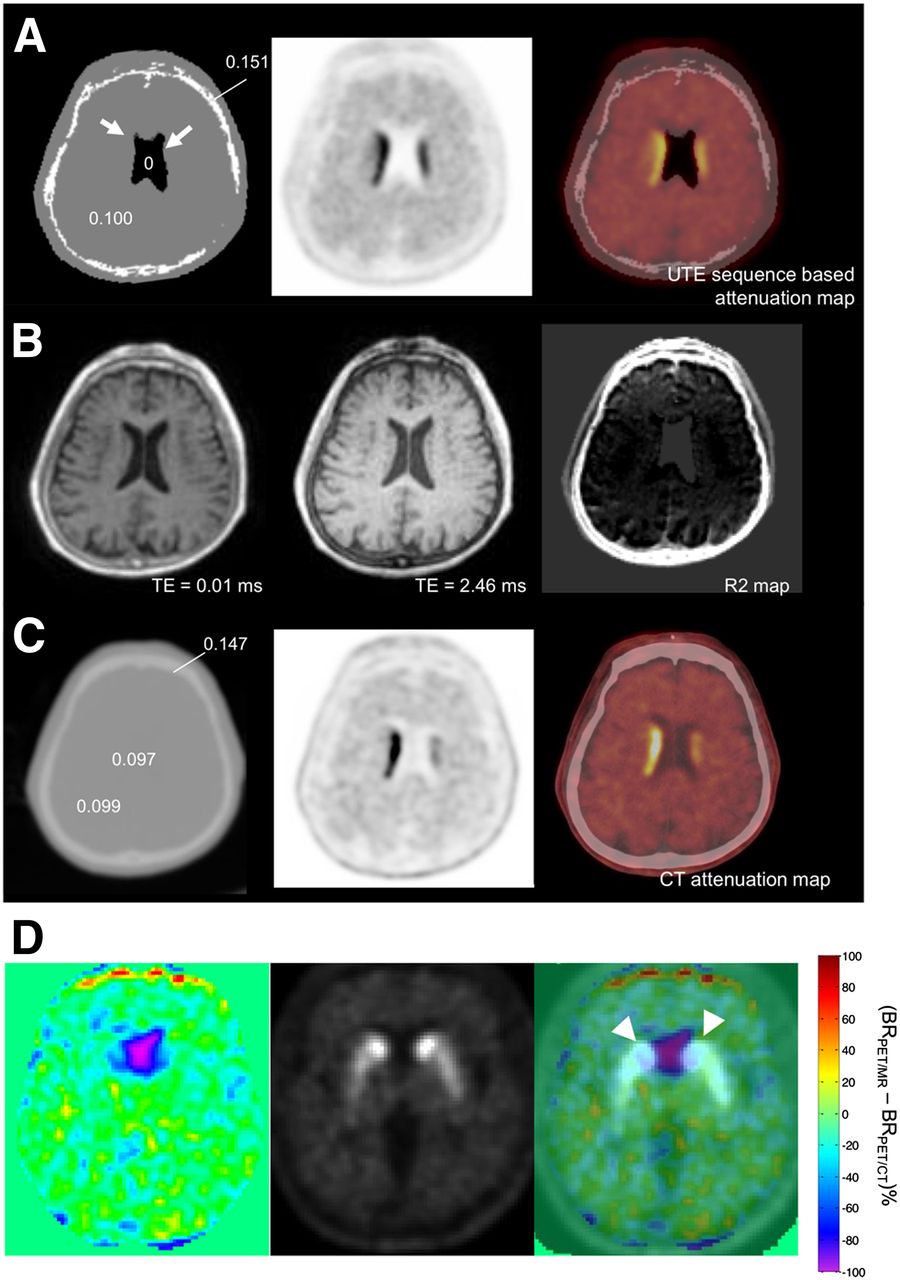
Representative images of UTE sequence–based AC and CT-based AC. (A) UTE sequence–based attenuation maps show misclassified voxels in lateral ventricle as air (arrow). (B) UTE images and R2 maps for tissue classification. UTE images were acquired at echo times TE1 (0.07 ms)/TE2 (2.46 ms), and R2 map is derived from 2 images after air mask. (C) CT-based attenuation map shows water attenuation in lateral ventricle. Difference in attenuation maps of PET/MR and PET/CT affects quantification of DAT BR. Numbers on attenuation map of PET/MR (A) and PET/CT (C) reveal attenuation coefficients of each region (cm−1). Representative 1-cm-sized circular regions of interest were drawn on lateral ventricle, cortical bone, and brain tissue on CT-based attenuation map. (D) Difference image in percentage BR between PET images from PET/MR and PET/CT showed underestimation in lateral ventricles. Fusion images of difference map and 18F-FP-CIT PET image showed that underestimation of BR was found in lateral ventricle, which overlapped caudate nucleus (arrowheads).
DISCUSSION
In this study, we identified a difference in 18F-FP-CIT binding measured by PET/MR and PET/CT. The difference was mostly found in the caudate nucleus, and the voxelwise analysis revealed underestimated BR in periventricular areas in PET/MR, compared with PET/CT. To elucidate the difference, UTE-sequence-based attenuation maps were inspected, because non-AC images showed excellent interequipment agreement. We speculated that a misclassification of ventricles as air in UTE-based attenuation maps significantly caused underestimated BR in the caudate nucleus in PET/MR.
It is important to obtain accurate quantification in brain PET for clinical application considering development of quantitative image-based biomarkers and multicenter prospective trials. In particular, dopamine transporter imaging has been regarded as a biomarker for nigrostriatal dopaminergic dysfunction; thus, 18F-FP-CIT binding was evaluated in several clinical trials (25,26). Of course, quantification of 18F-FP-CIT binding has been a major issue in the clinical trials for a comparison between patients and serial follow-up for nigrostriatal degeneration. In this context, spatially and temporally coregistered MR combined with PET may have advantages in accurate definition of structures for quantification.
Though PET/MR has advantages in anatomic registration and brain tissue segmentation, it remains unclear whether brain PET/MR and PET/CT data are interchangeable. One of the most important problems was the inaccuracy of AC (10). Because Dixon sequence–based tissue segmentation to separate fat, soft tissue, and air is incorporated in dedicated PET/MR scanners, it has been regarded as a routine protocol in clinical whole-body PET/MR (27). However, it is difficult to differentiate bone from soft tissue using Dixon-based AC. Because the brain is surrounded by cortical bone, attenuation maps not accounting for bone necessarily lead to bias in quantification (15). UTE sequence–based bone segmentation has been regarded as an alternative to generate attenuation maps accounting for cortical bone. Despite taking account of bone attenuation, UTE-based attenuation maps had limitations in bony segmentation, resulting in incompleteness of bone tissue followed by underestimation of counts (28). Our data on UTE-based attenuation maps using PET/MR, compared with PET/CT, consistently demonstrated the incompleteness of cortical bone segmentation (Fig. 5). Moreover, we found that the thickness of cortical bone on UTE sequence–based AC maps in all cases was lower than on CT images on visual inspection, possibly also affecting AC. Nevertheless, attenuation maps accounting for cortical bones were regarded as better quantification for gray matter uptake than Dixon-based AC methods (28). As the difference map represented (Fig. 5), spatial quantification bias was more prominent in the periventricular area than in the cerebral neocortex, suggesting that cortical bone–related bias could be partly corrected by UTE sequence–based AC despite the incompleteness of bone segmentation.
We showed spatial bias particularly in the caudate nucleus in 18F-FP-CIT PET/MR, compared with PET/CT, though UTE sequence–based AC accounting for cortical bone was engaged. The spatial bias was caused by problems in differentiating soft tissue from air, which was different from previous reports with regard to ignoring bone attenuation. Though UTE sequence–based AC can separate bone, our results demonstrated additional problems in soft-tissue segmentation for generating optimal AC maps. Voxelwise analysis showed underestimated 18F-FP-CIT BR in the periventricular area—that is, bilateral caudate nuclei. Previous studies revealed that UTE sequence–based AC had difficulties in determining the boundaries between air and soft tissue (18,19). For instance, bone tissues around paranasal sinuses were challenging when UTE sequence–based attenuation maps were applied (29). In our study, we found spatial bias in UTE sequence–based AC, which was a misclassification of cerebrospinal fluid space as air in attenuation maps. The findings were consistently observed in all patients despite the different extent of misclassification. Previous studies using UTE sequence–based segmentation also showed that a small fraction of the cerebrospinal fluid was misclassified as air (17,19).
Though MR-based AC has limitations, simultaneously acquired emission scans and MR data potentially have advantages in spatial registration during scan acquisition, compared with PET/CT scans. Thus, the optimal AC in PET/MR might provide accurate quantification with precise MR-based anatomic segmentation, though we used statistical probabilistic anatomic mapping rather than individual brain segmentation in this study. A new algorithm is required to obtain the accurate boundaries between air and soft tissue to solve the misclassification issue and eventually calculate reliable quantification.
We found excellent interchangeability (ICC for putamen was 0.937, and ICC for caudate nucleus was 0.832; ICC > 0.8 means statistically excellent interchangeability (24)) when non-AC data were applied. Furthermore, we visually inspected whether inaccurate AC maps directly distorted PET images from PET/MR and found that there was no significant difference between PET/CT and PET/MR. Those findings strongly suggest that differences in PET detectors have little effect on quantification. In our study, although we used PET/MR and PET/CT scanners from the same manufacturer, PET detectors were substantially different (30). Moreover, scan time and imaging protocols were not perfectly matched. Nevertheless, we obtained excellent ICC in non-AC data, implying that improved AC protocols in PET/MR promise accurate quantification equivalent to PET/CT.
In our results, other factors related to hardware components and reconstruction methods could affect the spatial bias of DAT BR. For the comparison of non-AC images, attenuation could be affected because the hardware components of the PET/MR scanner were different from those of the PET/CT scanner. In particular, non-AC images from PET/MR excluded attenuation of hardware components such as patient bridge or radiofrequency coils as well as patients’ attenuation. Although the equipment has not been considered in the non-AC for PET/MR, it is unlikely that this exclusion resulted in the mitigation of underestimation of caudate nucleus activity shown in the attenuation-corrected data. The equipment would make a similar global impact on the putamen and caudate nucleus in terms of the AC factor because of the relatively long distance from these structures to the equipment. Both PET/MR and PET/CT used almost the same reconstruction parameters as ordered-subset expectation maximization; however, the number of subsets was different (21 for PET/MR and 24 for PET/CT). We tested whether the number of subsets affected quantification of DAT BR, comparing PET images reconstructed by 12 and 24 subsets. The number of subsets had negligible effects on DAT BR quantification (the ICCs and 95% CIs were 0.999 and 0.998–1.000, respectively, for the putamen and 0.995 and 0.66–1.00, respectively, for the caudate nucleus) (Supplemental Fig. 1; supplemental materials are available at http://jnm.snmjournals.org).
The PET/MR study protocol, particularly UTE sequence–based AC, has recently been developed but not optimized. In the future, if the performance of UTE sequence–based tissue segmentation can be improved, accurate quantification of neuroreceptors or transporters will be achieved. One of the limitations of this study was serial PET protocols, PET/CT acquisition immediately after PET/MR. Thus, dynamic changes in 18F-FP-CIT binding between the two scans were not fully considered. Although BR calculated from 90- to 120-min static images showed excellent correlation with binding potential (20,21), dynamic changes in 18F-FP-CIT binding might partly result in the underestimation of striatal BR in PET/MR. Nevertheless, taking the non-AC PET data into consideration, we speculated that quantification bias in PET/MR was mainly affected by the AC method. Additionally, BRcaudate fluctuated even when calculated by non-AC images, which could be related to more errors in quantification in the caudate nucleus than putamen due to small size. Despite the fluctuation, the underestimation of BRcaudate on PET/MR was not found in non-AC images.
CONCLUSION
UTE sequence–based AC for 18F-FP-CIT PET/MR caused spatial bias in quantification even though attenuation maps accounted for cortical bones. DAT BR was considerably underestimated in the caudate nucleus because of cerebrospinal fluid space misclassified as air in lateral ventricles. Because non-AC images showed remarkable interchangeability between PET/MR and PET/CT despite differences in PET detectors, a new algorithm for AC in PET/MR will improve quantification in brain PET.
DISCLOSURE
The costs of publication of this article were defrayed in part by the payment of page charges. Therefore, and solely to indicate this fact, this article is hereby marked “advertisement” in accordance with 18 USC section 1734. This study was supported by the Intramural Research Grant of Seoul National University and grant 0420130670 (2013-1290) from the SNU Research Fund. No other potential conflict of interest relevant to this article was reported.
Acknowledgments
We thank Hyun-joon An and Yong Ho Do for their support during this study.
Footnotes
Published online Aug. 11, 2014.
- © 2014 by the Society of Nuclear Medicine and Molecular Imaging, Inc.
REFERENCES
- Received for publication February 7, 2014.
- Accepted for publication July 21, 2014.


