


Abstract
In current PET/MR systems, the data acquisition paradigm is based on a multistation examination, imaging the patient from hip to head. This strategy has potential limitations, especially in terms of workflow and PET acquisition efficiency. In this work, the technical implementation of simultaneous PET and MR data acquisition with continuous table motion (CTM) is presented. PET and MR data acquired with CTM are evaluated in terms of image quality with respect to table motion speed. Methods: Phantom, volunteer, and patient data were acquired on an integrated whole-body PET/MR system. Phantom experiments were used to systematically quantify image quality parameters including signal-to-noise ratio, geometric distortions, and artifacts in PET and MR scans as a function of different table speeds. Volunteer scans (n = 4) allowed evaluation of CTM MR protocols in a realistic setting, and patient scans (n = 3) were obtained to validate the technique in a clinical workflow. Results: In phantoms, PET image quality, signal-to-noise ratio, geometry, and artifact behavior were found not to be influenced by continuous table motion over the evaluated table motion speeds from 0.8 to 4.6 mm/s. This also holds true for PET patient data where acquisitions were performed with varying table speeds of up to 46 mm/s. For MR, in most scans image quality of CTM scans was found to be comparable to the identical sequence acquired in multistation mode; however, some sequence features (e.g., signal intensity normalization) with impact on MR contrast are currently missing for CTM MR sequences. Conclusion: Data acquisition with continuous table motion in the PET/MR versus multistation acquisition scheme provides data of comparable quality in both PET and MR. This new acquisition paradigm potentially can provide a higher flexibility in simultaneous PET and MR whole-body data acquisition and facilitate examination planning and PET/MR hybrid imaging workflow.
Whole-body hybrid imaging with PET/MR when compared with PET/CT is a relatively complex and protracted diagnostic examination (1). The length of an integrated PET/MR hybrid examination is determined by factors such as patient preparation, examination planning, simultaneous data acquisition for PET and MR, number of bed positions necessary for patient coverage, data reconstruction, and image reading (2–4). To reduce overall examination times, this workflow needs to be streamlined and optimized to achieve a maximum of diagnostic information in the shortest possible time. One option to streamline the factors examination planning and simultaneous PET and MR data acquisition is to implement continuous table motion (CTM) instead of conventional multistation data acquisition. Before clinical implementation of CTM it must, however, be ensured that image quality and quantifiability in PET and MR are not degraded, compared with traditional multistation data acquisition.
The workflow of integrated PET/MR systems currently is based on the one known from PET/CT: first, the PET field of view (FOV) is placed and it is decided how many static acquisition positions are needed to cover the required anatomy. On the basis of these fixed bed positions, the MR sequences are planned. Here it must be noted that the position of the patient bed is fixed during PET data acquisition for that bed position and thus limits the flexibility of the MR scans.
In recent work, we demonstrated that hybrid PET/MR with CTM as an alternative acquisition approach is technically feasible and enables greater flexibility in simultaneously acquiring PET and MR data (5). PET/MR with CTM could potentially overcome some of the workflow restrictions mentioned and enable a faster and easier acquisition workflow. Furthermore, the use of CTM in PET allows reducing the need for overlap between neighboring stations and thus results in improved homogeneity over large FOVs (5).
CTM in MR has been an active area of research for some years (6–10). Several sequences are available for clinical use, and it can be expected that in the future more sequences will use this technique. In PET and in hybrid PET/CT, the concept of CTM data acquisition was investigated (11–14) but never found its way into clinical routine.
The aim of this study was to move simultaneous PET/MR with CTM from a technical concept closer toward clinical use. In this work, CTM PET data processing has been developed that uses the same reconstruction software as the PET/MR system for multistation acquisitions, resulting in quantitative PET images.
For clinical performance evaluation and for the development of a CTM PET/MR workflow, the influence of different table speeds on PET image quality and PET quantification has been evaluated on phantoms and in patients. Furthermore, a systematic evaluation of image quality of existing MR imaging protocols that use CTM with respect to table motion speed and a systematic side-by-side comparison to their multistation counterparts has been performed on phantoms and in volunteers and patients.
MATERIALS AND METHODS
PET/MR System
Scanning was performed on an integrated whole-body PET/MR scanner (Biograph mMR; Siemens AG), which features fully integrated PET acquisition capabilities within a 3.0-T MR magnet (2,4).
Several MR sequences available from the scanner manufacturer support CTM data acquisition (syngo TimCT software package; Siemens AG) and will be described in more detail in the following sections.
For the PET system, only the static multistation acquisition approach is clinically supported, thus also limiting the readily available simultaneous PET/MR workflow to conventional multistation acquisitions.
PET Data Acquisition, Processing, and Reconstruction
For CTM PET acquisitions, the PET unit has to be started via the command line, retaining the CTM capabilities of the MR system as in MR-only mode. PET data are acquired in list-mode format containing table position and timing tags.
Custom processing software is used to perform rebinning of list-mode data into sinogram format. Unlike in the regular rebinning process, the table position is considered for each event and the plane coordinate is modified accordingly (5), resulting in a sinogram with an enlarged plane dimension as compared with a standard sinogram without table motion. All other parameters of the sinograms are consistent with multistation acquisitions.
Furthermore, it is necessary to correct the sinograms for the specific table trajectory by considering at which time points data were acquired for a specific plane (5). Additionally, the scanner-generated component-based normalization files have to be adapted by calculating a weighted sum of physical crystal elements where the weighting is derived from the table trajectory.
PET data reconstruction is performed by a software package provided by the manufacturer of the scanner (e7-tools; Siemens Medical Solutions Inc.). This package is equivalent to the reconstruction software on the scanner used in this work and is limited to reconstructing multistation sinograms in the standard physical scanner geometry. To allow CTM reconstruction nonetheless, subsinograms corresponding to the physical scanner geometry are extracted from the virtually enlarged CTM sinogram with a user-defined bed-overlap (Supplemental Fig. 1; available at http://jnm.snmjournals.org), which was chosen to be identical to the standard physical bed overlap of 30 planes for multistation acquisitions.
Multistation scans were reconstructed equivalently to CTM scans. The reconstruction consists of an ordinary Poisson ordered-subset expectation maximization algorithm with 3 subsets, 21 iterations, in-plane matrix size of 172 × 172 pixels, voxel size of 4.17 × 4.17 × 2.03 mm, and 3-dimensional (3D) gaussian postreconstruction filtering (width, 4.0 mm). Attenuation correction, scatter correction, and various other state-of-the-art correction methods are automatically performed by the reconstruction package. Decay correction is performed with an identical reference time for all corresponding scans.
With the proposed CTM approach for PET, arbitrary table trajectories are supported and can thus lead to inhomogeneously varying statistics over a large FOV. To facilitate assessment of this unique aspect of CTM data acquisition, a traffic light indicator has been added to coronal views of reconstructed CTM PET volumes in this study (green, data were acquired for 100% or more of a reference duration; yellow, data were measured for 50% of the reference duration; red, measurement duration close to 0%).
MR Data Acquisition
Several MR CTM protocols are available from the manufacturer of the scanner: FastView Localizer, 2-dimensional (2D) fast low-angle shot (FLASH), 3D FLASH, 2D half Fourier acquisition single-shot turbo spin echo (HASTE), 2D turbo spin echo (TSE), and BLADE (semiradial, motion-corrected TSE).
Only parameters necessary to change the table speed were varied in the following experiments: 2D FLASH, table speed independent parameter; 3D FLASH, repetition time [TR]; and HASTE/TSE/BLADE, slice thickness. All other parameters were kept constant.
In the current implementation, the CTM MR imaging protocols do not support normalization for the radiofrequency surface coil B1 receive field. To ensure comparability of the results in CTM and multistation acquisition mode, this feature was consequently also not used in the acquired multistation scans, except for the patient study.
Phantom Studies
PET Measurements
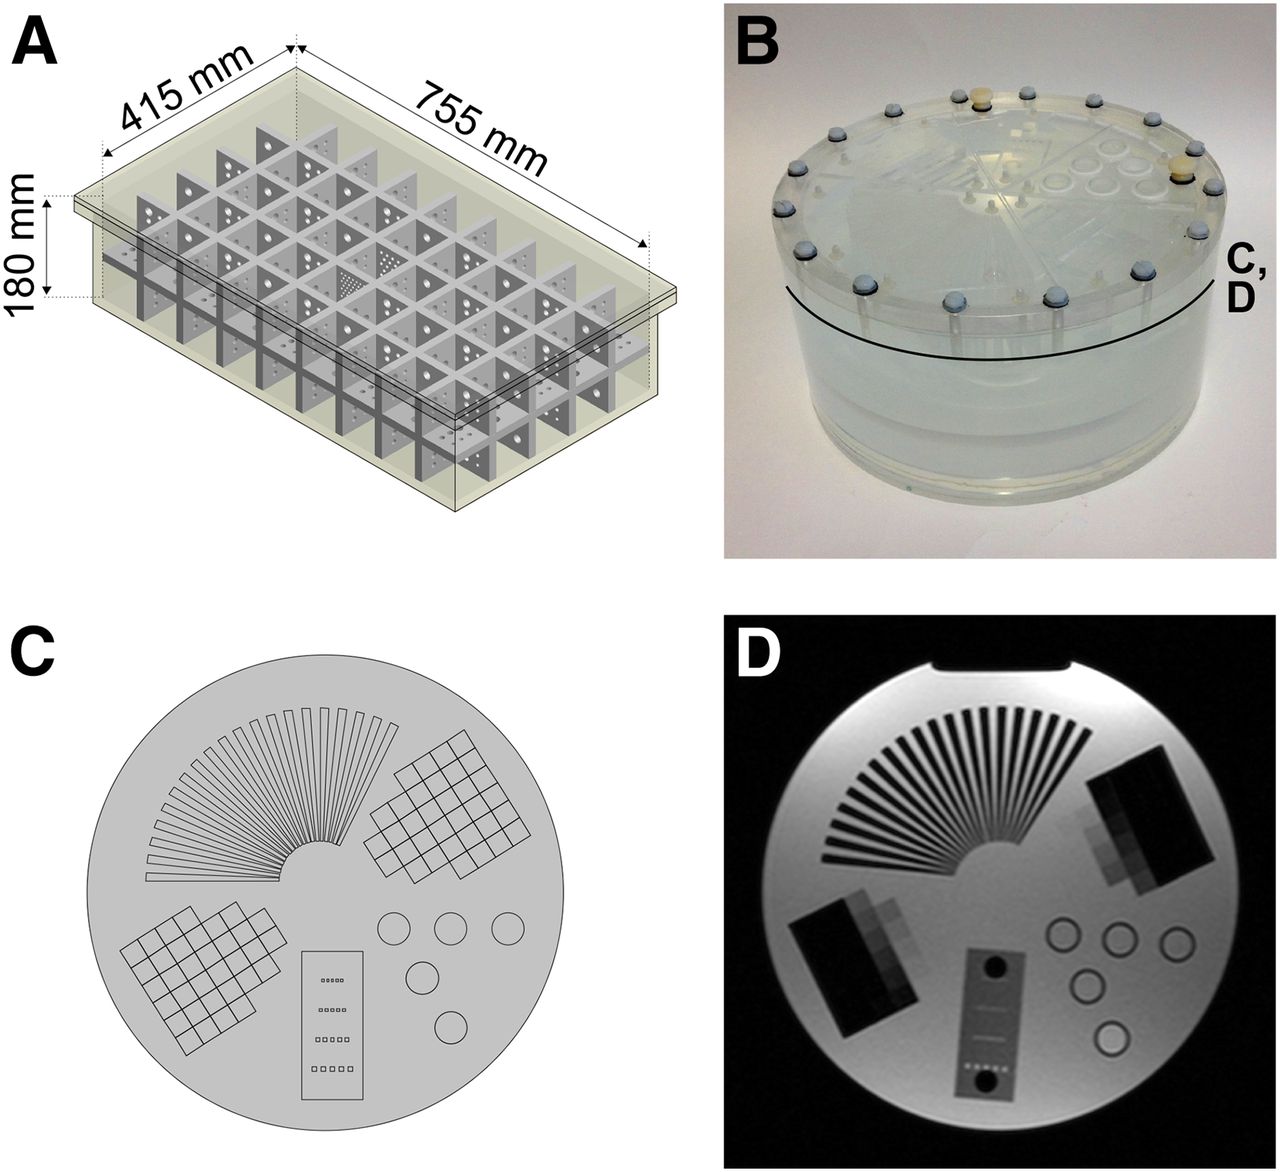
For PET measurements, a custom-built whole-body phantom was used (Fig. 1A) (5). The phantom consists of a polypropylene box (inner volume, 755 × 415 × 180 mm) and a removable polypropylene grid insert with a wall thickness of 15 mm, dividing the inner volume of the box into cubical compartments of 70-mm side length. Additionally, the grid insert contains drillings of 15-, 10-, 9-, 8-, 7-, and 6-mm diameters in all 3 dimensions.

(A) Schematic of large whole-body phantom. (B) Photograph of MR imaging multi-purpose phantom. (C) Schematic of insert region. (D) MR image of insert region. Approximate position of C and D is indicated in B.
Filling the phantom with a mixture of water and radioactive tracer yields visibility in PET and MR imaging. Because the phantom housing is made of plastic material, a CT scan of the fluid-filled phantom was acquired on a CT scanner (SOMATOM Definition Flash; Siemens AG), scaled to the PET photon energy of 511 keV (15) and used as a map for attenuation correction of the phantom and fluid filling during PET reconstructions (Supplemental Fig. 1E).
An activity of 279.7 MBq of 18F was injected into the water-filled phantom, and 3 CTM PET images were acquired with table speeds of 0.8, 2.8, and 4.6 mm/s. As a standard of reference, 3 additional multistation images with 1 bed position in the center of the phantom were acquired before, between, and after the CTM scans to exclude a possible bias by, for example, a different randoms fraction. To ensure comparability of the measurements, the number of true coincidences per central area of the phantom was kept in a similar range (Table 1). To this end, the table was moved once in 1 direction for the 0.8-mm/s scan and in a pendulumlike motion several times back and forth for the 2.8- and 4.6-mm/s scans. Because of this pendulumlike motion, an accurate matching of the number of true coincidences was possible only in a limited fashion, resulting in the differences in total true counts of up to 17% that can be observed in Table 1.
Acquisition Parameters for PET Phantom Measurements
PET Evaluations
Spatial resolution for PET is evaluated visually by assessing visibility of the drillings in the grid insert of the large-body phantom. The geometric accuracy can be assessed using the same phantom by determining whether the phantom compartments are correctly depicted as cubes in all 3 dimensions.
For signal-to-noise-ratio determination in PET imaging (SNRPET), the mean value in a region of interest (ROI) was measured in the homogeneous areas of the central part of the phantom in several adjacent transaxial slices and divided by the SD in a background region. The position of the ROI was chosen to not include the overlap regions of the multistation scan.
To assess quantitative accuracy, the mean activity concentration in the same ROI as used for SNRPET calculation was evaluated.
MR Measurements
For MR-only measurements, a Nuclear Associates MR imaging Multi-Purpose Phantom (Fluke Biomedical) was used (Figs. 1B–1D). This phantom consists of a water-filled cylinder (diameter, 228.6 mm; height, 114.3 mm) with several inserts for evaluation of signal-to-noise-ratio in MR imaging (SNRMR), slice thickness, and artifact behavior.
As a starting point, the default MR protocols suggested by the manufacturer for clinical imaging in CTM mode were used. After the CTM acquisition, the same protocols were modified toward an acquisition in multistation mode with identical settings. This was done for several table speeds (Table 2). The phantom orientation was always chosen with its cylinder axis in the slice direction.
Relevant Sequence Parameters for Performed Phantom MR Imaging Measurements
MR Evaluations
To evaluate SNRMR, the mean value of a circular ROI in the center of the homogeneous region of the phantom was measured. Additionally, in the same ROI the SD of a difference image of 2 measurements with identical parameters was calculated. This approach for SNRMR measurement is also valid when using parallel imaging with multichannel coils (16). Care was taken that approximately the same slice was evaluated.
Two folded step ramps in the insert region of the MR phantom (Figs. 1C and 1D) allow evaluation of the slice profile (step height, 1 mm). They were used to preclude an influence of varying slice thickness on SNRMR results. The number of visible steps in 1 slice was analyzed on both ramps in both identical acquisitions, and mean and SD were calculated.
Finally, to evaluate possible MR imaging artifacts in CTM scans, the images were inspected visually.
Human Studies
Volunteer Scans
MR scans of 4 healthy volunteers (age, 24–26 y; weight, 70–86 kg) were obtained (Table 3) after acquiring written informed consent in accordance with the local ethics guidelines. Where available, breath-hold techniques were used during data acquisition in appropriate regions (2D FLASH, HASTE).
Relevant Sequence Parameters for Volunteer MR Imaging Measurements
Patient Scans
The performance of simultaneous PET and MR CTM data acquisition in a clinical setting was evaluated on 3 oncologic patients who were scanned with the proposed approach after the clinically indicated routine scans. Written informed consent was obtained according to the local ethics guidelines, and no additional tracer injection or application of radiation was necessary. Patient 1 (male; age, 54 y; weight, 90 kg) was referred with a metastasized fibrosarcoma; patient 2 (male; age, 44 y; weight, 80 kg) had a history of papillary thyroid carcinoma, underwent a thyroidectomy, and now presented with increased tumor markers; and patient 3 (male; age, 74 y; weight, 74 kg) presented with a known prostate carcinoma.
Patients 1 and 2 were injected with 369 and 385 MBq of 18F-FDG, respectively; patient 3 was injected with 305 MBq of 18F-choline. Only a fraction of the multistation list-mode data was reconstructed to compensate for the shorter acquisition duration per slice of the CTM scan and for radioactive decay. A comparable amount of true counts in the upper abdominal region of the patients was used for reconstruction for both multistation and CTM scans.
In terms of MR imaging acquisitions with CTM, FastView Localizer, 2D FLASH in 2-point Dixon mode, and HASTE were acquired (all with breath-hold techniques) for all 3 patients.
To assess the influence of table trajectory on PET image quality, the trajectories for the patient scans were not strictly linear or pendulumlike but also contained stops and table speeds of up to 46 mm/s. Because of time constraint in the clinical workflow, it was not possible to acquire these additional CTM whole-body images at an equally high PET statistic over the whole FOV. A prime focus for CTM and multistation data comparability was thus put on the upper abdominal region, where best possible PET image quality was desired.
Attenuation correction of PET data was performed on the basis of a product level gradient-echo sequence in 2-point Dixon mode, which is automatically obtained when performing multistation PET/MR acquisitions and results in segmented attenuation maps that contain fat, soft tissue, lung, and background air. The same attenuation map was used for both multistation and CTM PET reconstruction. In principle, and by implementation of a further algorithm, this Dixon sequence could also be modified to allow for CTM mode and subsequent generation of attenuation maps. For comparability, however, we chose to use the standard multistation Dixon images that are generally acquired as part of the clinical routine protocol.
Performed Evaluations
The image quality of the volunteer MR data and the PET and MR data of the patient scans was assessed visually. Additionally, the images were graded in a single-masked fashion by an experienced physician with 20 y of MR reading experience and with 6 and 3 y of hybrid imaging reading experience for PET/CT and PET/MR, respectively. Each dataset was rated on a 1–4 scale (1, diagnostically not usable; 2, contains artifacts but diagnostically usable; 3, good image quality; or 4, excellent image quality). Additionally, the reader was asked to pick the images with the best diagnostic quality or mark them as diagnostically identical.
RESULTS
Phantom Studies
PET Measurements
Reconstructed images of the large-body phantom PET scans are shown in Figure 2. The magnified areas in Figure 2 are additionally shown in Supplemental Figure 2 in larger size. As expected, the resolution in axial slices is generally lower than in coronal slices because of the difference in voxel dimensions (Fig. 2, top). When CTM scans are compared to the multistation data in the resolution drilling region, minor differences can be observed in coronal views that must be attributed to the high noise levels due to the low amount of activity. No geometric distortions over the whole phantom volume—either in multistation or in CTM mode—have been observed (Fig. 2, bottom).
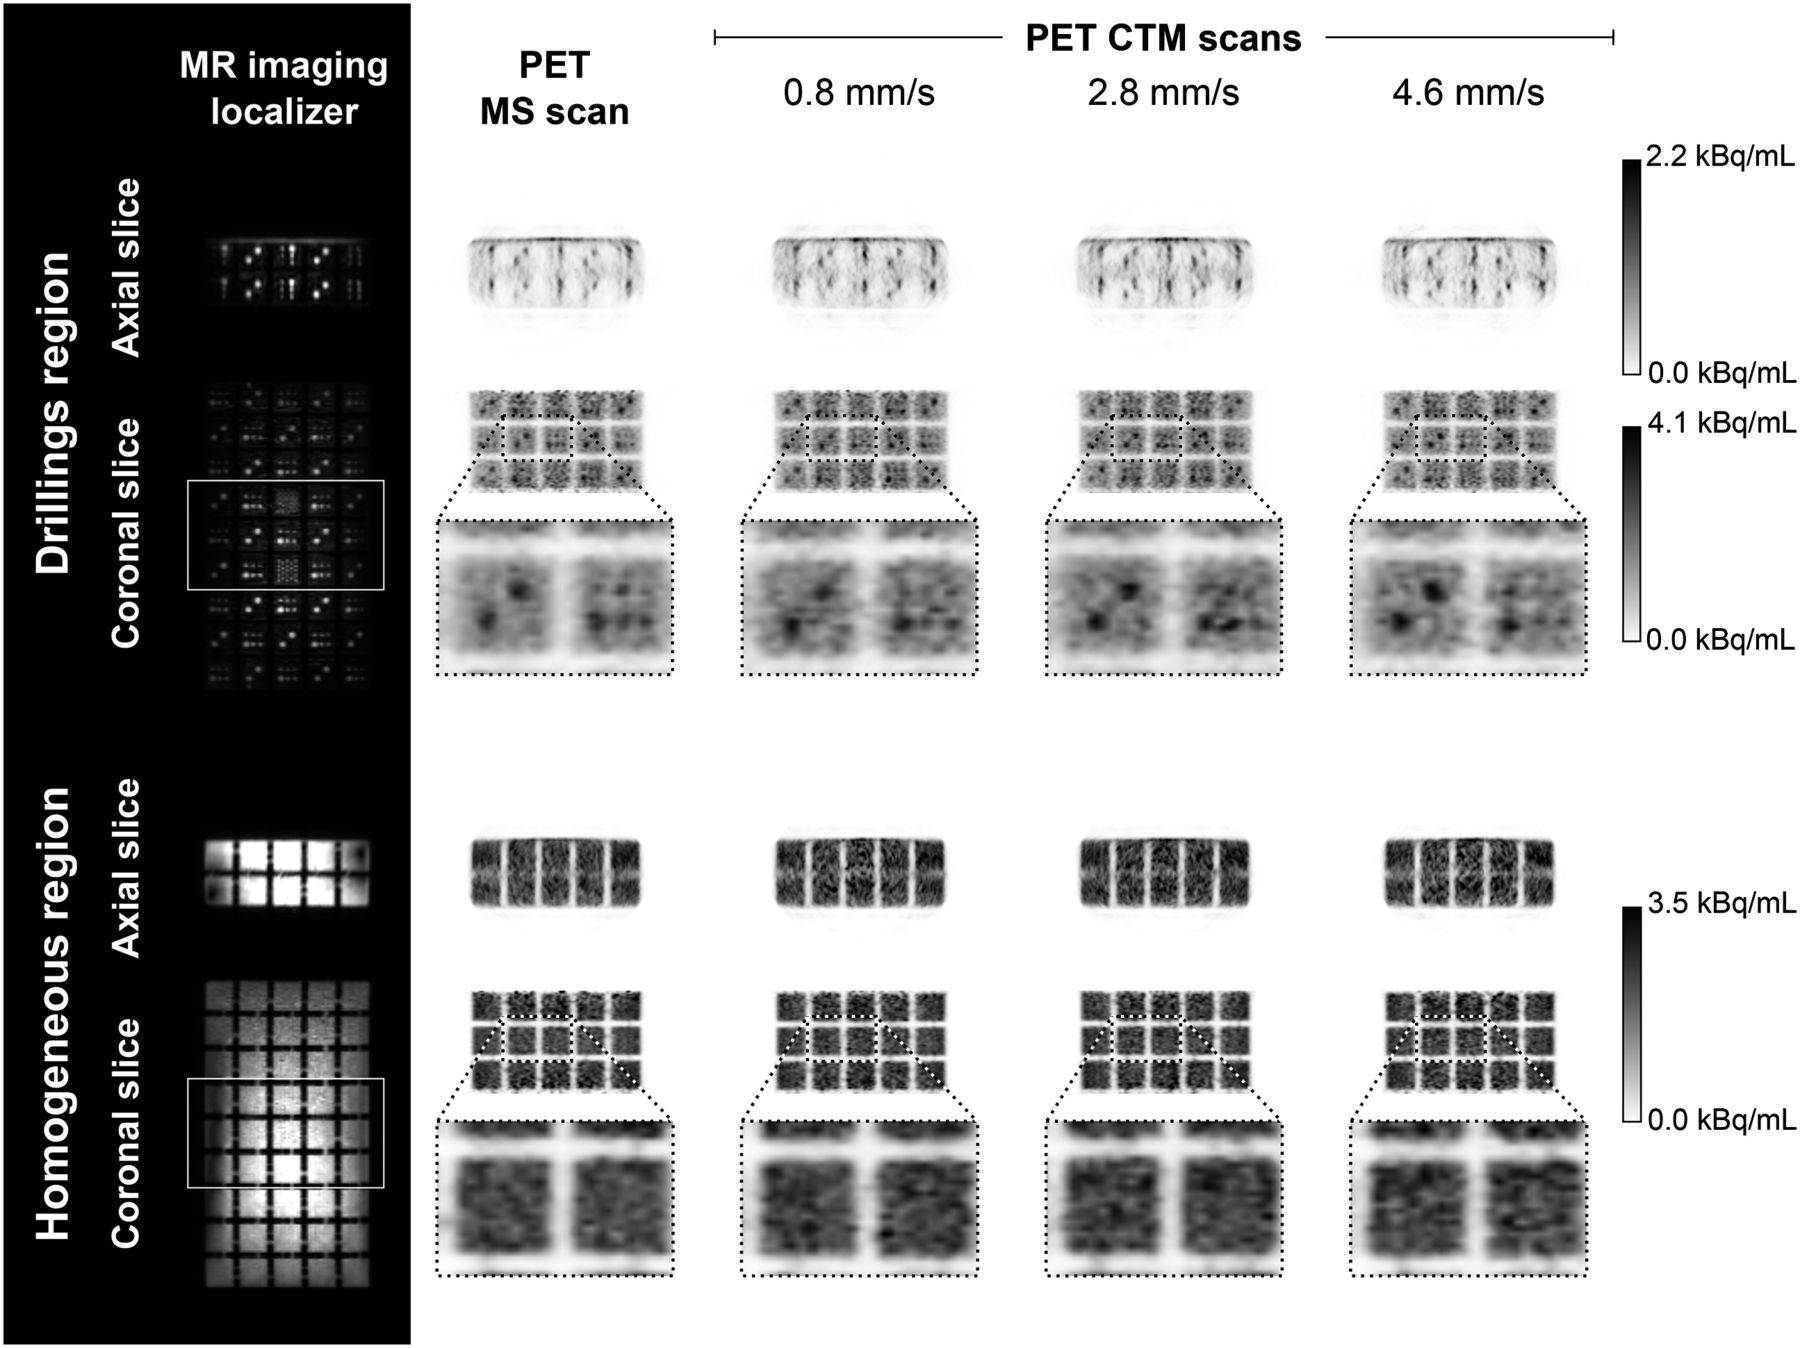
Slices of CT-based attenuation-corrected PET volumes in axial and coronal orientation for resolution drilling region (top) and for fluid-filled cubes in homogeneous distortion evaluation region (bottom) for MS2, CTM0.8, CTM2.8, and CTM4.6. For CTM scans, only central region that corresponds to multistation bed position and that was acquired with comparable amount of true counts is shown. MR localizers on left indicate position of individual bed positions. Scale-ups are provided for better comparability of image quality. Supplemental Figure 2 provides complete views of magnified regions. MS = multistation.
Figure 3A shows measured mean activity values in the central homogeneous area of the phantom. All values are in good agreement between multistation and CTM scans. The SNRPET values in Figure 3B are also in good agreement between multistation and CTM scans considering the lower amount of true counts for the 0.8-mm/s CTM and especially the 4.6-mm/s CTM scan (Table 1).
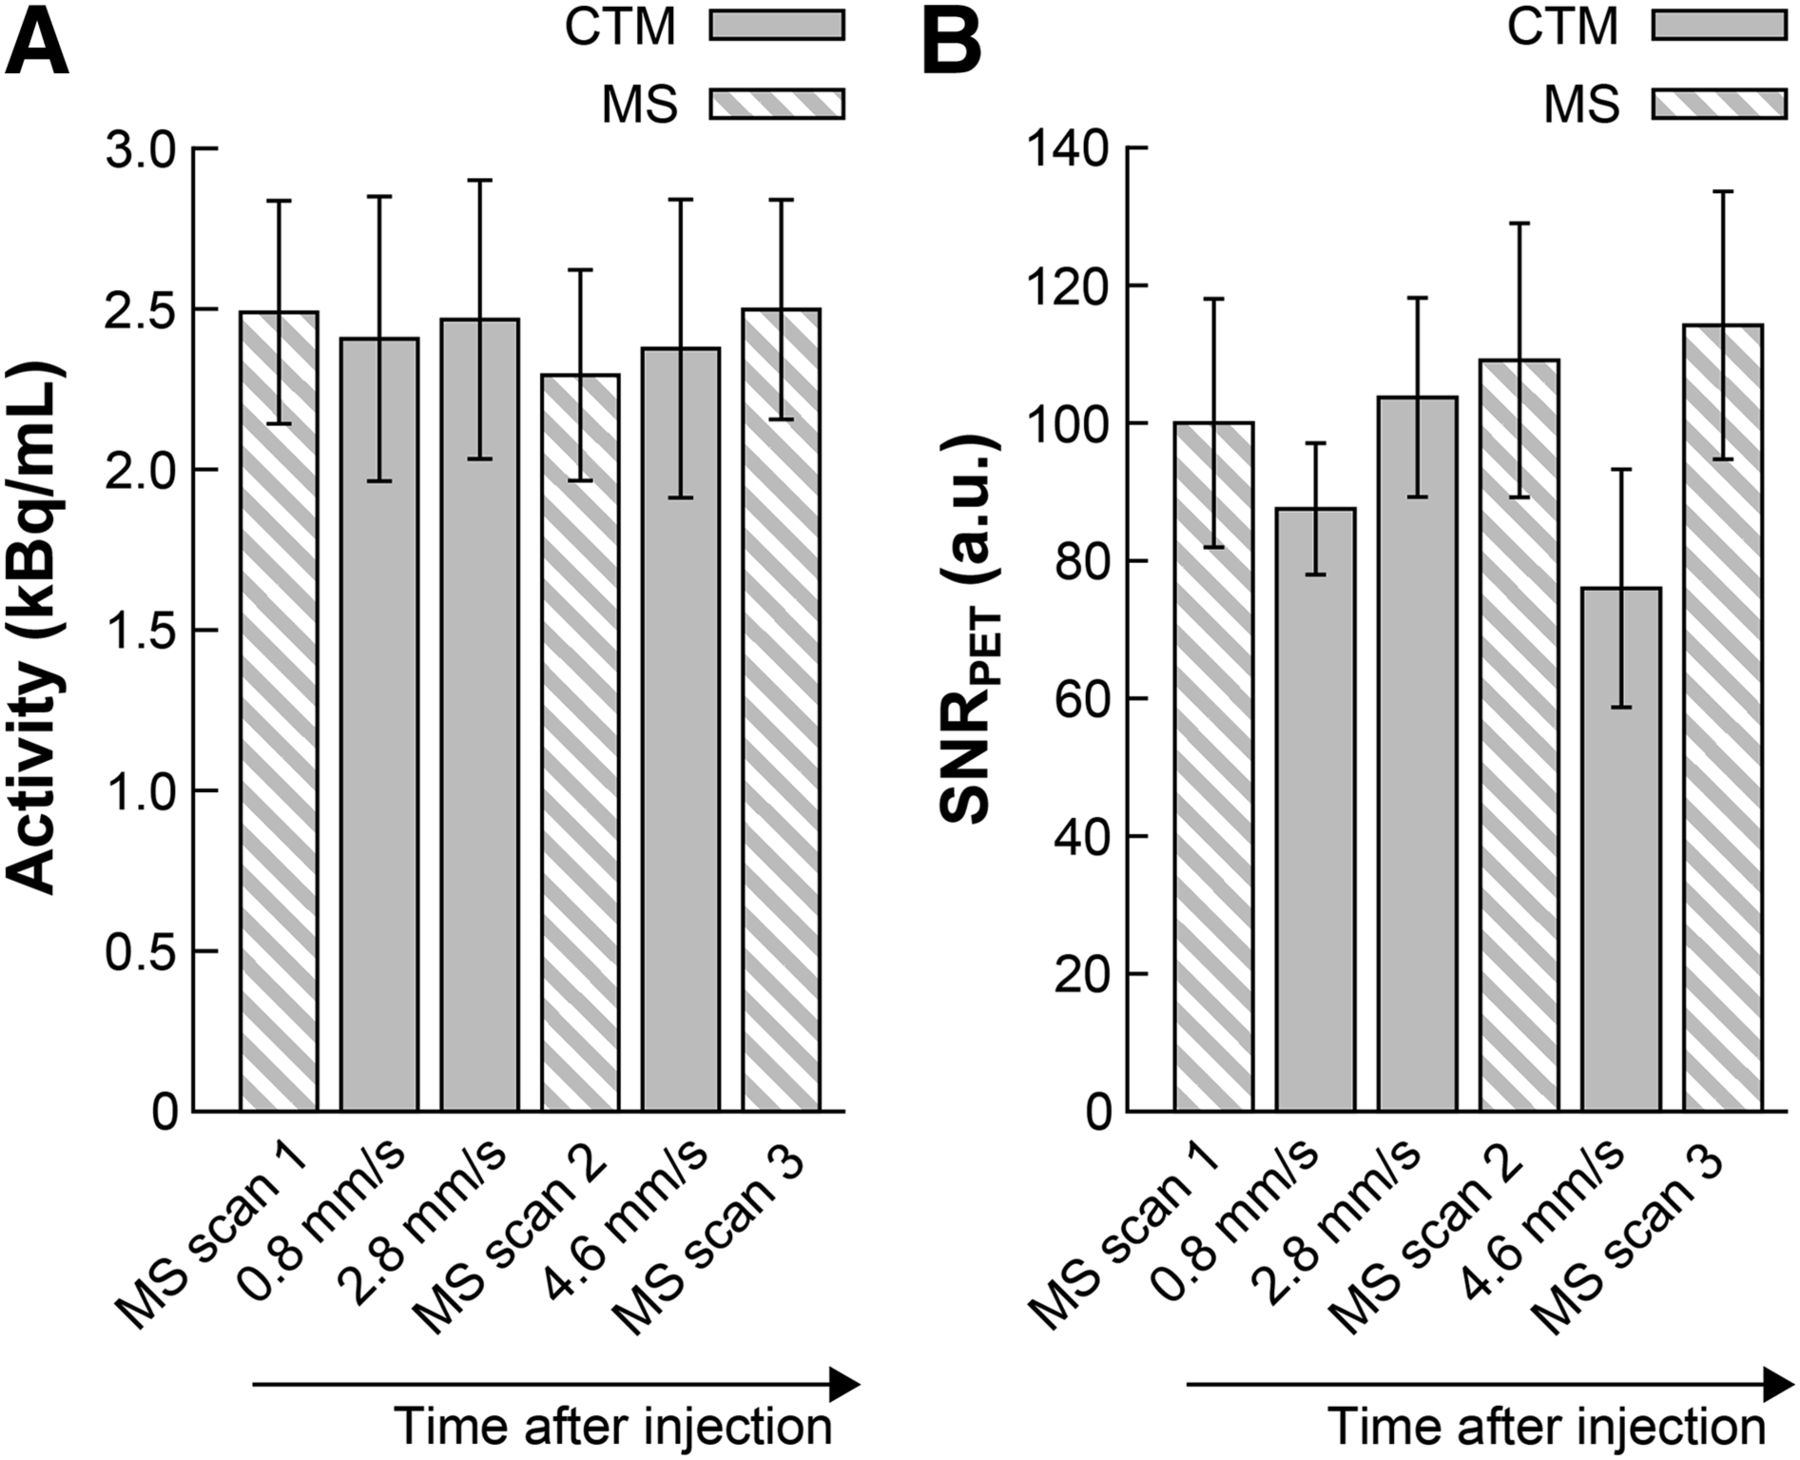
Mean activity concentration (A) and SNRPET (B) of performed PET measurements. PET scans were obtained in temporal sequence as they are shown in both graphs. MS = multistation.
MR Measurements
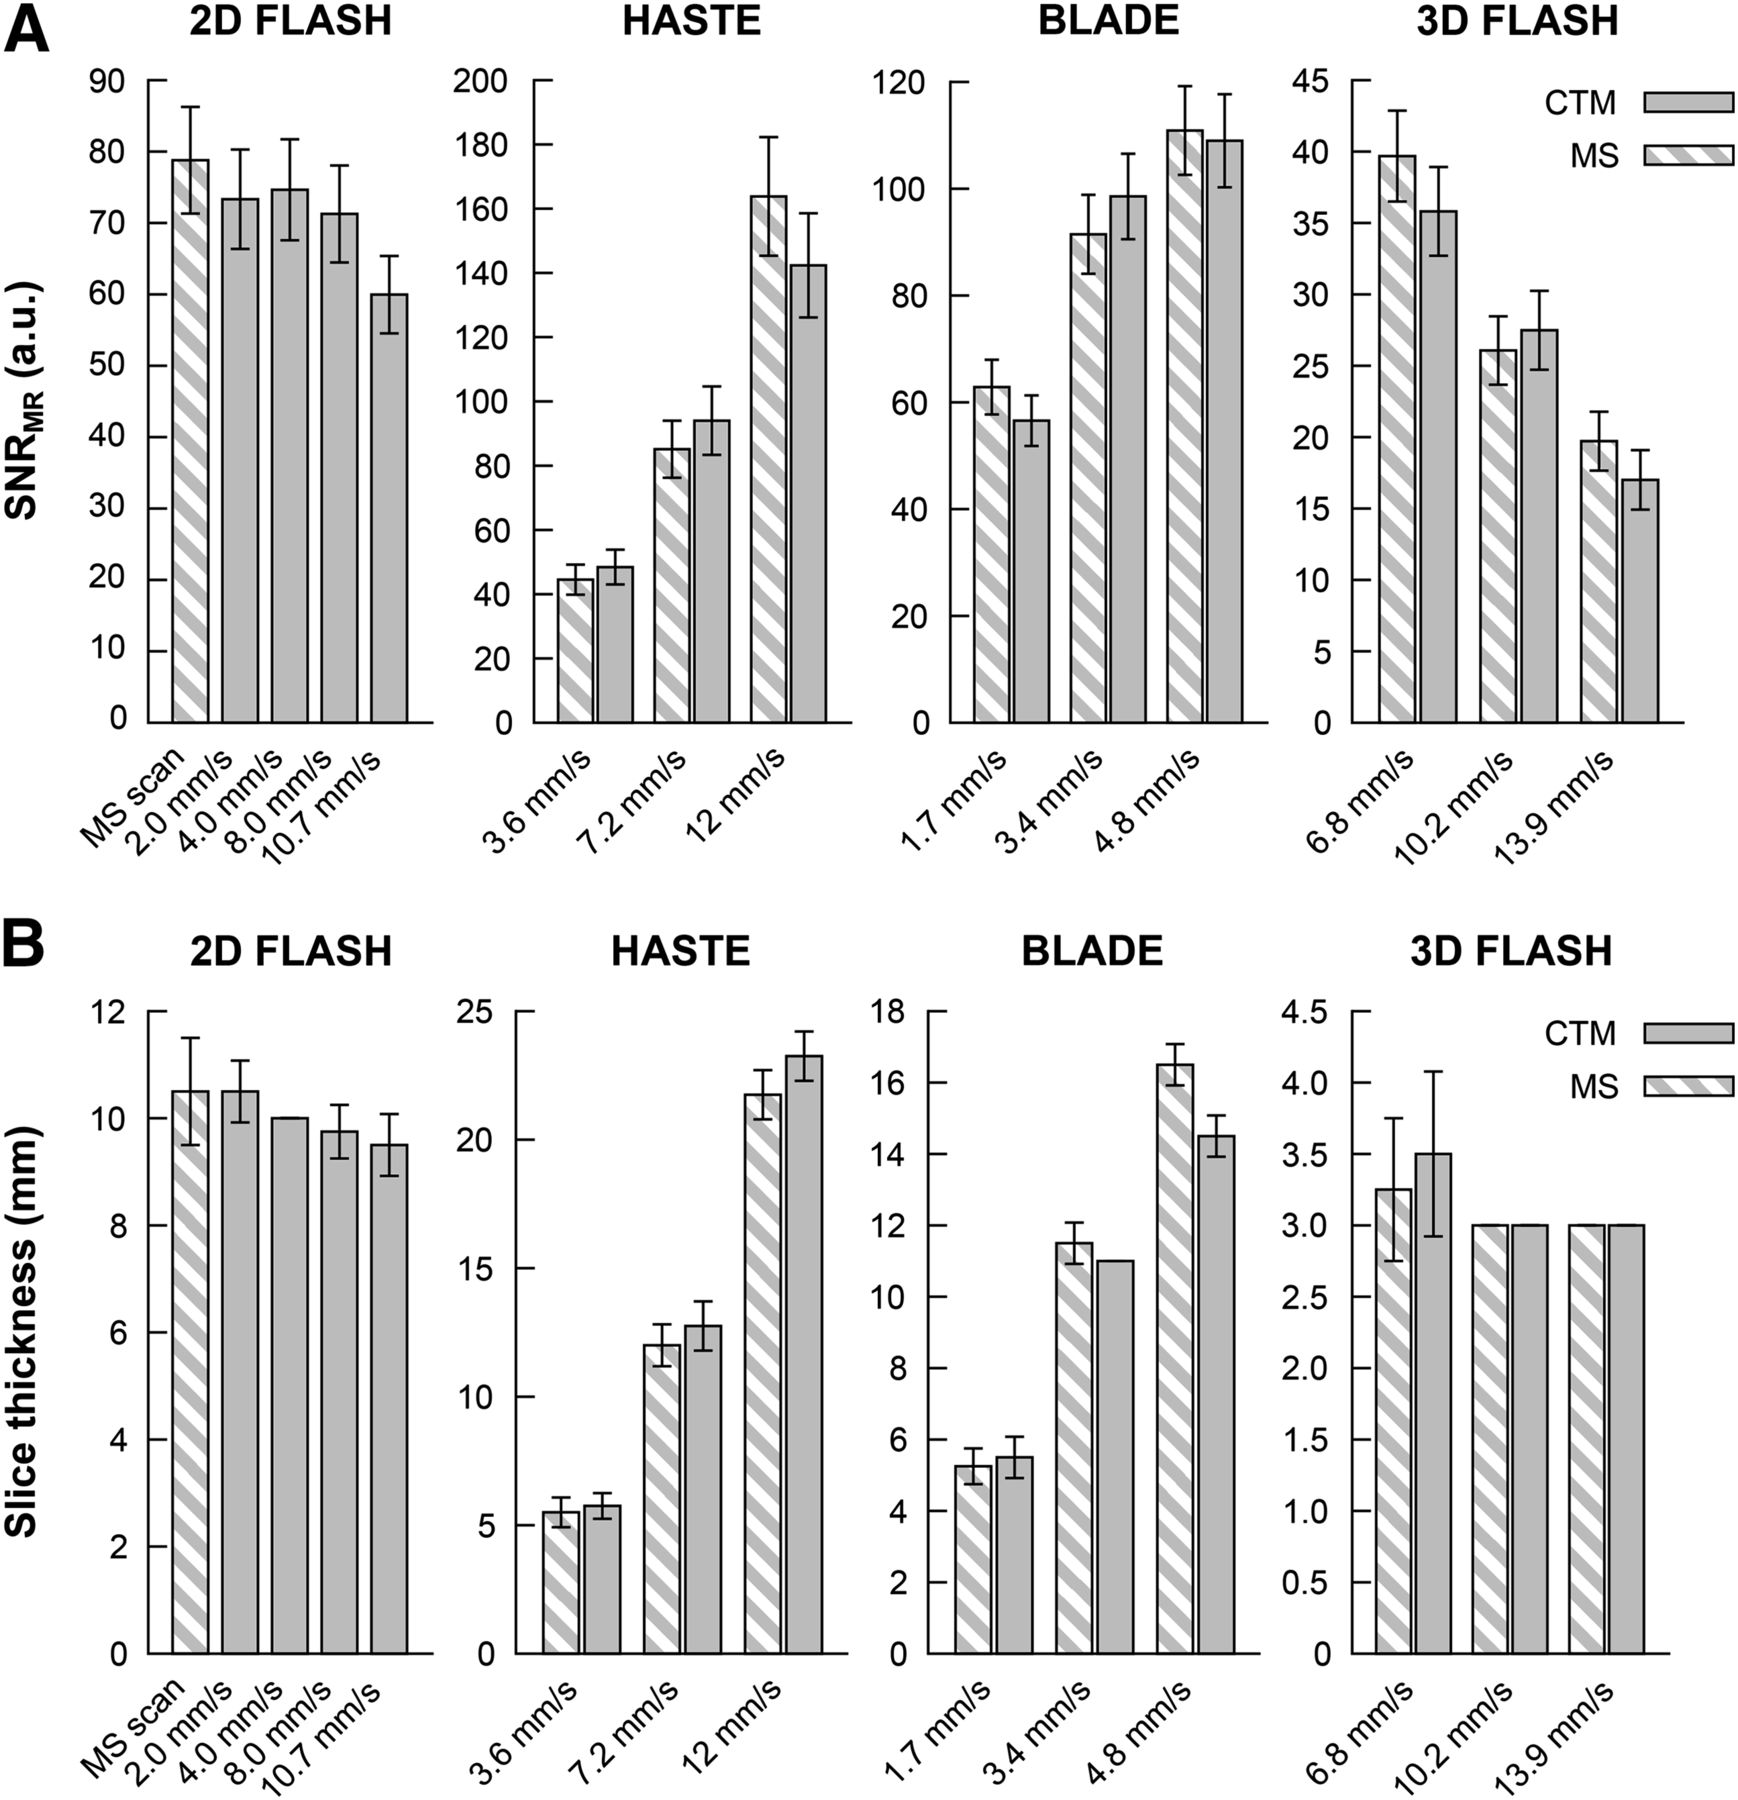
Figure 4A shows the results of the SNRMR measurements. Except the fast 10.7-mm/s scan, the results for the 2D FLASH sequence show similar SNRMR values for all data points that are well within the error bars. In HASTE, BLADE, and 3D FLASH, a similar behavior is apparent. In HASTE and BLADE, a general increase of SNRMR can be seen with increasing table speed as expected (increased table speed is proportional to increased slice thickness). In 3D FLASH, SNRMR decreases with decreasing TR for both multistation and CTM scans.

Measured SNRMR (A) and measured slice thickness (B) in all acquired MR sequences comparing multistation and CTM acquisition mode. For HASTE and BLADE, variation of table speed is achieved by varying slice thickness; for 3D FLASH, variation of table speed is achieved by varying TR, thus for each CTM data point corresponding reference multistation data point had to be obtained. MS = multistation.
No large discrepancies in slice thickness can be observed (Fig. 4B). Slight differences must be attributed to the inaccuracy of the use of a folded step ramp as a visual measurement approach. In 2D FLASH, ghosting in the phase-encoding direction (vertical direction) can be observed at table speeds faster than 4.0 mm/s. In the other 3 sequences, multistation and CTM scans show similar artifact behavior. In BLADE, the 3.4- and 4.8-mm/s CTM scans exhibit slightly more artifacts whereas in 3D FLASH a higher noise seems evident in CTM scans. Nonetheless, SNR is comparable between multistation and CTM 3D FLASH, as was shown above. Several magnified sections of the insert region of the MR phantom are shown in Supplemental Figure 3 as an example for image quality.
Human Studies
Volunteer Scans
Artifact behavior similar to that in the phantom scans can be observed in the 2D FLASH sequence (Fig. 5A). With increasing table speed, subtle ghosting artifacts in the phase-encoding direction appear. These artifacts are less prominent than in the phantom scans because of the fact that the human body provides only little alterations of the magnetic susceptibility at tissue interfaces. Artifacts mostly appear at the arms. Other than that, CTM and multistation images are comparable. It can be seen that fat saturation performance in CTM scans is somewhat inferior to that in multistation scans; however, it is homogeneous over the whole volume. For the multistation scan, however, fat saturation performance was not equally efficient for all slices but varied every other slice. The physician marked the 8.0-mm/s, 10.7-mm/s, and multistation scan as diagnostically identical at an image quality score of 3. The 4.0-mm/s CTM scan was rated with 2 because of breathing artifacts in the lower abdomen.

Reconstructed slices for MR imaging volunteer scans for 2D FLASH Dixon in-phase images and 2D FLASH with fat saturation (A), HASTE (B), HASTE with turbo-inversion recovery-magnitude (C), and BLADE with fat saturation (D). Scale-ups are provided for better comparability of image quality. Supplemental Figure 4 provides complete views of magnified regions. MS = multistation.
For HASTE and HASTE turbo-inversion recovery-magnitude, multistation and CTM scans show similar image quality (Figs. 5B and 5C). All HASTE images were marked at an equal image quality of 3 by the physician.
The image impression of multistation and CTM scans is similar for BLADE (Fig. 5D). The fat saturation performance, however, is slightly inferior in the shown CTM scans as compared with the multistation scans, which can be seen especially at the posterior left side of the volunteer. The physician rating for BLADE was 2 for multistation scans and 3 for CTM scans. An increased noise and more signal inhomogeneities were noted in multistation scans.
The magnified regions in Figure 5 are shown in larger size in Supplemental Figure 4 for better visual inspection.
Patient Scans
Reconstructed attenuation-corrected PET images and characteristic slices of the MR volumes for patient 2 are shown in Figure 6. In PET, the lesions in the neck region are depicted with equal quality in both CTM and multistation scans. The influence of the varying PET statistics can be seen in the brain region where noise is higher in the CTM scan because of the shorter acquisition duration in that area.
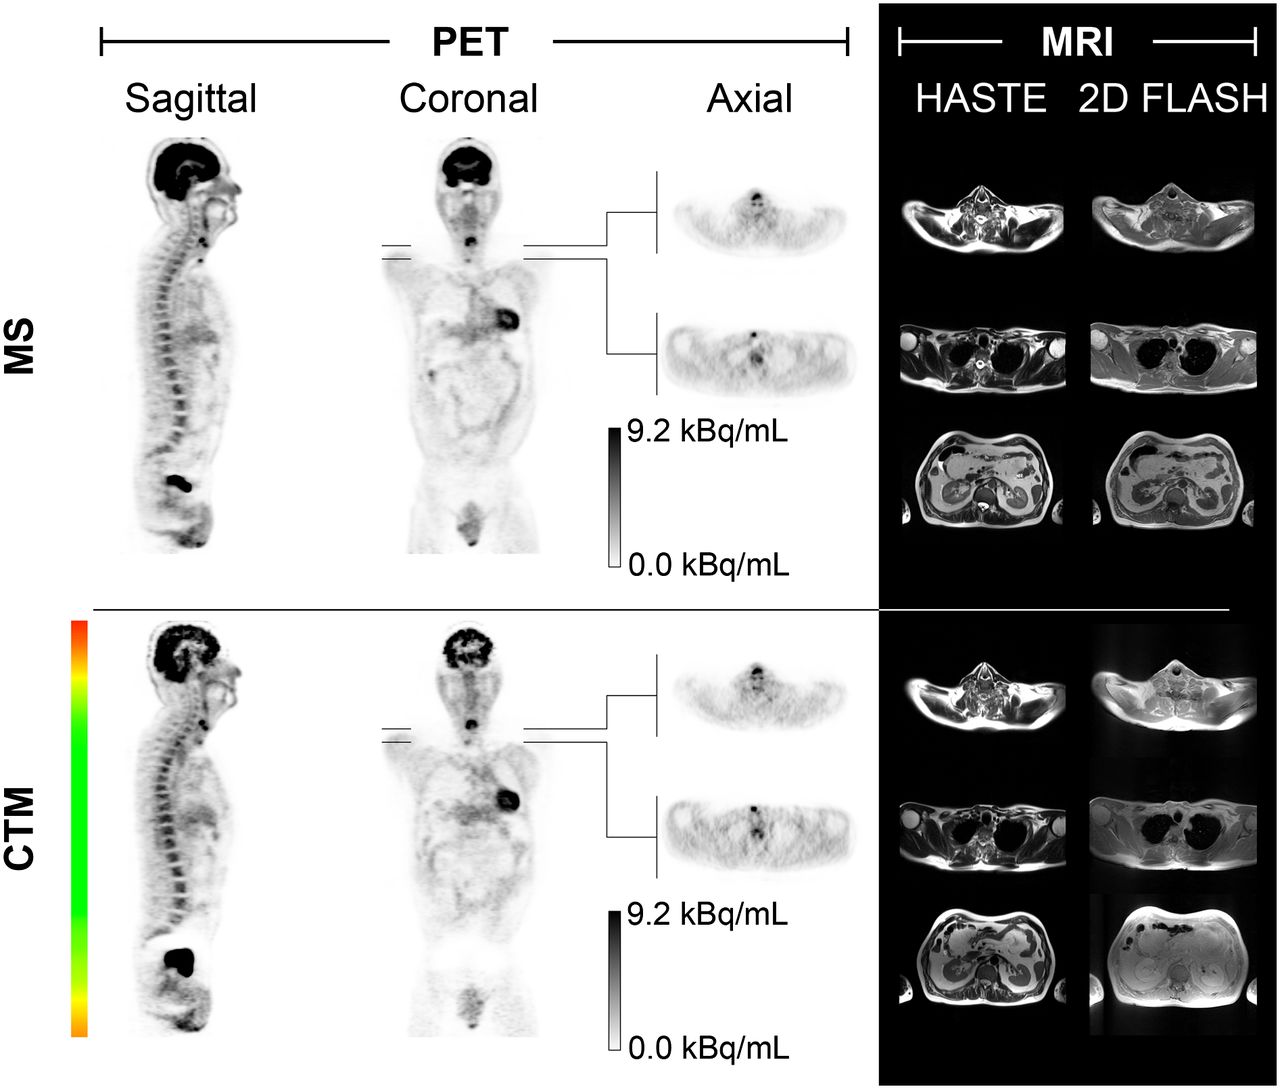
Reconstructed attenuation-corrected PET and MR images acquired with both multistation and CTM mode for patient 2. Coronal CTM PET images are accompanied by traffic light color bar for visualizing amount of acquired CTM data relative to multistation data. Supplemental Figure 5 provides additional maximum-intensity projections of multistation and CTM PET scans. MS = multistation.
Supplemental Figure 5 complements Figure 6 in providing maximum-intensity projections of the multistation and CTM scans of patient 2 in sagittal and coronal orientation. Supplemental Figure 6 illustrates the table trajectory used for the scan of patient 2 and the variation of the acquisition statistics.
An image quality score of 4 was assigned to all multistation MR acquisitions in all 3 patients. CTM images were graded slightly inferior, with a rating of 3 throughout, and increased inhomogeneities were noted. This is due to normalization being switched on for multistation scans and off for CTM scans and could be remedied by an update for the CTM sequences by the manufacturer allowing for proper normalization.
In PET, when being asked for overall image quality, the physician rated multistation scans at 4 for all patients and CTM scans at 3 for patient 1 and at 2 for patients 2 and 3, noting increased noise in the CTM scans. From the traffic light indicator in Figure 6, however, it can be seen that especially in the head and lower abdominal region the amount of acquired data was lower in the CTM scan because of the lower amount of time spent in that area, degrading the overall image quality rating. When the reader was instructed to consider only the organs in the thorax and upper abdomen such as liver and kidneys, where the counting statistics of multistation and CTM mode were comparable, the rating increased to 4 for PET CTM images for all 3 patients, and multistation and CTM images were marked as diagnostically identical.
DISCUSSION
A new data acquisition paradigm for simultaneous whole-body PET/MR hybrid imaging with continuous table motion has been introduced and evaluated. PET and MR image quality parameters have been evaluated in appropriate phantom and volunteer experiments and validated in patient scans.
Systematic side-by-side comparisons evaluating PET and MR image quality parameters of CTM and multistation data of phantoms, volunteers, and patients revealed an overall equivalent imaging performance of both imaging strategies. In more detail, during MR phantom scans, SNRMR was at similar levels for both multistation and CTM scans in all tested sequences (Fig. 4). Only in 2D FLASH could an increase of ghosting artifacts in the phase-encoding direction be observed with increased table speed at high-susceptibility boundaries. This was especially noticeable at table speeds faster than 4.0 mm/s (Supplemental Fig. 3). In MR volunteer scans, the ghostinglike artifacts in the phase-encoding direction in 2D FLASH are not as apparent as in the phantom scans though they are still visible especially at higher table speeds (≥8.0 mm/s) and at interfaces with strong susceptibility differences (e.g., arms/air) (Fig. 5). An equal or better image quality score was assigned throughout to CTM volunteer MR scans by the physician. For PET phantom scans, SNRPET was also at similar levels for both multistation and CTM scans (Fig. 3B). In the body region that was acquired with the same PET statistics, PET patient image quality was rated diagnostically identical for both multistation and CTM acquisitions.
For the clinical workflow, several advantages of CTM over multistation can be identified. With appropriate table trajectories, CTM scans are considerably more homogeneous in terms of sensitivity in the axial direction (5). Increased time efficiency is evident because of obviation of bed position overlap. The time needed for data acquisition for a whole-body study with 5 bed positions, 30% bed position overlap, and 5 min per multistation station could be reduced to about 24 min with CTM, as compared with 25 min with multistation data acquisition (5), not considering the additional time needed in multistation for movement of the patient table from station to station. This seems a rather small difference. However, increased time efficiency also means that with the proposed CTM approach, PET data can be acquired at all times, for example, during the planning process, when the patient can be moved slowly through the scanner and PET data acquired while the technologist is planning the subsequent acquisitions, effectively making use of time when the scanner would otherwise be idle.
In terms of additional flexibility in MR data acquisition, an advantage is the freely selectable breath-hold duration in the thorax region, allowing the choice of tailored scan times on a flexible per-patient basis while PET data are acquired simultaneously without being bound to a fixed-bed-position timing scheme. A minor limitation of the current implementation of the MR CTM protocols is missing normalization of the signal reception B1 profiles of individual receive coils, leading to an intensity gradient toward the positions of the individual coil elements. This may visually lead to inhomogeneous MR image brightness and contrast while not influencing the SNRMR or other quantitative MR imaging parameters.
A new challenge associated with the increased flexibility of CTM PET data acquisition is the need to provide sufficient SNRPET over all ROIs in the patient. This flexibility requires extra care by the operator to ensure that the necessary amount of PET data was indeed acquired for each relevant body section and, if not, to acquire additional data at the end of the measurement so as to meet the requirements for acceptable SNRPET and image quality. This could be also accomplished by a combination of CTM, automatic bookkeeping of the individual table positions over the time of the examination, and a dedicated sequence for table motion at the end of the scan (5). CTM thus provides a new degree of freedom by allowing a region-dependent data acquisition duration, potentially allowing for tracking of tracer dynamics in a body region exceeding a single bed position up to the whole body.
Transfer of the proposed concept of simultaneous PET/MR data acquisition with CTM into routine clinical use requires further technical implementations. Currently, the processing of PET data and creation of the virtual subsinograms takes between several minutes and hours, depending on the amount of data that were acquired, and is performed after completion of the data acquisition on a separate computer. Reconstruction of the virtual subsinograms derived from CTM data, however, does not take longer than reconstructing conventional multistation sinograms because the same software package is used. Furthermore, in-depth clinical integration of CTM data acquisition also necessitates the development of additional CTM compatible MR sequences.
CONCLUSION
Continuous-table-motion data acquisition allows for faster and more flexible PET and MR examination planning and thus for a streamlined PET/MR examination workflow. In this context, CTM protocols allow seamless acquisition in z-direction up to whole-body coverage, disposing of the need for acquisition of partially redundant PET and MR data with FOV overlap between successive bed positions. Seamless whole-body data coverage potentially also facilitates image reading because no discrete bed positions have to be recomposed after acquisition.
DISCLOSURE
The costs of publication of this article were defrayed in part by the payment of page charges. Therefore, and solely to indicate this fact, this article is hereby marked “advertisement” in accordance with 18 USC section 1734. The Biograph mMR PET/MR system at the Institute of Medical Physics was funded through a research collaboration between Siemens Healthcare Sector, Erlangen, Germany, and the University of Erlangen-Nuremberg. No other potential conflict of interest relevant to this article was reported.
Acknowledgments
We acknowledge Stephan Kannengiesser (Siemens AG) for helpful discussions on TimCT protocols, Ralf Ladebeck and Björn Jakoby (both Siemens AG) for assistance regarding scanner access, Jens U. Krause (University of Erlangen-Nuremberg) for help during the PET phantom experiments, and the technologist team of ZEMODI Bremen for help during patient data acquisition. The Biograph mMR PET/MR system at the IMP was funded through a research collaboration between Siemens AG, Healthcare Sector and the University of Erlangen-Nuremberg.
Footnotes
Published online Nov. 14, 2013.
- © 2014 by the Society of Nuclear Medicine and Molecular Imaging, Inc.
REFERENCES
- Received for publication March 19, 2013.
- Accepted for publication September 18, 2013.


Jump to section
Related Articles
Cited By...
- No citing articles found.