


Abstract
We characterize a compact MR-compatible PET insert for simultaneous preclinical PET/MRI. Although specifically designed with the strict size constraint to fit inside the 114-mm inner diameter of the BGA-12S gradient coil used in the BioSpec 70/20 and 94/20 series of small-animal MRI systems, the insert can easily be installed in any appropriate MRI scanner or used as a stand-alone PET system. Methods: The insert consists of a ring of 16 detector-blocks each made from depth-of-interaction–capable dual-layer-offset arrays of cerium-doped lutetium-yttrium oxyorthosilicate crystals read out by silicon photomultiplier arrays. Scintillator crystal arrays are made from 22 × 10 and 21 × 9 crystals in the bottom and top layers, respectively, with respective layer thicknesses of 6 and 4 mm, arranged with a 1.27-mm pitch, resulting in a useable field of view 28 mm long and about 55 mm wide. Results: Spatial resolution ranged from 1.17 to 1.86 mm full width at half maximum in the radial direction from a radial offset of 0–15 mm. With a 300- to 800-keV energy window, peak sensitivity was 2.2% and noise-equivalent count rate from a mouse-sized phantom at 3.7 MBq was 11.1 kcps and peaked at 20.8 kcps at 14.5 MBq. Phantom imaging showed that features as small as 0.7 mm could be resolved. 18F-FDG PET/MR images of mouse and rat brains showed no signs of intermodality interference and could excellently resolve substructures within the brain. Conclusion: Because of excellent spatial resolvability and lack of intermodality interference, this PET insert will serve as a useful tool for preclinical PET/MR.
PET allows for functional in vivo imaging of a positron-emitting radiotracer. While the strength of PET lies in the ability to accurately detect radioisotopes at picomolar concentrations in vivo (1), PET does not provide anatomic information. Hybrid PET systems incorporating CT or MRI dramatically increase the value of PET by providing an anatomic backdrop to PET images.
Although PET/CT is a mature clinical and preclinical technology, PET/MR is still an emerging technology. PET/MR has traditionally been a challenge because the photomultiplier tubes that detect scintillation light cannot function inside a strong magnetic field. Early attempts at simultaneous PET/MR for clinical (2–4) and preclinical applications (5,6) used fiber-optic cables to direct scintillation light to photomultiplier tubes positioned outside the magnetic field. In addition to signal distortion and energy resolution degradation due to loss of light, the volume of fiber-optic cabling created space constraints limiting the number of detectors.
Later work used MR-compatible avalanche photodiodes to directly read out scintillator crystals inside an MRI scanner (7–10). Compared with photomultiplier tubes, avalanche photodiodes result in poor timing resolution and low, temperature-sensitive gain (11). Silicon photomultipliers (SiPMs) have recently become an attractive alternative to avalanche photodiodes for PET/MR (12–14) because they offer gain and timing resolution comparable to photomultiplier tubes while also functioning in strong magnetic fields with little temperature dependence (11,15,16).
This work presents an SiPM-based MR-compatible high-resolution PET insert allowing for simultaneous PET/MR imaging of small animals. An insert is advantageous to integrated PET/MR systems because it can be retrofit to existing MRI scanners, potentially reducing the capital cost by a large factor for groups pursuing simultaneous PET/MR, while also functioning as a compact stand-alone PET system. Our design was constrained so that the insert could fit inside a Bruker BGA-12S gradient coil (inner diameter, 114 mm) installed in both the 70/20 and the 94/20 models of the Bruker BioSpec preclinical MRI scanner. The inner bore of the PET insert was required to be large enough to accommodate the 60-mm outer diameter of the Bruker 35-mm radiofrequency volume coil. The resulting high curvature of the PET detector ring exacerbates resolution degradation from the parallax effect, as annihilation photons originating from even a small radial offset will enter the detectors at a substantial angle. Our PET system was therefore built using depth-of-interaction–capable detectors to mitigate the parallax effect.
We previously reported on the MR compatibility of the PET insert (17) and have shown the first images and a preliminary characterization (18). Here we present a final characterization of the PET insert after major firmware updates that yielded substantial improvements in signal timing accuracy and count rate performance and therefore superior image quality. Additionally, a point-spread-function–modeling maximum-likelihood expectation-maximization (PSF-MLEM) algorithm tailored to this PET detector geometry (19) was used for the first time to reconstruct phantom and rodent data.
MATERIALS AND METHODS
PET Insert
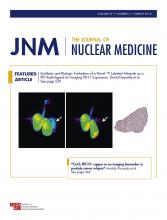
Each detector-block consists of a dual-layer-offset array (20,21) of cerium-doped lutetium-yttrium oxyorthosilicate crystals read out by two ArraySB-4 SiPM arrays (SensL Inc.). Crystal arrays (Proteus Inc.) are made from 22 × 10 (1.2 × 1.2 × 6 mm) crystals in the bottom layer and 21 × 9 (1.2 × 1.2 × 4 mm) crystals in the top layer. Crystals are polished and coated in enhanced specular reflector film bonded with Dymax OP-20 ultraviolet curing glue and arranged with a 1.27-mm pitch as shown in Figure 1A. A 1.0-mm-thick glass light-guide allows scintillation light to diffuse before reaching the SiPMs. The 32 SiPM analog outputs are multiplexed to four by a resistive charge-division network (22,23). Analog outputs are carried from each detector-block by high-definition multimedia interface cables, which also power the SiPMs (24).

Schematic of crystal array, with light-guide shown in blue (A), and photograph of assembled detector-block next to Canadian $1 coin for size comparison (B).
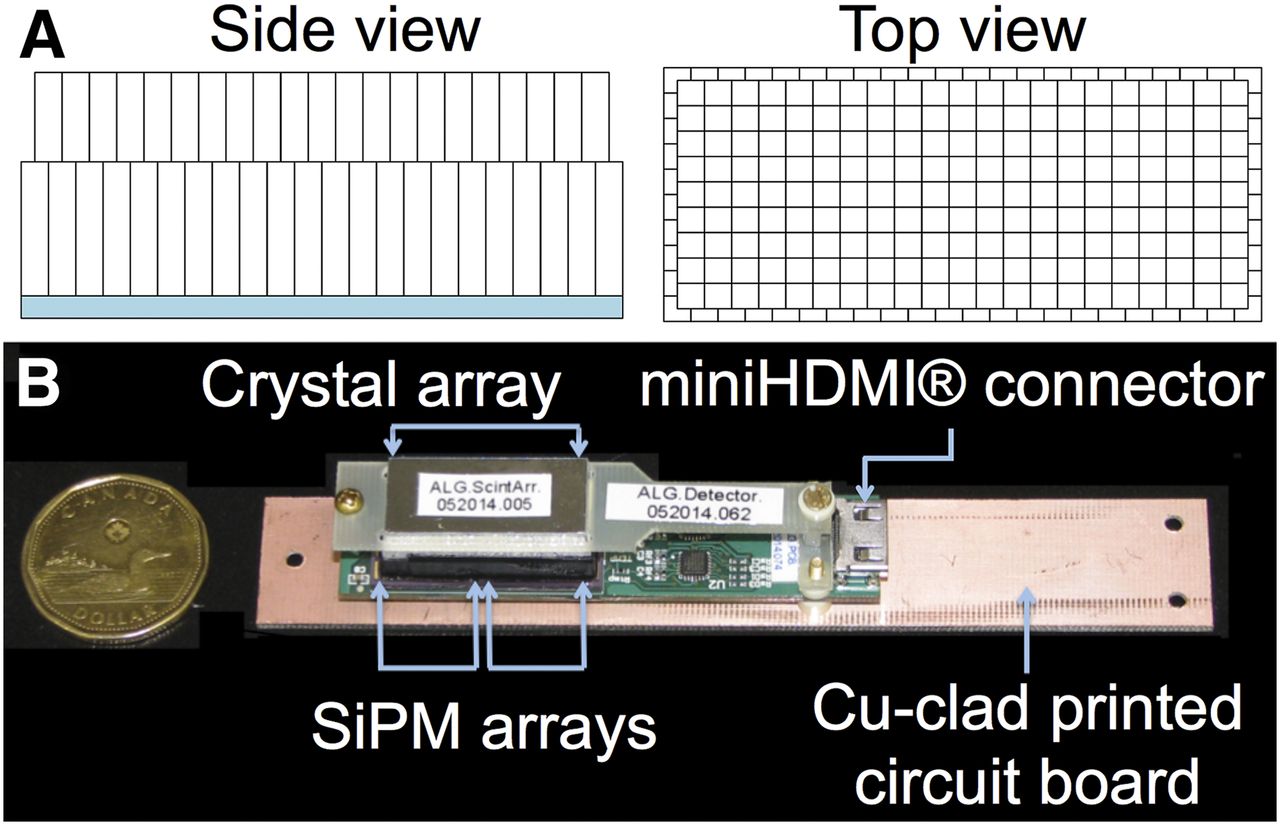
Sixteen detector-blocks were mounted to copper-clad printed circuit boards, which are mounted to plastic supports secured to a 60-mm-wide carbon-fiber tube. The geometry of the PET insert is summarized in Table 1. Figure 1B shows an assembled detector-block. Figure 2A shows the partially assembled gantry, making visible the 35-μm-thick copper foil on the printed circuit boards and lining the inside of the gantry for radiofrequency shielding from the MRI (17). The assembled gantry was sheathed in a woven carbon-fiber tube (Rockwest Composites) and closed with machined plastic caps (Fig. 2B).
Geometry and Features of PET Insert

Partially assembled ring of PET detector-blocks (A) and assembled PET insert (B).
Four detector-support boards supply power to the detectors and relay analog signals to detector boards in an OpenPET data acquisition system (25,26) via a 96-pin cable. Triggering of the OpenPET system is based on a voltage threshold, after which digitized (peak minus baseline) time-stamped signals are reported back to an acquisition computer via universal serial bus 2.0. OpenPET firmware was highly customized to output 8-byte singles packets, allowing acquisition of singles at rates of up to 5 Mcps.
Data Processing
Crystal identification and coincidence detection are performed retrospectively by software. An automated algorithm to segment flood histograms allows for rapid generation of crystal and energy look-up tables (27) used for crystal identification and energy discrimination (with a 300- to 800-keV window). The coincidence window was set to 10 ns (appropriate for the measured 5.4-ns singles timing resolution). Randoms rates were estimated using a delayed coincidence window.
Each crystal pair was mapped to a sinogram bin using nearest-neighbor interpolation to evenly spaced radial and angular intervals. Because complex geometric factors following from the dual-layer-offset detector design result in a situation where it is not possible to use conventional axial mashing approaches (as described by Michelograms (28)) to create a single set of sinograms, an alternative method was developed (29). In this work, sinograms were formed using 67 radial bins, 104 views, a span of 3, and a maximum ring difference of 19. Reconstructed sinograms were normalized with component-based normalization. Analytic reconstruction was performed using the filtered backprojection (FBP)–3-dimensional reprojection (3DRP) algorithm as implemented in the open-source reconstruction suite STIR (Software for Tomographic Image Reconstruction), version 3.0 (30).
PSF-MLEM Algorithm
A line-of-response–based PSF-modeling MLEM algorithm developed in-house was previously shown to produce images of very high contrast when tested on simulated data (19), but without incorporation of normalization. Because the PSF-MLEM system matrix accounts for many of the geometric factors that would be included in component-based normalization, normalization factors must be different from those for FBP. In an approach similar to that of Bai et al. (31), the system matrix was used to forward-project a known distribution of activity (a thin-walled annulus) so that the geometric factors incorporated in the system matrix could be determined and removed from the normalization factors.
The algorithm was further modified to remove persistent nonuniformity artifacts (28), resulting in a drastic increase in reconstruction time (25 iterations taking over 1 y with work split among 20 threads running on a PC with four 12-core AMD Opteron 6192 CPUs). Identification of massive symmetries in the system matrix allowed for less than 1% of nonzero system matrix elements to be calculated and the rest populated using these symmetries. Instead of using on-the-fly calculation, this small fraction of system matrix elements was computed once and saved to disk (occupying 1.5 or 5.8 GB of storage space for zoom-1 or -2 reconstructions, respectively) to be recalled during reconstruction, producing a more practical reconstruction time (25 or 105 min per iteration for zoom-1 or -2). Although not yet implemented, the ordered-subset expectation-maximization algorithm could further accelerate reconstruction time. For images shown in this paper, iterations were performed until there was no further visual improvement in image contrast.
PET System Performance
The PET insert was characterized in terms of spatial resolution, sensitivity, and noise-equivalent count rate (NECR), closely following the methods prescribed by the National Electrical Manufacturers Association (NEMA) NU 4-2008 protocol (32). Phantom images along with mouse and rat 18F-FDG images further illustrate the performance of the PET insert. Rodent imaging was performed in the 7-T Bruker MRI scanner as MR images were acquired.
Spatial Resolution
A 0.49-MBq 0.25-mm-diameter spherical 22Na source embedded in a 1.0-cm-wide acrylic cube (model MMS09; Eckert & Ziegler Isotope Products) was scanned at radial offsets of 0, 5, 10, and 15 mm at the axial center and again offset from the axial center by one quarter the length of the field of view (FOV) with at least 106 coincidences acquired per position. Source movement was enabled by a motorized stage with a positioning accuracy of about 15 μm over 5 cm of motion (Fig. 2B; model MN10-150-M02-21; Velmex). From reconstructed FBP-3DRP images (voxel size, 0.159 × 0.159 × 0.635 mm), the full width at half maximum and full width at tenth maximum were determined according to the protocol defined by the NEMA NU 4-2008 standard. Volumetric resolution (the product of full width at half maximum in the 3 orthogonal directions) was also calculated.
Sensitivity
A 22Na source like the one used to measure resolution but with an activity of 125 kBq was stepped along the axis of the PET scanner with a step size of 0.635 mm (half the crystal pitch) using the motorized stage, with 30 s of data acquired at each position. Randoms-corrected sinograms for each source position were formed, and for each view all sinogram bins farther than 1.0 cm from the highest-count bin were set to zero. The number of counts remaining in all sinograms was summed and divided by the acquisition time to yield the count rate, C. From this, sensitivity was calculated as Eq. 1
Eq. 1
where γ is the branching ratio of 22Na for positron decay, and A is the source activity. Sensitivity is plotted as a function of source position along the scanner axis.
NECR and Scatter Fraction
NECR was measured according to the NEMA NU 4-2008 protocol using the mouse-sized count-rate phantom. Beginning with approximately 40 MBq of 18F, data were collected using 10-min frames once per hour for 14 h. Sinograms of prompt and delayed coincidences were created; from these, rates of true (T), random (R), and scattered (S) coincidences were determined, and NECR was calculated according to Eq. 2
Eq. 2
Scatter fraction [S/(T + S)] is reported for a source activity of 3.2 MBq.
Phantom Images
To demonstrate the image quality achievable with this PET system, two phantoms were imaged: the NEMA NU 4-2008 image-quality phantom and a microresolution phantom (model 850.500; MI Labs). The 58-mm-long image-quality phantom was filled with 8.6 MBq of 18F and scanned in a 3-step step-and-shoot acquisition for 20 min per bed position, enabled by the motorized stage. This step-and-shoot protocol was repeated 4 times, and datasets for the same bed position were appended together. We chose to scan at a higher activity and for a longer time than prescribed by NEMA NU 4-2008 to avoid a dataset with a very low count due to low sensitivity and the need to scan in 3 bed-positions. The microresolution phantom, which has an axial length of 12 mm, was scanned in one 60-min acquisition after being filled with 8.7 MBq of 18F. The phantom contains groups of rods with diameters of 0.7, 0.8, 0.9, 1.0, 1.2, and 1.5 mm. Center-to-center spacing is twice the rod diameter.
Data were reconstructed with FBP-3DRP and the aforementioned PSF-MLEM method. The FBP reconstruction of the NEMA image-quality phantom was analyzed according to the NEMA NU 4-2008 protocol to quantify uniformity, recovery coefficients (mean image value along the center of the rods divided by mean image value in the uniformity region), and spillover ratio (mean value in each of the cold inserts divided by mean value in the uniformity region).
Rodent Images
Simultaneous PET/MR images of both a mouse and a rat were acquired and are presented in this paper to demonstrate the intended use of the PET system. The PET system was centered inside the MRI gradient coil.
A 4.47-MBq dose of 18F-FDG was administered to a 40.1-g 3xTG mouse by intraperitoneal injection (preferred to intravenous injection because of a higher success rate). After a 1-h uptake period, acquisition of PET and MRI data commenced with the mouse brain centered in the FOV with an 18 × 22 mm flat quadrature surface coil positioned above the brain. Half-Fourier single-shot turbo spin-echo MRI acquisitions ran for the entirety of the 20-min PET acquisition. The resulting 128 × 128 MR images had an in-plane resolution of 0.15875 mm.
A 14.8-MBq dose of 18F-FDG was administered to a 270-g Sprague–Dawley rat by intravenous injection. A custom-built radiolucent radiofrequency volume coil (33) was placed inside the PET system, with the rat’s brain centered in the FOV. Simultaneous PET/MRI began after a 50-min uptake period. Half-Fourier single-shot turbo spin-echo acquisitions were run for the entirety of the 30-min PET acquisition, resulting in 128 × 128 images with an in-plane resolution of 0.3175 mm.
RESULTS
The reconstructed spatial resolution throughout the FOV is summarized in Tables 1–3. In the axial center of the FOV, radial full width at half maximum ranged from 1.17 to 1.86 mm between the radial center and a 15-mm offset, and volumetric resolution ranged from 2.15 to 4.06 μL.
Spatial Resolution at Axial Center of FOV
Spatial Resolution at One-Quarter Axial Offset from Center of FOV
The sensitivity profile followed a characteristic triangular shape and peaked at 2.2% (Fig. 3). Firmware updates led to an improvement in the previously observed sensitivity of 1.9%. The sensitivity was previously reported inaccurately as 1.3% (18) because of misreporting of the source activity by the manufacturer. Figure 4 shows the mouse NECR as a function of source activity, along with corresponding rates of trues, scatters, and randoms. The NECR at 3.7 MBq was 11.1 kcps, and a peak NECR of 20.8 kcps was reached at 14.5 MBq. The scatter fraction at 3.2 MBq was 15.4%.
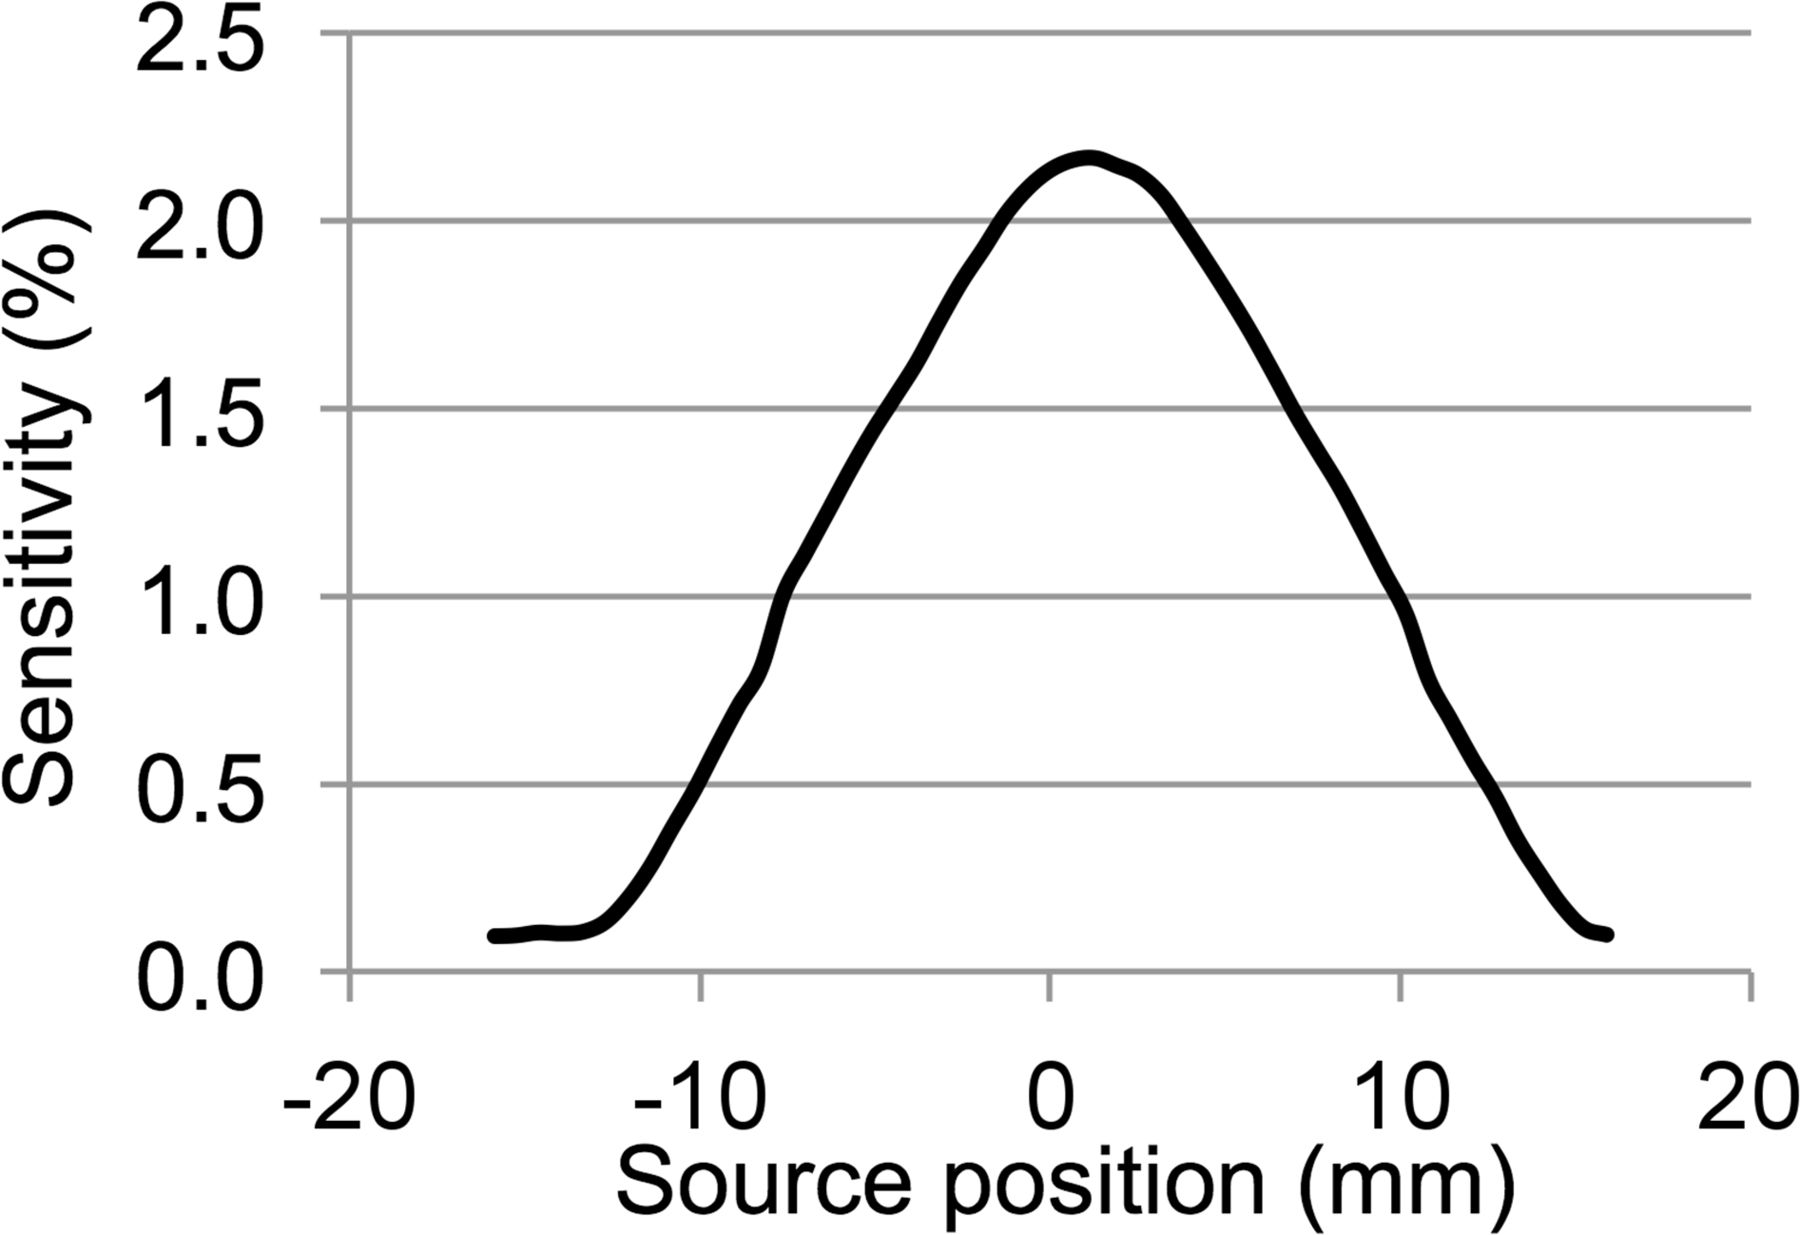
Axial sensitivity profile.
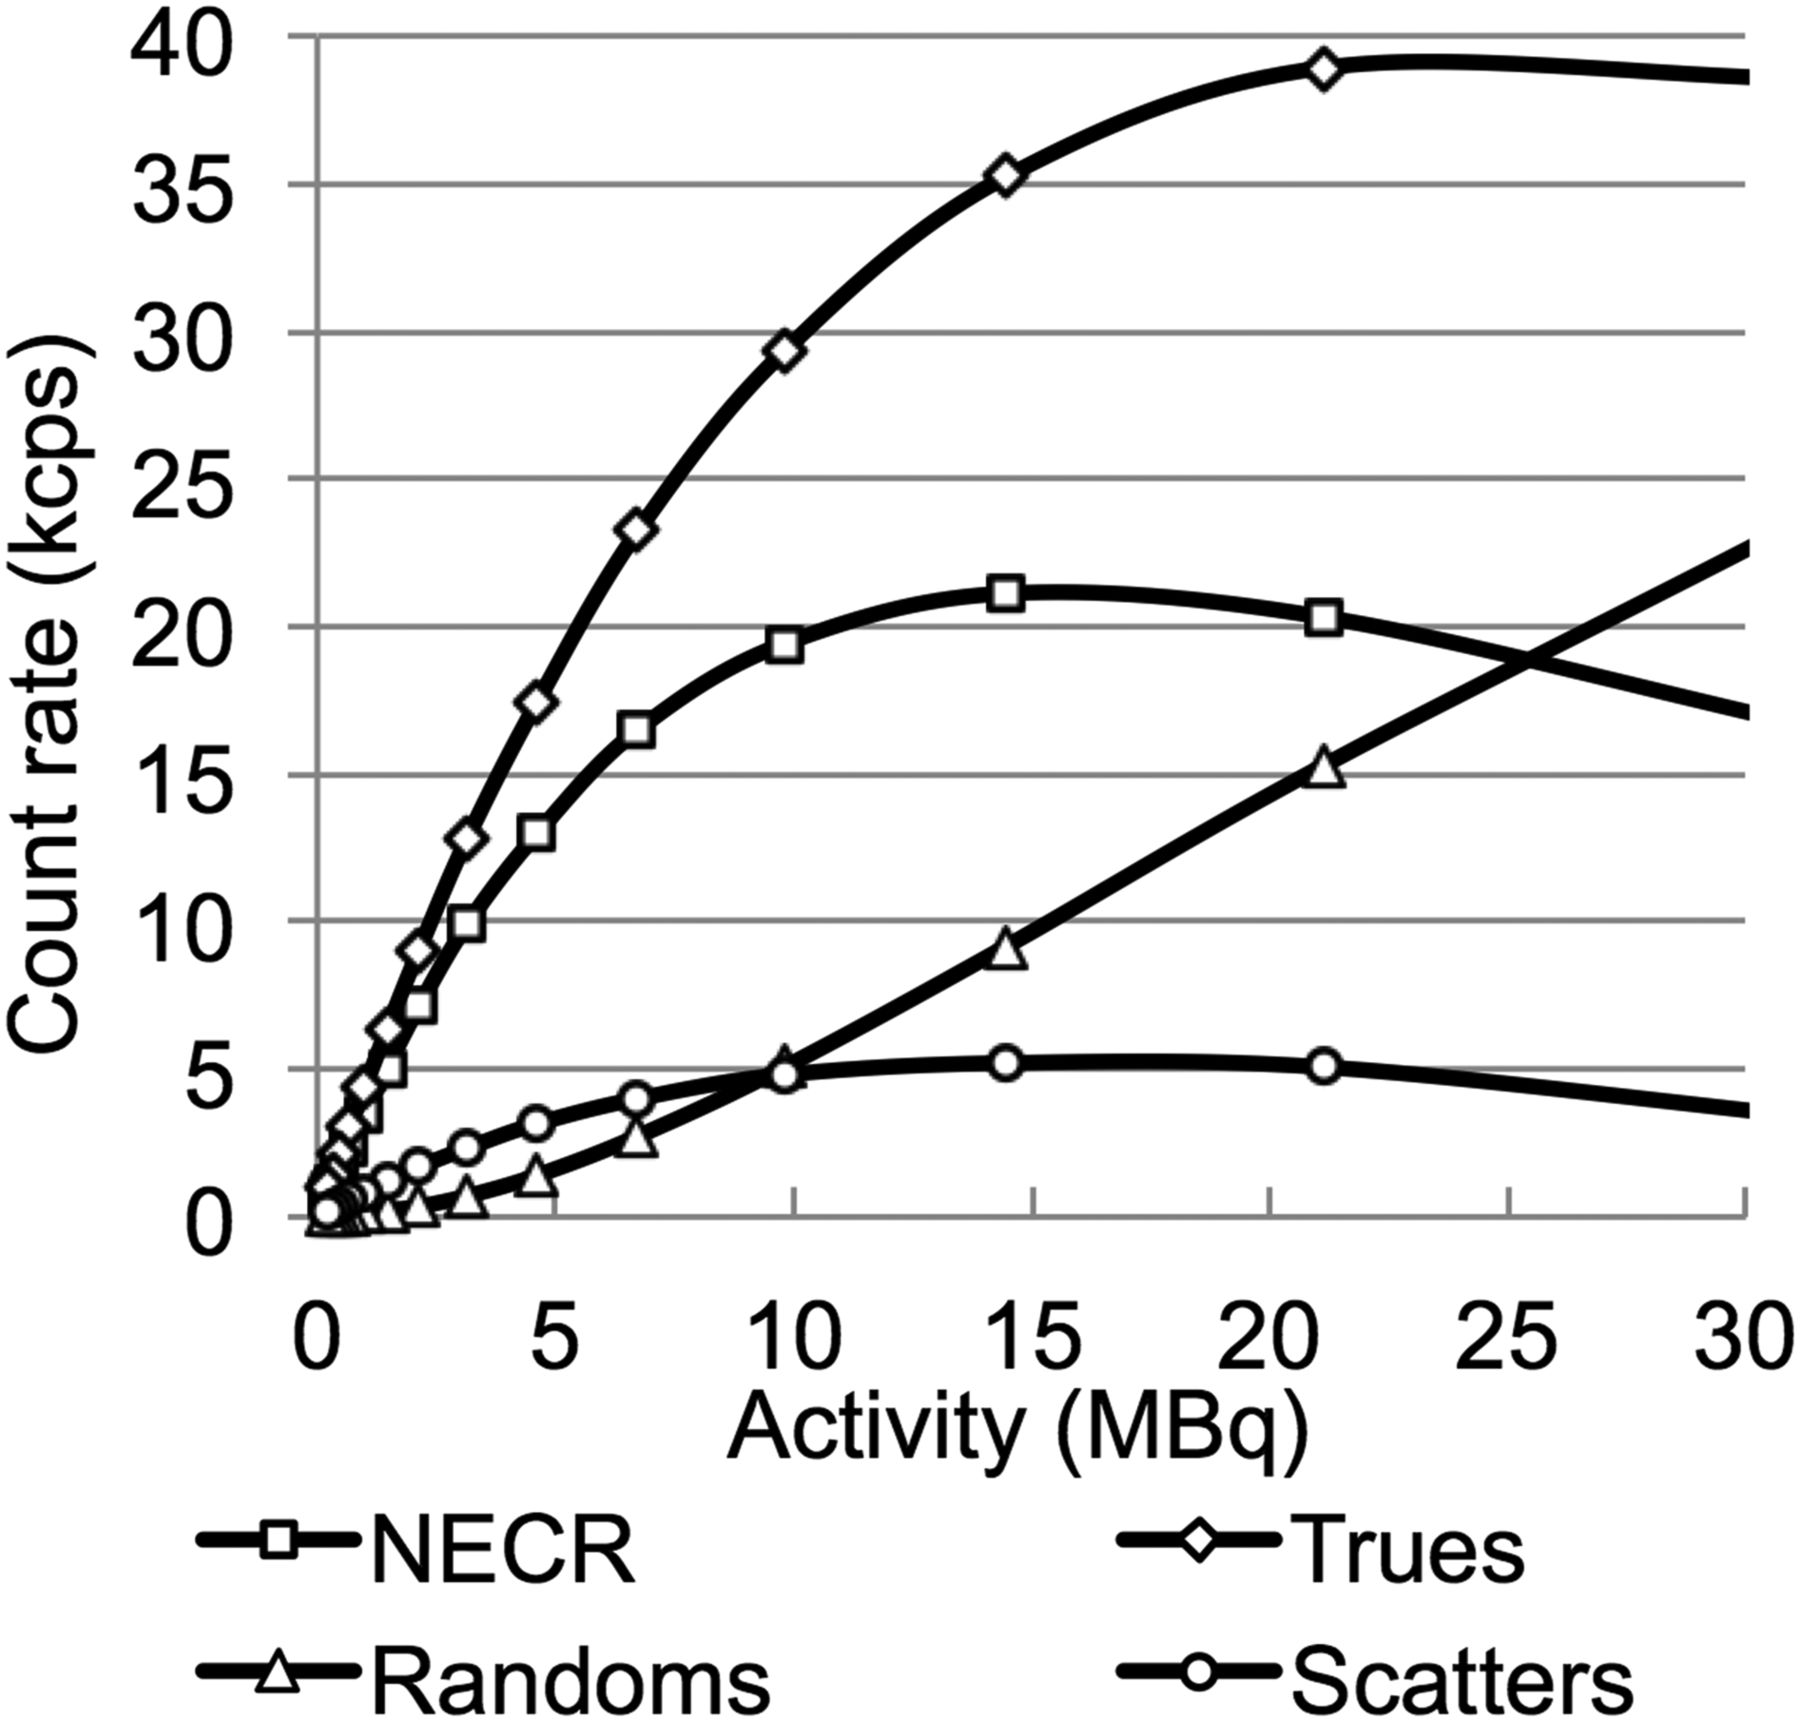
NECR as function of source activity for NEMA mouse-sized phantom, with corresponding rates of true, random, and scatter coincidences.
Zoom-1 FBP-3DRP and PSF-MLEM (30 iterations) reconstructions of the 3 sections of the NEMA image-quality phantom are shown in Supplemental Figure 1 (supplemental materials are available at http://jnm.snmjournals.org). All 5 rods were visible in the hot-rod section, and the uniformity section appeared uniform. The images, which were not quantitative because of lack of dead-time correction, were rescaled to have approximately the same value in regions where bed positions overlapped. Uniformity, recovery coefficients, and spillover ratios resulting from both FBP-3DRP and PSF-MLEM reconstructions are shown in Table 4. The recovery coefficients were generally higher when PSF-MLEM was used.
Analysis of NEMA Image Quality Phantom
Figure 5 shows zoom-2 reconstructions of the microresolution phantom made with FBP-3DRP (left) and 99 iterations of PSF-MLEM (right). The FBP-3DRP reconstruction resolved rod sizes as small as 0.9 mm, whereas the PSF-MLEM reconstruction resolved even the smallest rods, which were 0.7 mm wide. At a resolution so high that resolvable feature sizes are comparable to the average positron range (0.85 mm for 18F (34)), further improvements to the algorithm would likely need to account for positron range in the system matrix (35).
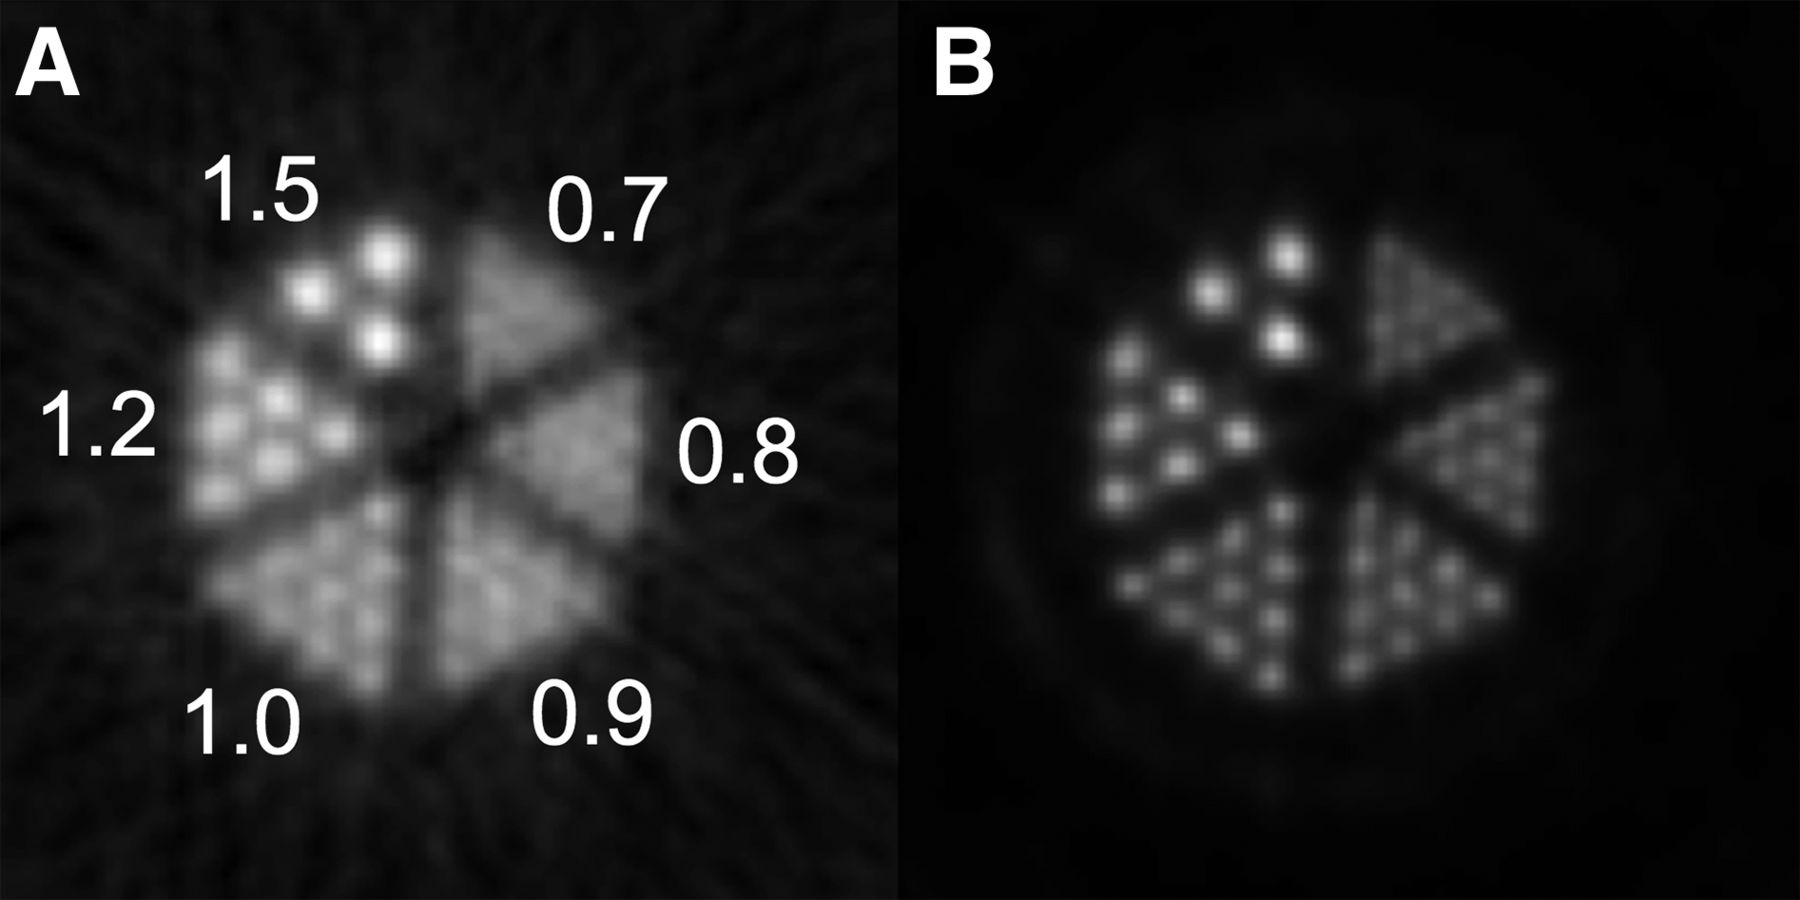
Reconstructions of microresolution phantom made using FBP-3DRP (A) and PSF-MLEM (B). Both images are cropped to 32 × 32 mm area. Insert diameters are indicated in millimeters.
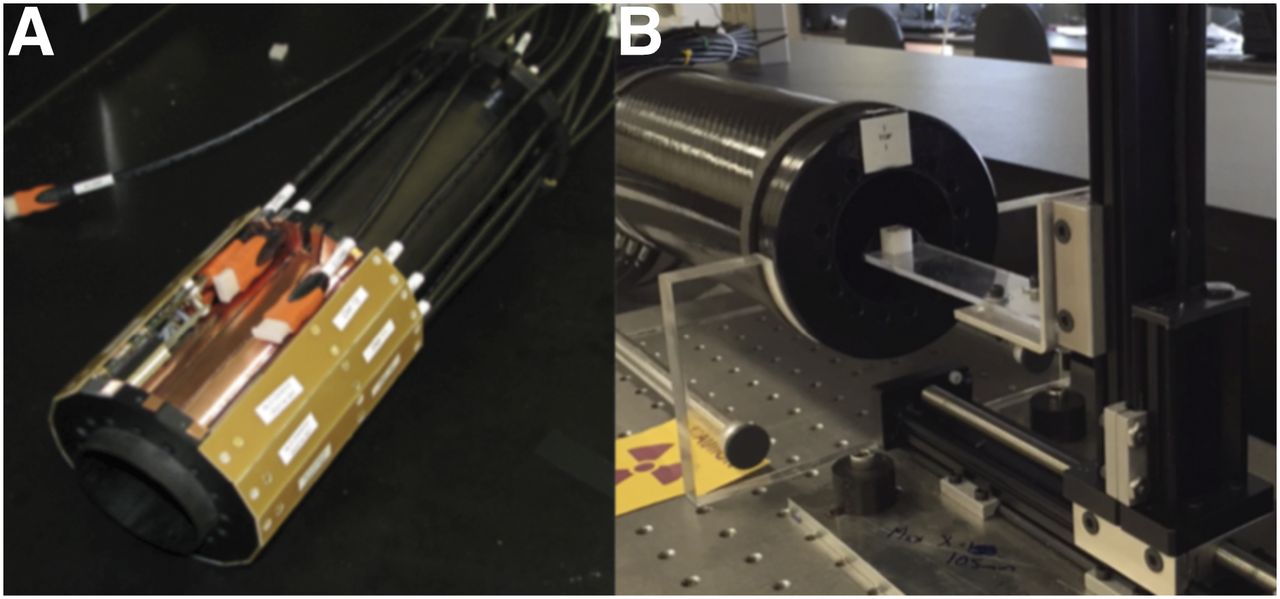
Zoom-1 PSF-MLEM reconstructions of the mouse and rat brains (respectively, using 21 and 25 iterations) are shown in Figure 6, along with fused MR images. Corresponding FBP-3DRP reconstructions are shown in Supplemental Figure 2. PSF-MLEM produced rodent images that were much more capable of resolving structures within the brain, showing clear separation between the cortex and the basal ganglia. As expected, regions in the MR images that were clearly identifiable as cortex corresponded to high 18F-FDG uptake in the PET images.

(A–C) 18F-FDG PET image of mouse brain reconstructed with PSF-MLEM (A), PET image fused with MR image (B), and unfused MR image (C). (D–F) Corresponding images for rat brain. All images are cropped to 42 × 42 mm area.
DISCUSSION
An MR-compatible small-animal PET insert was characterized in terms of spatial resolution, sensitivity, and NECR. Spatial resolution in the center of the FOV outperformed that of the commonly used Siemens microPET Focus 120, Focus 220, and Inveon preclinical PET scanners, for which the respective radial resolutions at 5-mm offsets are 1.92, 1.75, and 1.63 mm (36). At a 15-mm offset, these systems compared closely to ours in terms of radial resolution (1.99, 1.82, and 2.03 mm). The spatial resolution of the MR-compatible preclinical PET insert reported by Ko et al. (12) is nominally the same as ours in the center of the FOV but degrades with radial offset faster than ours because of lack of depth-of-interaction measurement (volumetric resolution of 1.93 and 7.27 μL at 0- and 14-mm radial offsets, respectively). The Hyperion-IID (a digital-SiPM–based MR-compatible PET insert) was shown to resolve a rod size as small as only 0.8 mm using an MLEM reconstruction algorithm (14)—slightly below the performance of our PET system.
NECR and peak sensitivity were notably poorer than in other preclinical PET systems; however, this was largely due to the low geometric factor following from the limited axial FOV. The peak sensitivity of the microPET Focus 120, Focus 220, and Inveon are, respectively, 3.42%, 2.28%, and 6.72% (36), compared with 2.2% for our system when using a similar energy window. At 3.7 MBq, these systems have a mouse NECR of 66.5, 47.3, and 129.0 kcps, respectively, all exceeding the 11.1 kcps that we measured. The Hyperion-IID has a peak sensitivity of 2.6% using a lower energy limit of 250 keV (37). The MR-compatible PET insert by Ko et al. has a reported peak sensitivity of 3.36% (38) and a mouse NECR of 23.4 kcps at 3.7 MBq (12) while using a lower energy limit of 250 keV. This sensitivity figure is comparable to that of our system. Analysis of singles data suggests that our system is characterized by paralyzable block-level dead time in excess of approximately 1.3 μs. Such a large dead time would compound with our low geometric sensitivity to explain our low NECR performance. Future versions of our PET insert design will have an axial FOV between 2 and 3 times longer than the prototype and reduced dead time, resulting in large gains in sensitivity and NECR.
PET images acquired simultaneously with MRI and vice versa showed no signs of interference. In a previous study of the MR compatibility of our PET insert (17), no significant effect on the PET system due to the MRI was observed, and the PET system introduced only minor degradations in B0 homogeneity (0.16–0.26 ppm) and no significant drop in image signal-to-noise-ratio during multislice, multi-echo; rapid-imaging-with-refocused-echoes; and fast-low-angle-shot pulse sequences. However, a 9% drop in signal-to-noise ratio was observed for echo-planar imaging sequences.
CONCLUSION
This MR-compatible PET insert can obtain high-resolution PET images while functioning inside a 7-T MRI scanner with very little intermodality interference. PET image quality is especially good when the custom-made PSF-MLEM reconstruction software is used. NECR and sensitivity are low compared with most PET systems because of the short axial length of the scanner and high dead time of the current prototype.
DISCLOSURE
This work was funded by Mitacs Accelerate Cluster Grant IT04494 to Vesna Sossi and Andrew L. Goertzen partnered with Cubresa Inc. (Winnipeg, Canada); Natural Sciences and Engineering Research Council of Canada Discovery Grants to Christopher J. Thompson (36672), Andrew L. Goertzen (341628), and Vesna Sossi (240670); and the University of Manitoba Amalgamated Research Fund. The radiofrequency coil used for the rat imaging was supplied by Cubresa Inc. at no cost. No other potential conflict of interest relevant to this article was reported.
Acknowledgments
We thank Drs. Melanie Martin and Richard Buist from the University of Manitoba In-Vivo Experimental Animal Magnetic Resonance Microscopy Centre for assisting with PET/MR imaging, Dr. Michael Jackson of the University of Manitoba Small Animal and Materials Imaging Core Facility for assisting with animal handling, Drs. Dali Zhang and Ji Hyun Ko from the Neuroscience Research Program at the University of Manitoba for assisting with rat imaging, Dr. Benedict Albensi from the Department of Pharmacology and Therapeutics at the University of Manitoba for supplying the mice, and Bob Miller of the Medical Devices Group at CancerCare Manitoba for assisting with PET insert gantry design and fabrication.
Footnotes
Published online Sep. 14, 2017.
- © 2018 by the Society of Nuclear Medicine and Molecular Imaging.
REFERENCES
- Received for publication May 1, 2017.
- Accepted for publication September 11, 2017.


